
Abstract
This preliminary study investigates the relationship between cooking skills ‘CS’ (ability to prepare food), food skills ‘FS’ (educational level about food and nutrition), sociodemographic factors (age, gender, height, weight, physical activity levels, and predefined diets), psychological behaviour (how mood states influence food intake), interest in a healthy sustainable lifestyle, and other food-centric factors. Using self-reported data from a total of 126 participants from 2 distinct surveys, the results mainly show a positive correlation between food-related scores like CS and FS, and differences in external factors (eg, social environment) that influence eating habits. While some relationships between self-reported behaviour and actual nutrition are limited due to the studies design and scope, the findings highlight the critical role of CS and FS in promoting sustainable eating habits, weight management, and cooking skills. The study emphasises the need for further research and the development of educational strategies to improve dietary behaviour and overall well-being. Another contribution is the publication of all developed tools and apps for free use to promote future research.
Introduction
In their report from 2017, 1 the World Health Organisation calls obesity ‘a global epidemic’, from which approximately 2.8 million people die every year. With a fatality rate this high, research focuses heavily on figuring out, how people’s food intake is affecting their physical health state. 2 A person’s diet affects the risk of becoming overweight or obese, with poor choices raising the risk. 3 Food skills (FS4,5; Supplemental Table 6) and Cooking Skills (CS 6 ; Supplemental Table 5) encompass a wide range of knowledge and abilities beyond actual cooking, including meal selection, planning, shopping, budgeting, and food safety. A lack of these skills can lead to reliance on processed or convenience foods, which are often high in calories, sugar, and unhealthy fats, contributing to obesity. 7 Developing FS and CS empowers individuals to make healthier choices, supporting weight management and overall well-being.
Over the past few decades, there has been a growing recognition of the significance of FS and CS in promoting healthier and more sustainable lifestyles. 6 Proficiency in cooking not only impacts individual dietary choices but also plays an important role in addressing global challenges such as obesity, malnutrition, and sustainability. Related Research indicates a strong association between cooking frequency and dietary behaviour, with individuals who cook regularly tending to consume healthier diets characterised by higher intakes of fruits, vegetables, and whole grains. 8 Conversely, reliance on convenience foods and ready-to-eat meals is linked to poor dietary choices and an increased risk of chronic diseases. 7
Despite the advantages of home cooking, there is a concerning shift towards relying more on ready-to-eat options due to factors such as time constraints, financial considerations, and a preference for convenience. 9 Addressing this issue requires coordinated initiatives to promote cooking education and cultivate culinary skills.
The focus of this work lies in examining the relationships between FS and CS, with mood and sustainability considered as secondary aspects.
Related Work
A bunch of work has been done to explore the correlations between various factors connected to food. In the scope of this paper, the focus is put on the educational part, like FS and CS, and mental factors.
FS- and CS-Centric
Evaluating correlations between FS and other features requires reliable methods to measure FS. Various researchers have developed questionnaires to assess FS, each posing unique methodological challenges due to the lack of a standardised reference. 4 Thus, Kennedy et al 5 designed a validated FS questionnaire covering confidence in budgeting, selecting produce, meal planning, and basic cooking techniques, along with hygiene and food safety. Another study 10 asked university students to rate their confidence in meal planning and preparation, revealing higher confidence in simpler tasks like chopping compared to complex ones like meal planning.
Lavelle et al 6 emphasised the distinction between CS and FS, developing separate questionnaires for each. Their work demonstrated that CS and FS are distinct but related, and both are essential in the home cooking environment. These studies typically employ self-assessment via Likert scales to quantify FS. FS are critical for healthy eating, as better FS enable healthier meal choices11-13 and vice-versa. 14 Tools like the NutriScore, a front-of-pack label introduced in 2017, 15 help consumers make healthier food choices by indicating nutritional quality through a colour-coded system, with evidence supporting its effectiveness in guiding healthier purchasing decisions. 16 Dietary behaviour is influenced by FS more than CS, as shown in a national survey in Australia. 17 Although these studies highlight the importance of FS, they also suggest that other factors influence dietary habits.
Mood-Centric
The relationship between dietary habits and mental health has been explored in various studies. Insufficient nutrition is linked to decreased mood states, advocating for dietary improvements to enhance mental well-being. 18 The SMILE trial demonstrated that a Mediterranean diet with personalised nutritional advice significantly improved depressive symptoms. 19 Emotional eating, driven by both positive and negative emotions, often leads to unhealthy dietary choices and associated health issues.20-22 Mindful eating practices, which involve being present and aware during food consumption, have been positively correlated with mental well-being. 23
The Profile of Mood States (POMS) 24 is a tool used to measure various mood aspects and has been applied in nutrition studies to assess the impact of diet on mood changes.25-27
Moreover, there is evidence that there is a link between diet types, macronutrients, and mood. Macronutrients such as proteins, carbohydrates, and fats play a significant role in influencing mood and mental health. For instance, a study on undergraduate military trainees found that higher carbohydrate intake improved mood, whereas protein and fat intake showed no significant relationship with mood. 28 Similarly, a cross-sectional survey of young females indicated that those following a weight-control diet with a balanced intake of macronutrients had lower risks of depression and anxiety. 29 Research also suggests that carbohydrate-rich, protein-poor foods can improve mood and reduce stress by increasing brain tryptophan and serotonin levels, especially in stress-vulnerable individuals. 30 However, another study found no significant change in mood following the consumption of high-protein versus high carbohydrate meals. 31 The type of diet—whether vegan, vegetarian, omnivore, or pescetarian—also affects mood. Increased restriction of animal foods has been associated with mood improvement in vegans and vegetarians. 32 Furthermore, consuming high-quality food, regardless of whether it is meat-based or plant-based, can help reduce symptoms of depression. 33 These findings underscore the importance of dietary behaviour in influencing mood and highlight the need for more research on the impact of dietary choices on mental well-being.
Goals and Contribution
This study aims to comprehensively explore how CS and FS shape various aspects of individuals’ lives, including dietary behaviour, food intake, health outcomes, and environmental context. The research further explores the correlations between food and mood, recognising that mood influences cognitive performance, behaviour, and physical health. For example, one of the most well-known relationships can be found between depression and food behaviour.34,35
The study consists of 2 surveys of a total of 126 participants using 2 similar online tools to track food consumption and mood changes, as well as static questionnaires like for example FS and CS.
Our contribution is twofold. On the one hand, we present our experimental preliminary results which mainly comply with results from related work and emphasise further research in the future. Among those preliminary results, we publish the anonymised raw data and the evaluation scripts. On the other hand, we published our tools used for food tracking and the questionnaires as well as lessons learned to improve this and similar methodologies. The tools were not only used to collect 1-time survey but also food intake data over time. They are capable of clustering, grouping, generalising and connecting food data to allow gathering additional insights in comparison to more traditional surveys collecting food logs.
The remainder of the paper is organised as follows. In section 2 the data collection process and the used tools are described in detail. The result of the preliminary study is reported in section 3. Finally, we discuss and summarise the findings in section 4.
Methods
In this study, we investigate several factors that may relate to food consumption, in particular: demographics, food skills, cooking skills, and psychological states.
To do so, an extensive data collection framework utilising online self-reporting surveys and 2 original similar food tracking applications were designed. The first application was used for the first survey and is easier to use due to its design and app-appearance. The second one was developed for the second survey and offers functionality for the mood-related research but is less comfortable to use. Apart from that, both applications are very similar and use the HUMMUS Knowledge Graph 36 which provides rich information about recipes, nutrition, ratings, tags, and ingredient hierarchies derived from the FoodOn Ontology 37 (An overview is given in Figure 1). The central idea is, that for the analysis step, the connected data can be used to infer more interconnected knowledge, for example, correlations of certain food-types between other variables. As an example, recipes can be automatically validated if they include (or do not) any food class like ‘nuts’, ‘vegetables’ or ‘dairy products’. Since this preliminary study is limited in scope, the graph is not fully explored but encourages future work.

Exemplary structure of the simplified HUMMUS Knowledge Graph. Most recipe relations are discarded. The FoodOn hierarchy is (mainly) a Tree-structure (meaning most nodes have multiple sub-nodes), but heavily simplified for visualisation.
By connecting the users’ daily food-centric habits to that information, it is possible to extract additional correlations. As an example, relationships between users with a mainly vegan diet in comparison to users without such a diet can be extracted with this interconnected data.
The study has been conducted in 2 sessions:
Thus, participants provided detailed information on their eating behaviour, mood, and food-related questionnaires, described in more detail in the following.
Participants
For this preliminary study, participants were selected using non-probabilistic convenience sampling, meaning that we included readily available individuals. We asked our computer science students to recruit at least 4 participants from their families or friends each. In total, 78 individuals from various nationalities (mainly Europe and southwest Asia) participated in the first study and 48 in the second (after data cleaning, thus excluding participants who had to be removed because they did not answer enough questions or did submit less than 10 meals). Among these participants, 56.35% were male and 43.65% were female, with the average age being 31.6 years (standard deviation of 10.93 years, ranging from 18 to 72 years).
Data Collection
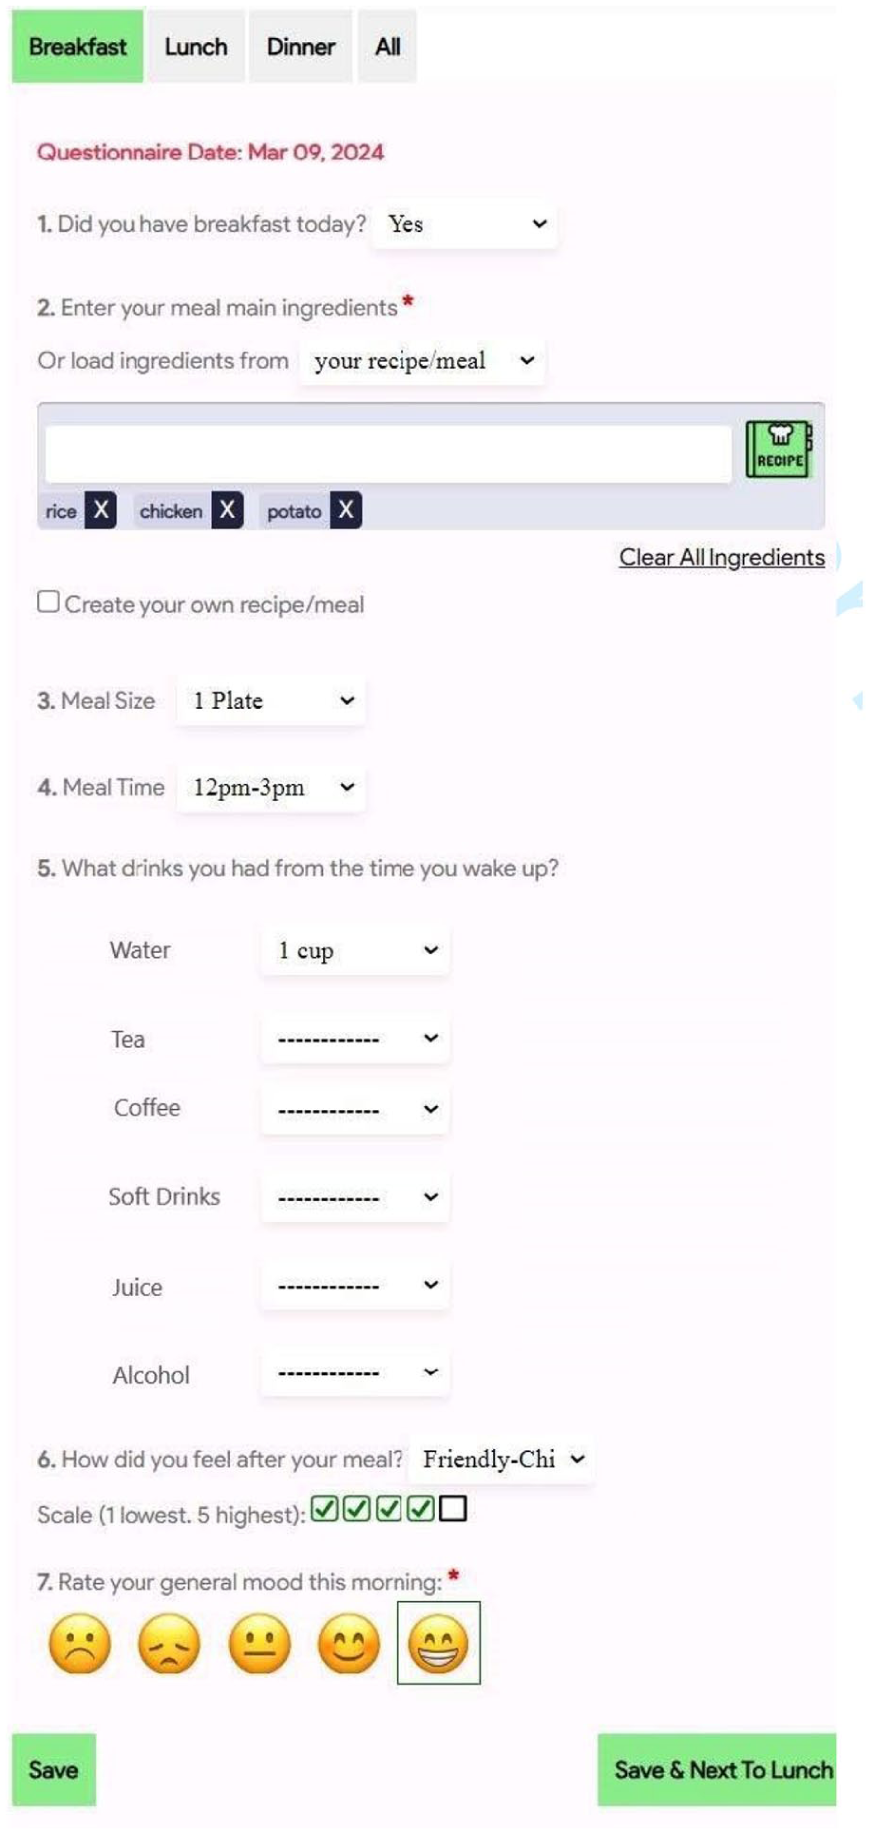
Data collection was conducted through the use of 2 dedicated online applications (screenshots are given in Figures 2 and 3) designed to gather detailed information about participants’ eating habits, cooking skills, and related psychological factors. Both online surveys were conducted using our original user-friendly applications that could be accessed via desktop computers or mobile devices. To improve usability the first app is designed as a Progressive Web App which allows the participants to install it like a native app on their phones. The second application was a simple web page.

Screenshots of the first app. It shows an exemplary questionnaire, the search page for recipes, the text field where additional information can be added to the bookmarked recipe, and the home screen after adding meals.
Screenshots of the second app. It shows the text field where a meal and additional information can be added.
The first survey focussed on FS- and CS-centric correlations with food intake, while the other one on correlations between mood-centric features and food intake.
Learning from the first survey (which included a free-text feedback field), the second enabled users to also submit custom meals instead of only asking them to track the most similar recipe to their actual intake.
Initial Data Collection
In the first phase of data collection of both surveys, participants were required to complete an initial set of questionnaires that covered personal information and various lifestyle habits. The full list of questions is provided in the Supplemental material.
This phase aimed to gather baseline data and included questions on age, gender, height, weight, physical activity levels, and general eating habits (predefined diets). Once they completed their profile, they could not revise their answers.
Questionnaires
The second phase (only conducted for the first survey) consists of a variety of questionnaires that are used to gather detailed information on participants’ food skills, cooking skills, and sustainability concerns.
Food Skills (FS): The FS questionnaire is adapted from the one developed by Lavelle et al. 6 It is primarily focussed on the frequency of specific food-related activities rather than participants’ confidence in performing these activities. An adjustment was made because frequency-based questions were deemed more appropriate for assessing habits such as using a grocery list or buying seasonal produce. Participants responded using a five-point Likert scale with options ranging from Never to Always.
Cooking Skills (CS): The CS questionnaire 6 is used to assess participants’ confidence in various cooking techniques. Participants rated their proficiency in 14 different cooking skills, including chopping vegetables, blending foods, steaming, boiling, roasting, frying, baking, and using herbs and spices. Confidence was rated on a scale from 0 to 5, with 0 representing never/rarely do it and 5 signifying very good.
Food Sustainability Concerns (FSCI): The FSCI questionnaire 38 evaluates how much importance participants placed on sustainability when choosing food products. It covers 13 aspects of food production, including environmental impact, animal welfare, carbon emissions, and human rights. Participants rated the significance of each aspect on a fivepoint scale. The questionnaire asked participants to rate their agreement with statements about sustainability on a scale from 1 to 5.
Index of Organic Consumption Intensity (OCI): This questionnaire 38 evaluates participants’ knowledge and consumption of organic products, using a 5-point Likert scale for all 4 questions.
Index of Sustainable Lifestyle (SLI): This questionnaire 38 assesses participants’ engagement in sustainable practices beyond food consumption. It also uses a 5-point Likert scale for its 5 statements.
Motivation Index (M): This questionnaire 39 is focussed on the motivations behind BMI objectives (ie, diets), also using a 5-point Likert scale to figure out which motivation types are frequently used in which context.
Daily Submissions
The third phase of data collection focussed on tracking participants’ daily food consumption for usually 7 consecutive days. Participants were required to track at least 10 meals, but no limitations were put on when (eg, multiple times a day or just from time to time). In average, most participants provided multiple meals each day for a week. In addition, each study tracked a variety of other features together with the food intake.
In the first study, users also added additional details such as the time of the meal, meal type (breakfast, lunch, dinner, snack), portion size, cooking type (CT), 5-point post-meal satisfaction, 5-point subjective food satiety, distractions (DIST) while eating (eg, watching TV, using phone, talking), the environment (ENV; eg, home, restaurant), and the social environment (SENV; eg, alone, with family) in which the meal was consumed. The recipes included detailed nutritional information and NutriScore ratings to provide comprehensive dietary data.
In the second study, the following psychological variables related to eating experiences and mood were assessed.
Profile of Mood States (POMS): The Post-meal feeling assessment uses a modified POMS scale. Inspired by, 40 participants were asked ‘How did you feel after your meal?’. The scale is also influenced by the POMS2 short form, 41 which provides easily understood synonyms. While most adjectives remained the same, Friendliness was expanded to include Friendly and Chill, and Vigor-Activity was described as Energetic and Hyper. The reason was feedback from users in a test run which did not understand the scale, and thus the slight adaptation to the food context. Participants selected none or any responses from a drop-down list, each option rated on a 1 to 5 subscale intensity.
General Mood (GM): As the design of POMS is a bit complicated, thus we included a general mood rating collected with every meal. Inspired by, 42 it uses a simple 5-point Likert scale represented by emojis for visual and intuitive response selection. The aim was to assess more of an overall mood state. The main reason to introduce this one was the feedback of users in a test run which did not understand POMS due to its complexity and then preferred not to answer at all.
Through these questionnaires and tracking mechanisms, this study analyses the interplay between dietary habits, food-related skills, and various psychological and sociodemographic factors. The results are discussed in the following section.
Statistical Methods
The following statistical tests are used to investigate the correlations between features based on their type.
Pearson Correlation for the experiments involving 2 continuous features or variables;
Point-Biserial Correlation for the experiments involving a continuous and a binary variable;
Chi-Square algorithm for 2 categorical variables;
One-Way ANOVA for occasions where continuous features are compared to categorical ones;
Pairwise Tukey’s HSD for finding differences in all pairwise combinations if ANOVA results reported a statistical significance.
Results
In this section, we provide the most interesting or unexpected (also negative) results. For further analysis refer to Table 1, Figure 4, or the published original data and our analysis tools. In the following, we denote with r the correlation coefficient and with p the corresponding p-value.
Correlation Table Between Multiple Features of Both Surveys.
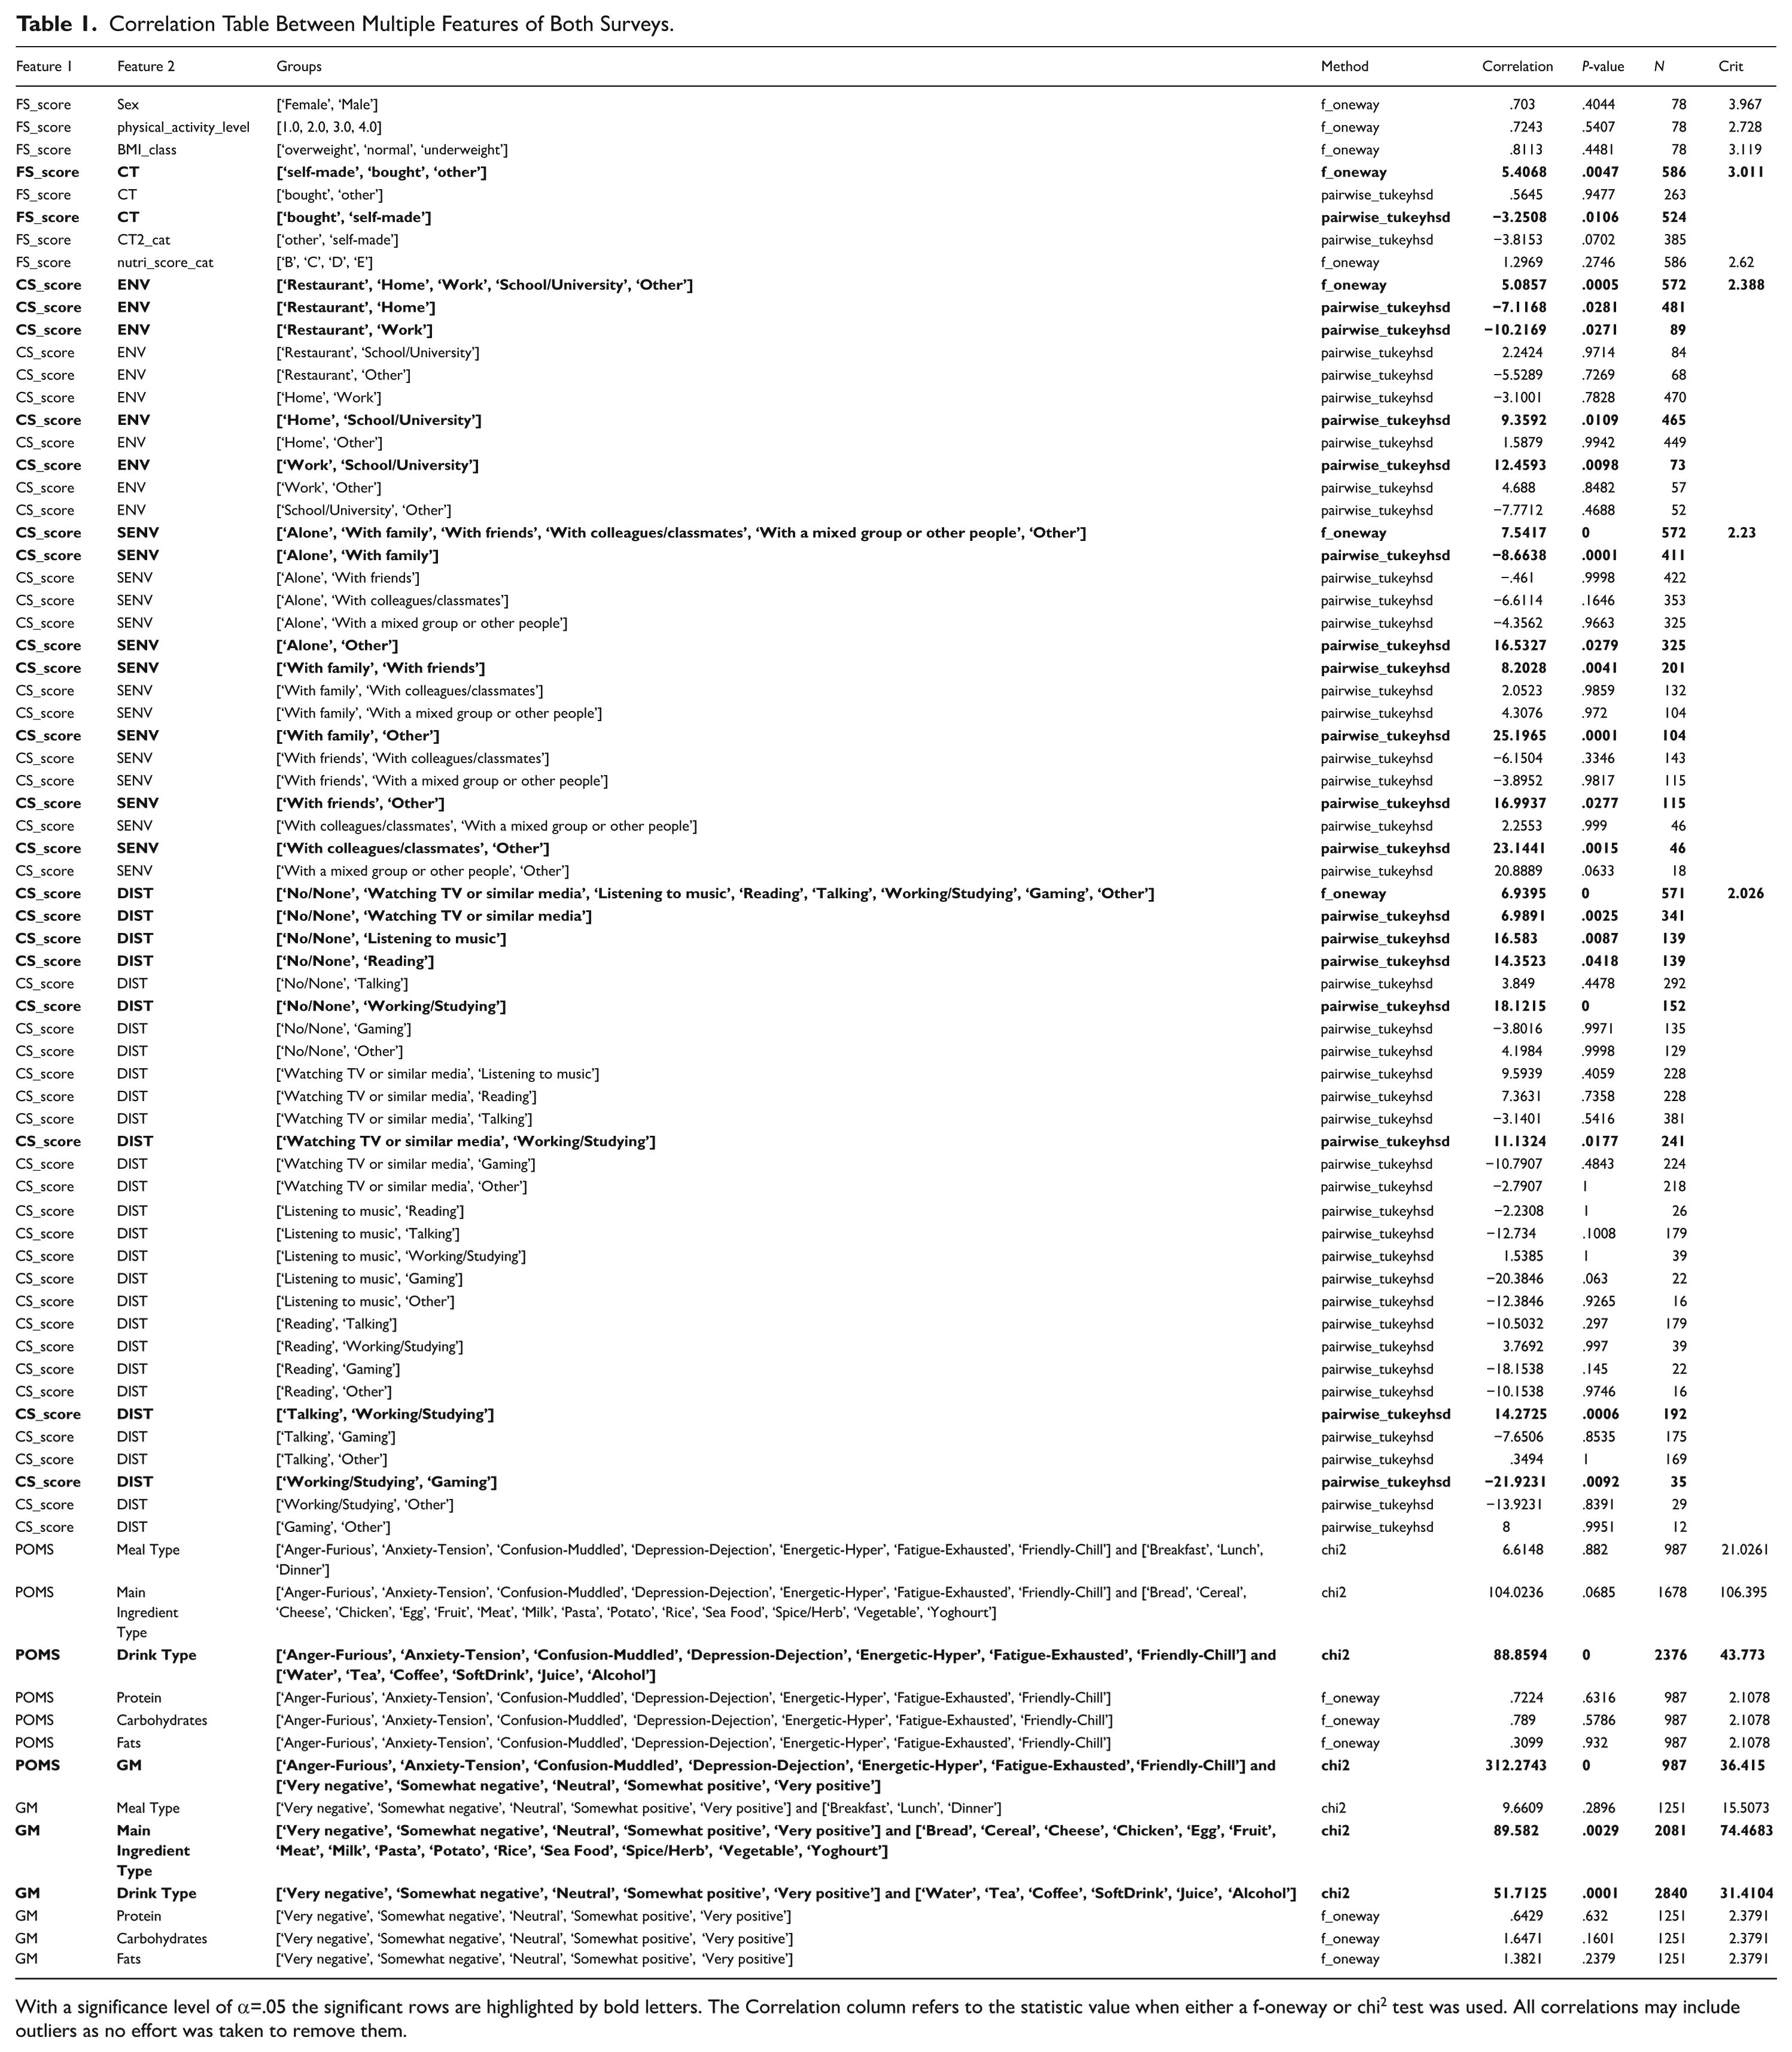
With a significance level of α=.05 the significant rows are highlighted by bold letters. The Correlation column refers to the statistic value when either a f-oneway or chi2 test was used. All correlations may include outliers as no effort was taken to remove them.
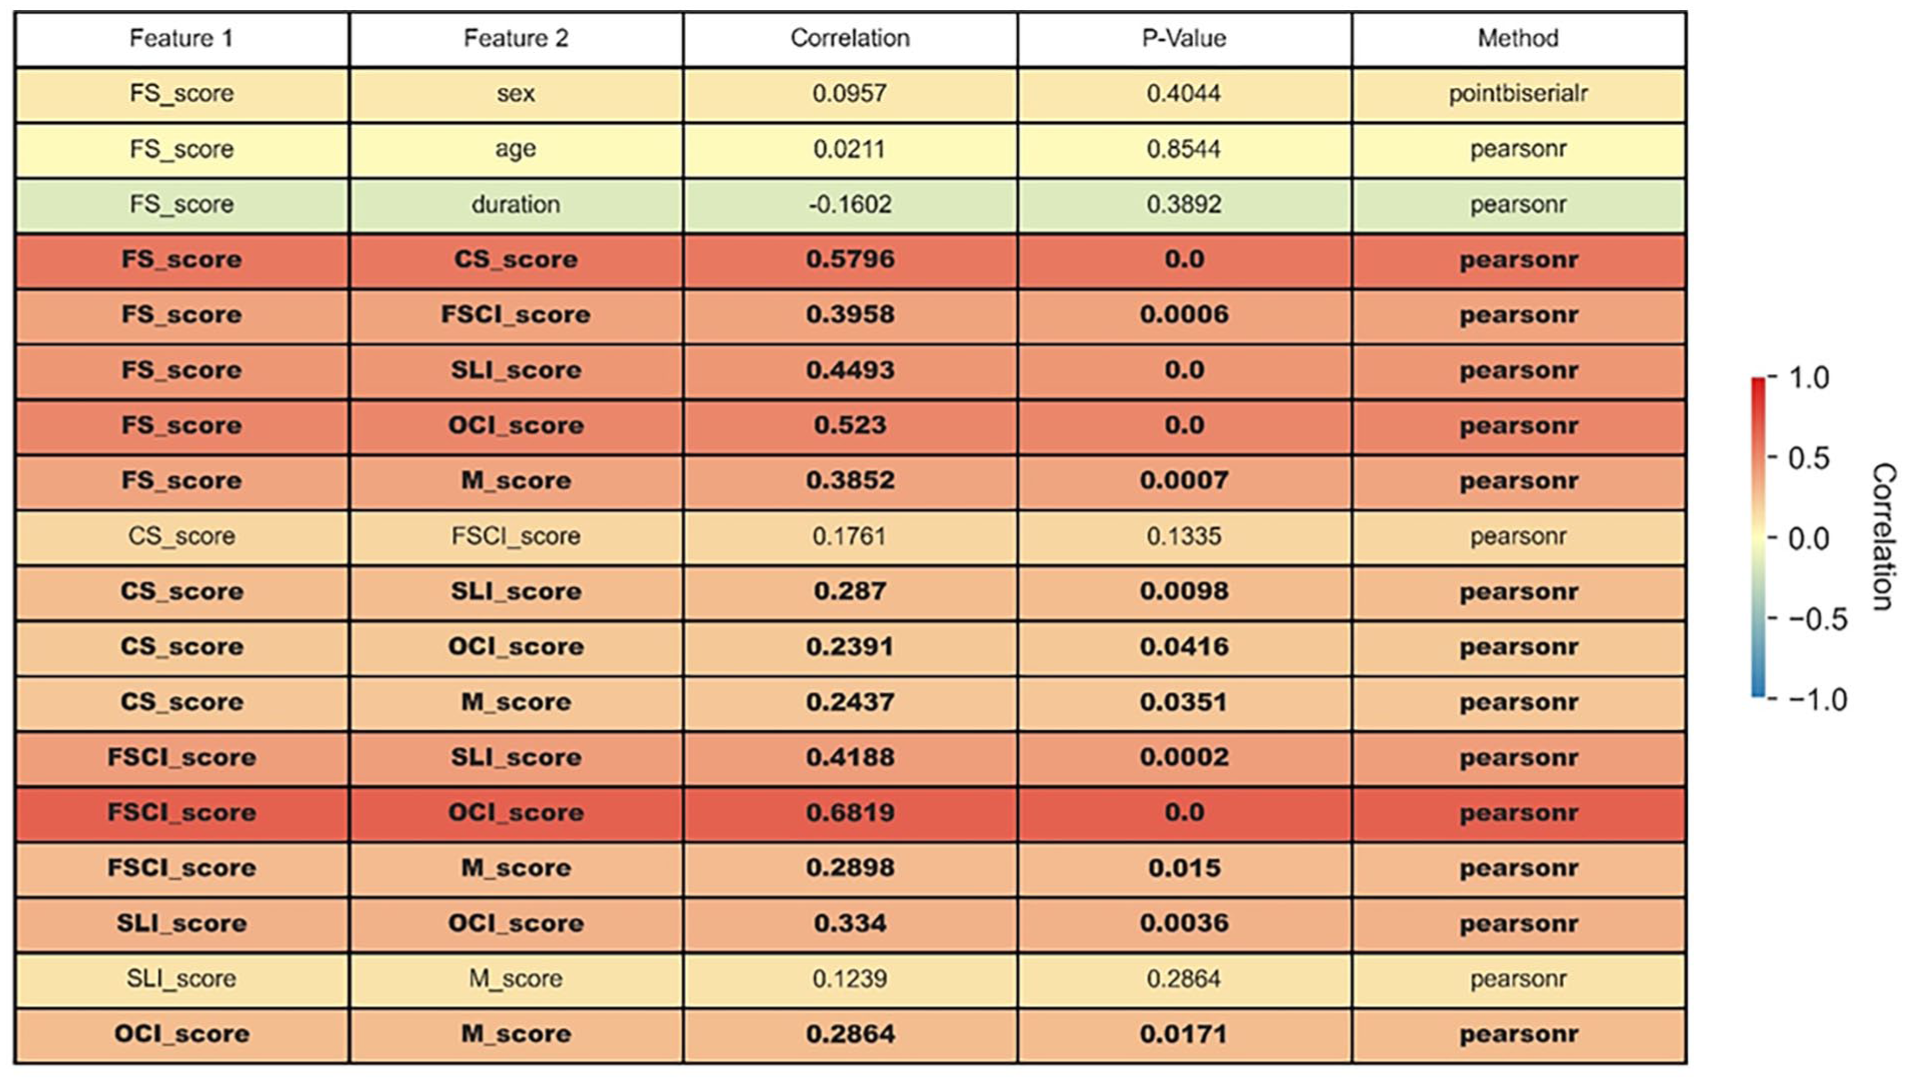
Correlation table between multiple features of the first survey. The direction and power of the correlations are colour-encoded. With a significance level of α = .05, the statistically significant rows are highlighted by bold letters. All correlations may include outliers as no effort was taken to remove them.
Survey 1
In the following, the first survey’s results, conducted to explore correlations between cooking skills (CS), food skills (FS), and sustainability-related concerns in relation to food intake, are reported.
FS and Age
When people become older, they gain life experience, manage their household for longer, and face the task of creating meals on their own ever more frequently. Their food knowledge and expertise might grow over time by dealing with the whole meal preparation process. Therefore, one can assume, that the older a person is, the higher their FS should be.
However, this relationship between age and FS cannot be found in the dataset, r = .02, P = .85). A reason, why no such correlation can be seen in this population, could be, that around 90% of the respondents are between the ages of 20 and 35, not representing the actual population well. Improving the skill set may also be capped at some age, because of changes in the social environment, living standards, or because people tend always to cook their favourite go-to dishes. We cannot confirm this expectation as in our analysis the FS score does not correlate with age. As to our small number of older participants more research in this direction might be interesting in the future. Interestingly, even removing the outliers from the sample does not have a significant effect on the result, as can be seen in Figure 5. As both results are not statistically significant the hypothesis can also not be denied either.

The FS-Score compared to the respondent’s age with and without outliers. The version with outliers does not correlate and is not statistically significant (r = .02, P = .85 with α = .05). The version without outliers has a weak correlation but is also not statistically significant (r = .27, P = .13 with α = .05).
FS and CS
When cooking at home, you typically take care of the whole meal preparation process, from planning and grocery shopping to chopping and cooking, as well as handling and processing leftovers. With every meal that is made, the expectation is that 1 improves not only their mechanical cooking skills but their food skills as a whole.
The CS-Score is derived by summing up the answers given on the CS questionnaire, ranging from 0, if an action is never or just rarely performed, and 1 for ‘Very poor’ to 5 ‘Very good’. Looking into the data, the participants’ CS-Scores and FS-Scores show a positive correlation (r = .58, P < .01), which can be seen in the plot shown in Figure 6. Therefore, the hypothesis, that a higher CS corresponds to a higher FS can be confirmed with the study data.

The FS-score compared to the CS-score. It correlates with r = .58 and is statistically significant with P < .01 and α = .05.
FS and FSCI
The way food is grown, harvested, transported, and sold can be very important for people highly valuing sustainability in each step of the food production process. As the knowledge about social, environmental, and economic effects of food production may also be defined as a domain in FS,43,44 a relationship between highly valued food sustainability and higher FS, as they have been defined by Lavelle et al., 6 might be seen in this study.
To answer this question, the FSCI-Score as a general measure of food-related sustainable concerns is being used, for which the answers on the FSCI questionnaire are rated from 1 (‘Not at all’) to 5 (‘Very important’) and then summed up for each participant individually. As can be seen in Figure 7, an outlier can be detected with an extremely low FS- and FSCI-Score, which may be because this respondent has very little knowledge, experience, or interest in food and sustainability. The FSCI-Score and the FS-Score show a moderate, positive correlation, which is confirmed to be statistically significant (r = .4, P < .01). Here, it is important to mention, that this correlation is only shown by the self-perceived sustainability concerns, and not by the actual efforts inferred by the food behaviour.

The FS-score compared to the FSCI-score. With r = .4, it does correlate and is statistically significant (P < .01 with α = .05).
FS and CT
According to Section 3.1.2, people with higher FS may be cooking more meals by themselves, which enables them to have more influence on the ingredients. It would be interesting to see if people with a better FS consume more self-made meals than bought ones and the other way around for people with a lower FS. To answer this question, the correlation between the FS-Score and the proportion of ‘self-made’ meals by all submitted meals per user is analysed, as well as the correlation between the FS-Score and the proportion of ‘bought’ meals, respectively. The data, as shown in Figure 8, shows a moderate difference (f = 5.4 with f_crit = 3.01) between the CT groups and the FS-Score, with a statistical significance of P < .01. Conducting a pairwise comparison between all groups, only the difference between ‘self-made’ and ‘bought’ with a mean difference of ∆m = −3.25 was significant (P = .01). This means that the data denies the hypothesis that people consuming more self-made food have a higher FS.

The FS-Score compared to the cooking type (CT). With f = 5.4 (f_crit = 3. 01), it does correlate and is statistically significant (P < .01 with α = .05).
FS and NutriScore
Among other topics, FS involves an understanding of the composition of a healthy diet, and, in theory, people should also include this knowledge in their daily lives. To check if people with better FS eat healthy meals more often, the correlation between FS-Score and NutriScore of each food intake is analysed. The score was displayed to the user when selecting a recipe. For a basic evaluation, intakes with a NutriScore of ‘A’, ‘B’ or ‘C’ are considered as ‘healthy’ and a NutriScore of ‘D’ or ‘E’ is classified as ‘unhealthy’. By comparing the average FS-Score of these groups, no significant difference can be measured, f = 1.30, f_crit = 2.62, P = .27. Thus, the data does not support the hypothesis, that people with better FS consume healthier meals more frequently. Comparing those results with the average daily food intake distribution of adults across Europe, where healthy foods and drinks make up around 57% of daily intakes, 45 our study participants seem to have eaten a particularly unhealthy diet. Another explanation can be the over-representation of recipes labelled with a NutriScore of ‘E’ in the recipe database (even though the data is real-world data). This might have affected the choice of submitted recipes for all participants, independent of their FS.
FS and BMI
Because FS affects a person’s diet which has an undisputed influence on their weight, the FS ultimately affects their weight as well. Based on this assumption, people with higher FS should be less likely to be underweight, overweight, or obese, resulting in a BMI between 18.5 and 24.9. In this data, 60% the participants feature a normal BMI, while 40% are considered either underweight, overweight or obese. Comparing the average FS-Scores between these groups, no significant difference can be shown (F53 = 0.234, P = .792). It could be the case, that due to the self-reported height and weight, these calculated BMIs do not reflect reality precise enough, the BMI is not a good indicator for classifying a person as overweight or obese, or that this small study just does not represent the true population exactly enough, due to convenience sampling.
CS and ENV
The behaviour when taking in a meal does not necessarily only depend on the meal itself, but also on external factors. In order to explore this topic further, the relationship between the CS and the Environment the meal was taken in (ENV) is analysed (refer also to Figure 9). The environment groups ‘Restaurant’, ‘Home’, ‘Work’, ‘School/University’, and ‘Other’ indeed show a difference when being compared to the CS (f = 5.09, f_crit = 2.39, P < .01). After a pairwise comparison (as shown in Table 1), the following differences are significant. Participants frequently going to a restaurant have a lower CS than those eating at home (∆m = −7.12, P = .028). Similar holds for those eating in a restaurant versus those at work (∆m = −10.22, P = .027). Also, people who tend to eat at school or university have on average a lower CS than those at home or work (∆m = −9.36, P = .011 and ∆m = −12.46, P < .01 respectively). When interpreting those results, the differences when compared to eating at home make sense when assuming that people eating at home do cook more frequently than others. The other way around, people going to a restaurant or eating in the school or university most likely did not prepare their food by themselves and thus have, at least on average, a lower CS.

The CS-score compared to the environment (ENV). With f = 5.09 (f_crit = 2.39), it does correlate and is statistically significant (P < .01 with α = .05).
CS and SENV
Another interesting external factor is the social environment (SENV) which shows with whom the participants took their meals. The analysis can be found in Figure 10. Possible categories are ‘Alone’, ‘With family’, ‘With friends’, ‘With colleagues’, ‘With another group or other people’, and ‘Other’. The CS varied significantly between those groups (f = 7.54, f_crit = 2.23, P < .01). When performing a pairwise comparison, the following differences are significant. When eating alone versus with family (∆m = −8.66, P < .01), people tend to have a lower CS. One reason could be, that the motivation to cook for only oneself might be smaller than with others. Also, eating with the family might have influences on the environment and typically could be just at home where self-cooking might be more frequent. Another potential explanation could be, that when eating with others cooking-related topics might occur in discussions during the meals which inherently might increase in average the CS. Moreover, a similar difference is shown when eating with friends versus with the family (∆m = −8.20, P < .01).

The CS-score compared to the social environment (SENV). With f = 7.54(f_crit =2.23), it does correlate and is statistically significant (P < .01 with α = .05).
Those results underline the statement 46 that eating in a certain social environment is considered as something healthy.
CS and DIST
Another big influence is distractions (DIST) when eating. In the following, the question of whether people who are frequently distracted by a certain type of distraction have different CS than others will be answered. The results as shown in Figure 11 do have a statistical significance (f = 6.94, f_crit = 2.03, P < .01). The comparison was made between the groups of ‘No/None’, ‘Watching TV or similar media’, ‘Listening to music’, ‘Reading’, ‘Talking’, ‘Working/Studying’, ‘Gaming’, and ‘Other’. To highlight some interesting differences, when comparing the group of no distractions with watching TV, listening to music, reading, or working, it is apparent that participants who avoid distractions have a higher CS (∆m = 6.99, P < .01, and ∆m = 16.58, P < .01, and ∆m = 14.35, P = .042, and ∆m = 18.12, P < .01 respectively). A possible interpretation might be that avoiding distractions more frequently on average allows individuals to concentrate better on cooking tasks, leading to the development of more refined cooking skills through focussed practice and attention to detail. In addition, between the common distraction of watching TV and the categories of working or gaming, the CS seems to be lower for the latter (∆m = 11.13, P = .018, and ∆m = 21.92, P < .01 respectively). On the contrary, between watching TV and talking, the CS is higher for talking (∆m = −14.27, P < .01). A possible reason might be that working or gaming requires more cognitive resources, which detracts from cooking skill development, whereas talking, being a more social and less mentally demanding activity, allows for better multitasking and less interference with cooking tasks.

The CS-score compared to the distractions (DIST). With f = 6.94 (f_crit = 2.03), it does correlate and is statistically significant (P < .01 with α = .05).
Other Food-Related Score Correlations
In addition to the previously analysed scores (FS, CS, FSCI), it is noticeable that nearly all food-related indices (OCI, SLI, M) show positive correlations with each other. Also refer to Figure 4. Intuitively, this makes sense, as in the end, they all describe different aspects of food-related knowledge.
Survey 2
As already mentioned, in the second study the participants eating behaviour with the specific mood state (POMS) and the general mood (GM) is measured. An analysis is conducted between both mood-centric features and features like meal type, meal size, accompanying drink type, ingredient types, and the amount of protein, carbohydrates, and fats of the reported meals (refer to Table 1).
POMS-Centric Correlations
It can be inferred that for the correlations with POMS, half of the categories (Anger/Furious, Anxiety/Tension, Confusion/Muddled, and Depression/Dejection) are very rarely tagged. As an example refer to Figure 12. One reason could be, that the categories were not explained or understood well enough to/by the participants when the survey was performed. Another explanation could be biases that increase the frequency of more positive mood states like Energetic-Hyper and Friendly-Chill. Thus, all examined correlations are not significant.

POMS compared to the top-15 related ingredient types (MainCategories). With chi2_stat = 104.02 (chi2_crit = 106.39), it does correlate very weakly but is not statistically significant (P = .068 with α = .05). The right side of the figure shows a visualisation of a correspondence analysis of the features on a 2-dimensional plane. Points visualised close to each other do have a higher (positive) correlation than points that are far away (no correlation).
GM-Centric Correlations
Similar applies to the experiments with GM. While in this case the 5-point-scale (negative mood to positive mood) is easy to understand, there are rarely negative responses. Also, our scale used smileys as a representation which again might decrease the expressiveness of the respective collected data, because each individual might interpret those differently. Nevertheless, both, POMS and GM-centric results are shown in Table 1.
Conclusion
In this section, the main findings are discussed on their possible impact on both research and practical applications. After the discussion, the contributions of the study are highlighted and possible areas for future work are suggested.
Discussion
In the previous section the correlations between cooking skills (CS), food skills (FS), sustainability, meal preparation, and psychology were investigated. Below is a breakdown and each a short discussion of key findings.
FS and Age
We expected FS to increase with age, but no strong link was found (r = .02, P = .85). Most participants were between 20 and 35 years, limiting variation. FS may also plateau at a certain level. Additionally, younger individuals may have had early exposure to food-related content via social media, reducing generational differences. 47 Other factors, such as education or prior cooking experience, could play a more significant role in FS variation, potentially explaining differences better than age alone.
FS and CS
A strong link was found between FS and CS (r = .58, P < .01). This means people with better food skills are also better at cooking. Meal preparation likely strengthens both skills. It is possible that both skills develop in parallel due to frequent practice, or that people with an interest in 1 area naturally engage more with the other. The correlation is also supported by related work 6 which found the same strong positive correlation.
FS and FSCI
People with higher FS cared more about food sustainability (r = .4, P < .01). This suggests that food knowledge increases awareness of ethical and environmental factors. One outlier had low scores in both FS and sustainability. This could indicate that sustainability awareness requires active interest beyond food skills, or that external influences, such as education or cultural background, might play a role. For example, formal education on environmental issues could enhance awareness of sustainable food choices, while cultural background may shape attitudes towards food waste, local sourcing, or plant-based diets.
FS and CT
Higher FS did not mean more home-cooked meals. While a difference was found between self-made and store-bought meals (f = 5.4, P < .01), external factors like time and convenience may matter more. This suggests that practical constraints, such as work schedules or social norms, might override the intention to cook at home, even for those with adequate skills. For example, long working hours may leave little time for meal preparation, leading individuals to rely on ready-made options. Similarly, social norms, such as eating out with colleagues or family preferences for convenience foods, could discourage home cooking despite having the necessary skills.
FS and NutriScore
FS was not linked to healthier eating (f = 1.30, P = .27). Even if people understand nutrition, they may not always choose healthy meals. Recipe availability and taste preferences could also play a role. Additionally, external factors like marketing, affordability, and cultural preferences may influence food choices beyond personal knowledge. 9 For example, the marketing of unhealthy, processed foods can make them more appealing, despite nutritional knowledge. Affordability may limit access to fresh, healthy ingredients, especially in lower-income areas. Cultural preferences or family habits might also prioritise traditional, less healthy foods over more nutritious options. In contrast to our results (which are not statistically significant), other studies see a correlation between FS and nutrition11-14 and between CS and nutritional intake.7,8 One reasonable explanation is this study’s size and thus lacking significance.
FS and BMI
No link was found between FS and BMI (F(2,53) = 0.234, P = .792). Self-reported height and weight may not be accurate. Also, BMI is not a perfect measure of dietary health. Other metrics, such as body composition or metabolic markers, may provide a better assessment of the relationship between FS and health outcomes. Additionally, metabolic markers like blood sugar levels or cholesterol could offer more precise insights into how food skills influence long-term health.
CS and ENV
People who ate at home had higher CS than those who dined out (f = 5.09, P < .01). Home cooking requires more involvement. This could mean that frequent home cooking leads to skill improvement, or that people with higher CS are more confident in preparing meals and prefer home-cooked food. Additionally, other variables, such as the socioeconomic status, could influence these factors. For instance, people with lower socioeconomic status may face barriers like limited access to ingredients or cooking equipment.
CS and SENV
People who ate alone had lower CS than those who ate with family (f = 7.54, P < .01). Cooking for others may increase motivation. Social interactions may also provide learning opportunities, with shared cooking experiences improving confidence and technique over time.
CS and DIST
People who avoided distractions had higher CS (f = 6.94, P < .01). This suggests that focussing on meals helps develop cooking skills. Distractions might reduce engagement with the cooking process, leading to less deliberate practice and lower skill development. Additionally, other psychological or demographic variables, such as attention span, stress levels, or even household dynamics, could play a role. For example, individuals with higher stress levels may find it harder to focus on cooking, while those in larger households with more social interactions might experience more distractions, which could interfere with skill development.
CS and Other Food-Related Score Correlations
Many food-related scores (OCI, SLI, M) were positive correlated with CS. This suggests that knowledge, habits, and motivations are also connected. How these scores influence each other or are just a logical subset of food related knowledge remains unclear.
Mood and Food Intake
No strong link was found between mood (POMS or GM) and food intake like in, 31 in contrast to other related work.28-30,32,33 People may not report moods accurately. Few negative responses limited analysis. It is also possible that mood effects on eating behaviour are more pronounced in extreme cases, such as clinical stress or depression, which were not well represented in the sample. Additionally, social desirability bias may have led participants to underreport negative emotions, as they might prefer to present themselves in a more positive light. Positivity bias could also have influenced responses, making participants more likely to recall and share positive emotions rather than negative ones. Future studies could address these limitations by incorporating physiological measures, such as cortisol levels or heart rate variability, to assess mood more objectively. These measures might provide a clearer understanding of how mood directly influences food intake, reducing reliance on self-reported data.
The combined findings from these surveys offer insights that could influence the design of food-related applications or recommender systems aimed at promoting healthier and more sustainable eating habits. From Survey 1, the strong correlation between CS and FS emphasises the importance of educational initiatives that target both skills, as they have the potential to improve not only individual dietary behaviour (not shown by this work) but also contribute to sustainability efforts. Applications designed to support users in improving their cooking and food skills may lead to more informed food choices and better management of food resources.
Survey 2 provides a preliminary exploration of how mood and psychological factors influence food intake. While this study did not find strong statistical significance in mood correlations, developing personalised food recommendations based on users’ emotional states could be viable but needs to be investigated further. By integrating mood tracking with food consumption patterns, future recommender systems could potentially offer more tailored suggestions, promoting not only physical health but also emotional well-being.
Both findings suggest that by integrating educational components focussed on improving food and cooking skills and leveraging psychological insights, future tools and applications can play a more holistic role in supporting healthier, more sustainable, and emotionally balanced eating habits.
Limitations
This study has several limitations that should be considered when interpreting the findings. First, the combined sample size of 126 participants is relatively small, which limits the generalisability of the results. A larger and more diverse sample could provide stronger statistical power and more representative insights into the relationships between cooking skills, food skills, and other factors. The small sample size may lead to underrepresentation of certain subgroups, which could affect the validity of the findings across different demographics, such as age, or cultural backgrounds.
Second, the reliance on self-reported data introduces potential biases, such as recall errors and social desirability bias. Participants may have overestimated or underestimated their cooking skills, food choices, and mood states, affecting the accuracy of the findings. Objective measurements, such as direct observation or digital tracking, could improve data reliability in future studies.
Third, while the study explored correlations between CS, FS, and external factors, it did not establish causality. The relationships observed may be influenced by other unmeasured variables, such as cultural background, prior education, or access to cooking resources. More controlled studies (ie, not utilising convenience sampling) could help clarify causal links.
Forth, the by this study used convenience sampling and participant recruitment disables any generalisability. For future works, these issues should be improved on in future works.
Additionally, the study’s preliminary exploration of mood and psychological factors found no strong statistical significance. This could be due to limitations in how mood was assessed or the complexity of psychological influences on eating behaviour. More refined methods, such as continuous mood tracking or integrating physiological data, may yield clearer insights.
Lastly, the implementation of the food tracking, while useful, has limitations in data accuracy and depth as recipes might not fit the users’ real intakes and the creation of new recipes might have been too time consuming.
Summary
This study explored the relationships between cooking skills (CS), food skills (FS), and various factors such as nutrition, socio-demographics, psychological behaviour, and interest in sustainable living. Two surveys were conducted with 126 participants, utilising tools to track food consumption and mood changes. The findings highlight a strong correlation between CS and FS, emphasising their role in shaping eating habits and external meal-related factors, such as the social environment (SENV) and the broader environmental context (ENV). However, the connection between self-reported behaviour and actual nutritional intake was less conclusive.
The insights from these surveys offer valuable considerations for designing food-related applications and recommender systems aimed at promoting healthier and more sustainable eating habits. The strong link between CS and FS suggests that educational initiatives targeting both could improve dietary behaviour and resource management. Applications that help users develop these skills may encourage informed food choices and more efficient food use.
Additionally, the study explored how mood and psychological factors influence food intake. While no strong statistical significance was found in mood correlations, integrating mood tracking with food consumption data could enhance recommender systems. With this study we realised that the POMS scale is too complicated for most participants, and that most prefer a simpler scale like the GM scale.
Overall, the study underscores the importance of combining educational components with psychological insights to create holistic tools that support healthier, more sustainable, and emotionally balanced eating habits. Despite its preliminary nature, the research highlights the need for further investigation, particularly in leveraging mobile applications to enhance data quality in dietary studies compared to traditional surveys.
Future Work
Future research should aim to expand the sample size and diversity of participants to enhance the generalisability of the findings. Longitudinal studies could provide deeper insights into how CS and FS evolve over time and their long-term effects on dietary behaviour and health outcomes. Additionally, exploring the impact of educational interventions designed to improve CS and FS would be valuable. Integrating more robust and objective measures of nutrition behaviour, rather than relying solely on self-reported data, could also strengthen the conclusions drawn from future studies. Thus, especially relations with external factors like ENV, SENV and DIST might be valuable. Also, it would be interesting if the POMS and the GM scale are positively related as expected. Lastly, the development and validation of standardised tools for measuring CS and FS would greatly benefit the field, facilitating more accurate comparisons across different studies. We emphasise the need of more connected food data (like the by this study used HUMMUS graph) to find new correlations between different food types for future work. Integrating data from food logs, nutrition, and environmental factors could reveal patterns that help personalise interventions and improve outcomes.
Supplemental Material
sj-docx-1-nmi-10.1177_11786388251364306 – Supplemental material for Do I Eat Healthy, Consciously, and Sustainably? A Preliminary Study on Food-Centric Relationships
Supplemental material, sj-docx-1-nmi-10.1177_11786388251364306 for Do I Eat Healthy, Consciously, and Sustainably? A Preliminary Study on Food-Centric Relationships by Felix Bölz, Farah Khalid Andraws Asmaro, Ines Garali, Alizée Bertrand, Diana Nurbakova and Audrey Serna in Nutrition and Metabolic Insights
Footnotes
Acknowledgements
We used tools like ChatGPT, DeepL, and Grammarly to enhance the language quality of our publication.
Author Note
All co-authors have seen and agree with the contents of the manuscript and there is no financial interest to report. We certify that the submission is original work and is not under review at any other publication.
Ethical Considerations
Under the University of Passau Research Ethics Committee guidelines (§2), our anonymous, minimal-risk survey did not meet the criteria requiring ethics review; therefore, no formal approval was sought.
Consent to Participate
All participants provided written informed consent prior to enrolment in the study and the use of the designed applications. In particular, they have accepted a GDPR statement and have agreed that their data might be used for scientific purposes.
Author Contributions
All the below listed authors agree that they can claim authorship to the submitted paper: FB: Conceptualisation, Methodology, Formal Analysis, Investigation, Writing – Original Draft Preparation, Software, Data Curation. FK and AA: Investigation, Writing – Original Draft Preparation, Software. IG: Ivestigation, Writing – Original Draft Preparation. AB: Conceptualisation, Writing – Review & Editing, Project Administration. DN: Conceptualisation, Methodology, Writing – Review & Editing, Supervision. AS: Conceptualisation, Writing – Review & Editing.
Funding
The authors disclosed receipt of the following financial support for the research, authorship, and/or publication of this article: We acknowledge support by the Open Access Publication Fund of University Library Passau.
Declaration of conflicting interests
The authors declared no potential conflicts of interest with respect to the research, authorship, and/or publication of this article.
References
Supplementary Material
Please find the following supplemental material available below.
For Open Access articles published under a Creative Commons License, all supplemental material carries the same license as the article it is associated with.
For non-Open Access articles published, all supplemental material carries a non-exclusive license, and permission requests for re-use of supplemental material or any part of supplemental material shall be sent directly to the copyright owner as specified in the copyright notice associated with the article.