
Abstract
Background:
Obesity, as one of the main causes of metabolic diseases, is a global public health concern owing to its prevalence. While some consumed beverages have shown favorable effects on obesity and components of metabolic syndrome (MetS), others have not. Additionally, most studies have investigated the effect of specific beverage consumption on obesity and MetS components, rather than overall beverage consumption patterns. Therefore, this cross-sectional study aims to investigate the association between beverage consumption patterns and cardiometabolic risk factors in individuals with obesity.
Method:
This cross-sectional study was conducted on 150 obese and overweight participants (44.0% males and 56.0% females) aged 18 to 65. Participants’ general characteristics, anthropometric, dietary, and biochemical assessments were obtained. The principal component analysis (PCA) was used to determine beverage consumption patterns, with varimax rotation. Three beverage consumption patterns were obtained based on eigenvalues >0.3, scree plot, and interpretability of factors. Multivariate multinomial logistic regression was conducted to estimate the odds ratio (OR) and 95% confidence interval of the association between beverage consumption patterns and cardio-metabolic risk factors for each beverage pattern after controlling for covariates.
Results:
Three major beverage consumption patterns were identified using principal component analysis: the “fruit juice” pattern (high loadings of apple juice, fruit juice, sugar-sweetened beverages [SSBs], soft drinks, cantaloupe juice, and orange juice); the “milk and milk product” pattern (high loadings for milk alternatives, chocolate milk, unsweetened coffee, packaged fruit juice, milk, low-fat milk, dough, and khakshir); and the “tea and water” pattern (high consumption of sweetened tea, unsweetened tea, and water). The ORs (95% CIs) of associations of the “fruit juice” pattern with risks of elevated FBG were 1.031 (1.002-1.061), 1.033 (1.002-1.065), and 1.034 (1.002-1.066), respectively for model I, II, and III. Participants with higher intake of “fruit juice” pattern were more likely to have lower LDL-C level, in all three models (0.986 [0.973-0.999], 0.987 [0.973-0.999], and 0.983 [0.96-0.997], respectively). Also, there was a positive association between “fruit juice” pattern and triglyceride (TG) level (1.007 [1.001-1.015]), only in the crude model. There was no significant association between the tertiles of the “milk and milk product” pattern and the odds of cardiometabolic risk factors. Upon adjusting for potential confounders, we found that individuals in the second tertile of the “tea and water” pattern showed lower HDL-C compare to the first tertile (0.950 [0.903-0.999]). The study analyzed the association between beverage consumption pattern and anthropometric factors. Participants in the second tertile of “fruit juice” pattern had lower body mass index (BMI; 0.878 [0.792-0.972], 0.895 [0.805-0.995], and 0.891 [0.800-0.992], respectively) and hip circumference (HC; 0.938 [0.893-0.984], 0.947 [0.901-0.996], and 0.947 [0.901-0.996], respectively).
Conclusion:
In this study, the “fruit juice” pattern was associated with lower serum LDL-C levels, but higher FBS and TG levels. Understanding the effect of beverage consumption patterns on cardiometabolic health in obesity is important for developing risk management strategies, but further research is needed for more conclusive results.
Background
Obesity, being a significant public health issue, is associated with numerous comorbidities that reduce quality of life and increase mortality.1,2 According to the World Health Organization (WHO), in 2016, the number of obese adults (body mass index ⩾30) exceeded 650 million, and the number of overweight adults (body mass index ⩾25) exceeded 1.9 billion. 3 In Iran, it is estimated that approximately 25% of adults were obese in 2019. 4 Individuals with obesity are at a higher risk of hypertension, dyslipidemia, and hyperglycemia and the development of metabolic disease such as metabolic syndrome (MetS), 5 cardiovascular disease (CVD), 6 type 2 diabetes (T2DM), 7 and many types of cancers.8,9 Paraoxonase, an esterase, may be involved in the antiatherogenic properties of high-density lipoprotein cholesterol (HDL-C) by reducing the peroxidation of low-density lipoprotein cholesterol (LDL-C). 10 One potential factor influencing obesity and metabolic health is beverage consumption.
Previous studies have investigated the association between specific types of beverages and the risk of cardio-metabolic disorders. A cross-sectional study conducted in Korea reported an inverse association between the high consumption of dairy products, which are considered important components of a healthy diet, and the risk of MetS and obesity. 11 According to a report by Dhingra et al, 12 daily consumption of soft drinks in the Framingham Heart Study is associated with higher prevalence of metabolic risk factors such as obesity, increased waist circumference (WC), hypertriglyceridemia, decreased HDL-C, impaired fasting blood sugar (FBS), and elevated blood pressure. Numerous studies conducted in the United States, Europe, and Asia have shown that coffee consumption is associated with a reduced risk of T2DM.13,14 However, a randomized trial involving 12 healthy volunteers indicated that coffee consumption may reduce insulin sensitivity. 15 Tea and tea polyphenols are considered protective factors against obesity, components of MetS, T2DM, and CVD.16,17 Individuals who consumed 100% fruit juice were found to be less likely to be obese and have MetS, and exhibited greater insulin sensitivity. 18 On the other hand, sugar-sweetened beverages (SSBs) consumption was associated with a higher risk of MetS and T2DM. 19
While previous studies have examined the association between individual beverages and cardio-metabolic disorders, there is a knowledge gap regarding the overall patterns of beverage consumption and their independent effects on these health outcomes. Furthermore, few comprehensive studies have considered the impact of beverage consumption patterns while controlling for other dietary factors. In this study, we aim to investigate the major beverage consumption patterns among obese adults and evaluating the association between higher intake of specific beverage consumption patterns and cardio-metabolic risk factors.
Methods and Materials
Participants
In this cross-sectional study, we included 150 overweight and obese individuals living in Tabriz, through a public announcement between March 2022 and July 2022. Participants aged 18 to 64 years old with body mass index (BMI) of 25 kg/m2 or higher were enrolled. The sample size will be calculated using the formula n = (z2 × pq)/d2. The P value was obtained from the triglyceride variable based on the research conducted by Hedrick et al 20 with Z = 1.96, P = .41, q = 0.59, d = 0.044, and an initial sample size of 135, the final sample size will be adjusted to 150 individuals, considering a 10% drop. Also, the cluster sampling method will be employee. Exclusion criteria consisted of pregnancy, lactation, use of medications such as lipid and blood sugar reducers, omega-3 supplements, and thyroid hormones, very little (800-1000 kcal per day) or too much (above 3000 kcal per day) energy intake and history of surgery in the last 3 to 6 months. Informed written consent was obtained from all participants in accordance with ethical considerations and the study proposal was approved by the ethics committee of Tabriz University of Medical Sciences, Tabriz, Iran (code: IR.TBZMED.REC.1402.214).
General Characteristics and Anthropometric Assessments
Socio-demographic information including sex, age, level of education, marital status, occupation, and medical records were obtained through a questionnaire. Body composition was measured using bioelectrical impedance analysis (Tanita, BC-418 MA, Tokyo, Japan). Using a Seca scale (Seca co., Hamburg, Germany), body weight was measured with a sensitivity of 0.1 kg. Height was assessed using a wall-mounted stadiometer to the nearest 0.5 cm. BMI was calculated as weight divided by the square of height (kg/m2). WC and hip circumference (HC) were measured using a constant tension tape at the midpoint between the lower costal margin and the iliac crest, and the widest part of the buttocks, respectively. Then, waist-to-hip ratio (WHR) were calculated. Physical activity was assessed using a concise version of the International Physical Activity Questionnaire (IPAQ), whose validity and reliability have been previously measured. 21 The same arm’s blood pressure was assessed twice with a mercury sphygmomanometer after at least 15 minutes of rest, and the average result was used for analysis.
Dietary Assessments
Dietary information was collected using an Iranian-adapted validated semi-quantitative Food Frequency Questionnaire (FFQ) with 168 items. 22 An expert nutritionist asked participants to report frequency and amount of each food item consumed on a daily, weekly, monthly or yearly basis during the prior year. Then, using household measures, the reported frequency of consumed foods and portion sizes for each food item were measured in gram. 23 Ultimately, the Nutritionist IV software (N Squared Computing, California, USA) was used to analyze daily food intake.
Biochemical Assessment
A 10 ml morning venous blood sample was collected from each participant after fasting for 12 hours. The samples were then centrifuged for 10 minutes at 3000 rpm, 4°C to separate the serum and plasma and were stored at −80°C until assay. Commercial kits were used to evaluate FBS, HDL-C, triglyceride (TG), and total cholesterol (TC; Pars Azmoon, Tehran, Iran). Serum LDL-C was assessed using the Friedewald equation. 24 Enzyme-linked immunosorbent assay (ELISA) kits were used to calculate serum insulin concentrations (Bioassay Technology Laboratory, Shanghai Korean Biotech, Shanghai City, China). Paraoxonase enzyme was evaluated by spectrophotometric device. The metabolic parameters (LDL-C, HDL-C, TG, TC, FBS, SBP, and DBP) were also categorized as categorical variables based on the National Cholesterol Education Program (NCEP) Adult Treatment Panel-III (ATP-III) criteria.25,26
Statistical Analyses
The data were analyzed using SPSS version 27 (Statistical Package for Social Analysis, version 27, SPSS Inc., Chicago, IL, USA), at a statistical significance level of <0.05. Beverage consumption patterns were determined using principal component analysis (PCA). Varimax rotation was applied to enhance the interpretability of the factors. Given eigenvalues >0.3, the scree plot, and the interpretability of the factors, three patterns for beverage consumption were identified. Beverages with absolute component loading ⩾0.30 were considered to describe each pattern, as detailed in Table 1. The Kaiser-Mayer-Olkin statistic, which assess the adequacy of sampling, was 0.914, indicating good proportionality of factor analysis. To assess the appropriateness of the correlation matrix for factor analysis, Bartlett’s test of sphericity was used; P value for Bartlett’s test of sphericity was <.001. Each beverage consumption pattern was divided into three categories and based on tertiles of beverage consumption patterns, all participants were classified. To describe categorical and continuous variables, frequency (%) and mean ± standard deviation (SD) were used, respectively. Chi-square test and one-way analysis of variance (ANOVA) were used to compare the differences in categorical and continuous variables among different tertiles of beverage consumption patterns. The relationship between beverage consumption patterns and energy and nutrient intake was assessed using Pearson’s correlation coefficient (r). The associated P-value was calculated to determine the statistical significance of the observed correlation. The odds ratio (OR) and 95% confidence interval for cardiometabolic risk factors across tertiles of beverage consumption patterns were obtained by the multivariate multinomial logistic regression with adjusted models in the three different models (Model I: crude, Model II: adjusted for age and sex, Model III: adjusted for age, sex, BMI, physical activity, energy intake, and level of education.
Component loadings for beverage consumption patterns.

Factor loadings of food patterns measured by factor analysis. Absolute value >0.3.
Abbreviation: SSB, sugar sweetened beverages.
Results
Through principal component analysis, three main beverage consumption patterns were identified. Factor loadings and variances for each beverage consumption pattern in an adult Tabriz population presented in Table 1. Together, these three beverage consumption patterns explained 47.75% of the total variance. The first pattern, labeled “fruit juice,” was characterized by higher loadings of apple juice, fruit juice, SSBs, soft drinks, cantaloupe juice, and orange juice. The second pattern, defined as “milk and milk product,” showed higher loadings for milk alternatives, chocolate milk, unsweetened coffee, packaged fruit juice, milk, low-fat milk, dough, and khakshir. The third pattern, called “tea and water,” was characterized by higher consumption of sweetened tea, unsweetened tea, and water. The related scree plot showing the eigenvalues is presented in Supplemental Figure 1.
Demographic, anthropometric and biochemical characteristics of participants according to the tertiles of beverage consumption patterns are illustrated in Table 2. Subjects in the last tertile of “fruit juice” have a significantly lower body mass index compared to the first tertile (P: .02). Energy intake was significantly higher in participants of upper tertiles for both “milk and milk product” and “tea and water” patterns (P: .04 and P: .01, respectively). No significant difference was observed between tertiles of beverage consumption patterns and other demographic, anthropometric and biochemical variables. Table 3 shows dietary macro and micronutrients of individuals across different tertiles of beverage consumption patterns. There was no significant difference between macronutrients intake and tertiles of three beverage consumption patterns, except for proteins. Participants in the third tertile of “milk and milk product” and “tea and water” patterns have remarkably higher intake of protein versus first tertile (P: .012 and P: .015). Participants with higher intake of the “fruit juice” pattern had a greater intake of dietary cholesterol (P: .009). Participants in the higher tertiles of all three beverage consumption patterns were observed to have higher intake of saturated fat (P: .016, P: .006, and P: .014, respectively). There was no significant difference in total dietary fiber intake among the tertiles of beverage consumption patterns.
General demographic, anthropometric, and biochemical characteristics of study participants by Tertiles of beverage consumption pattern among participants.
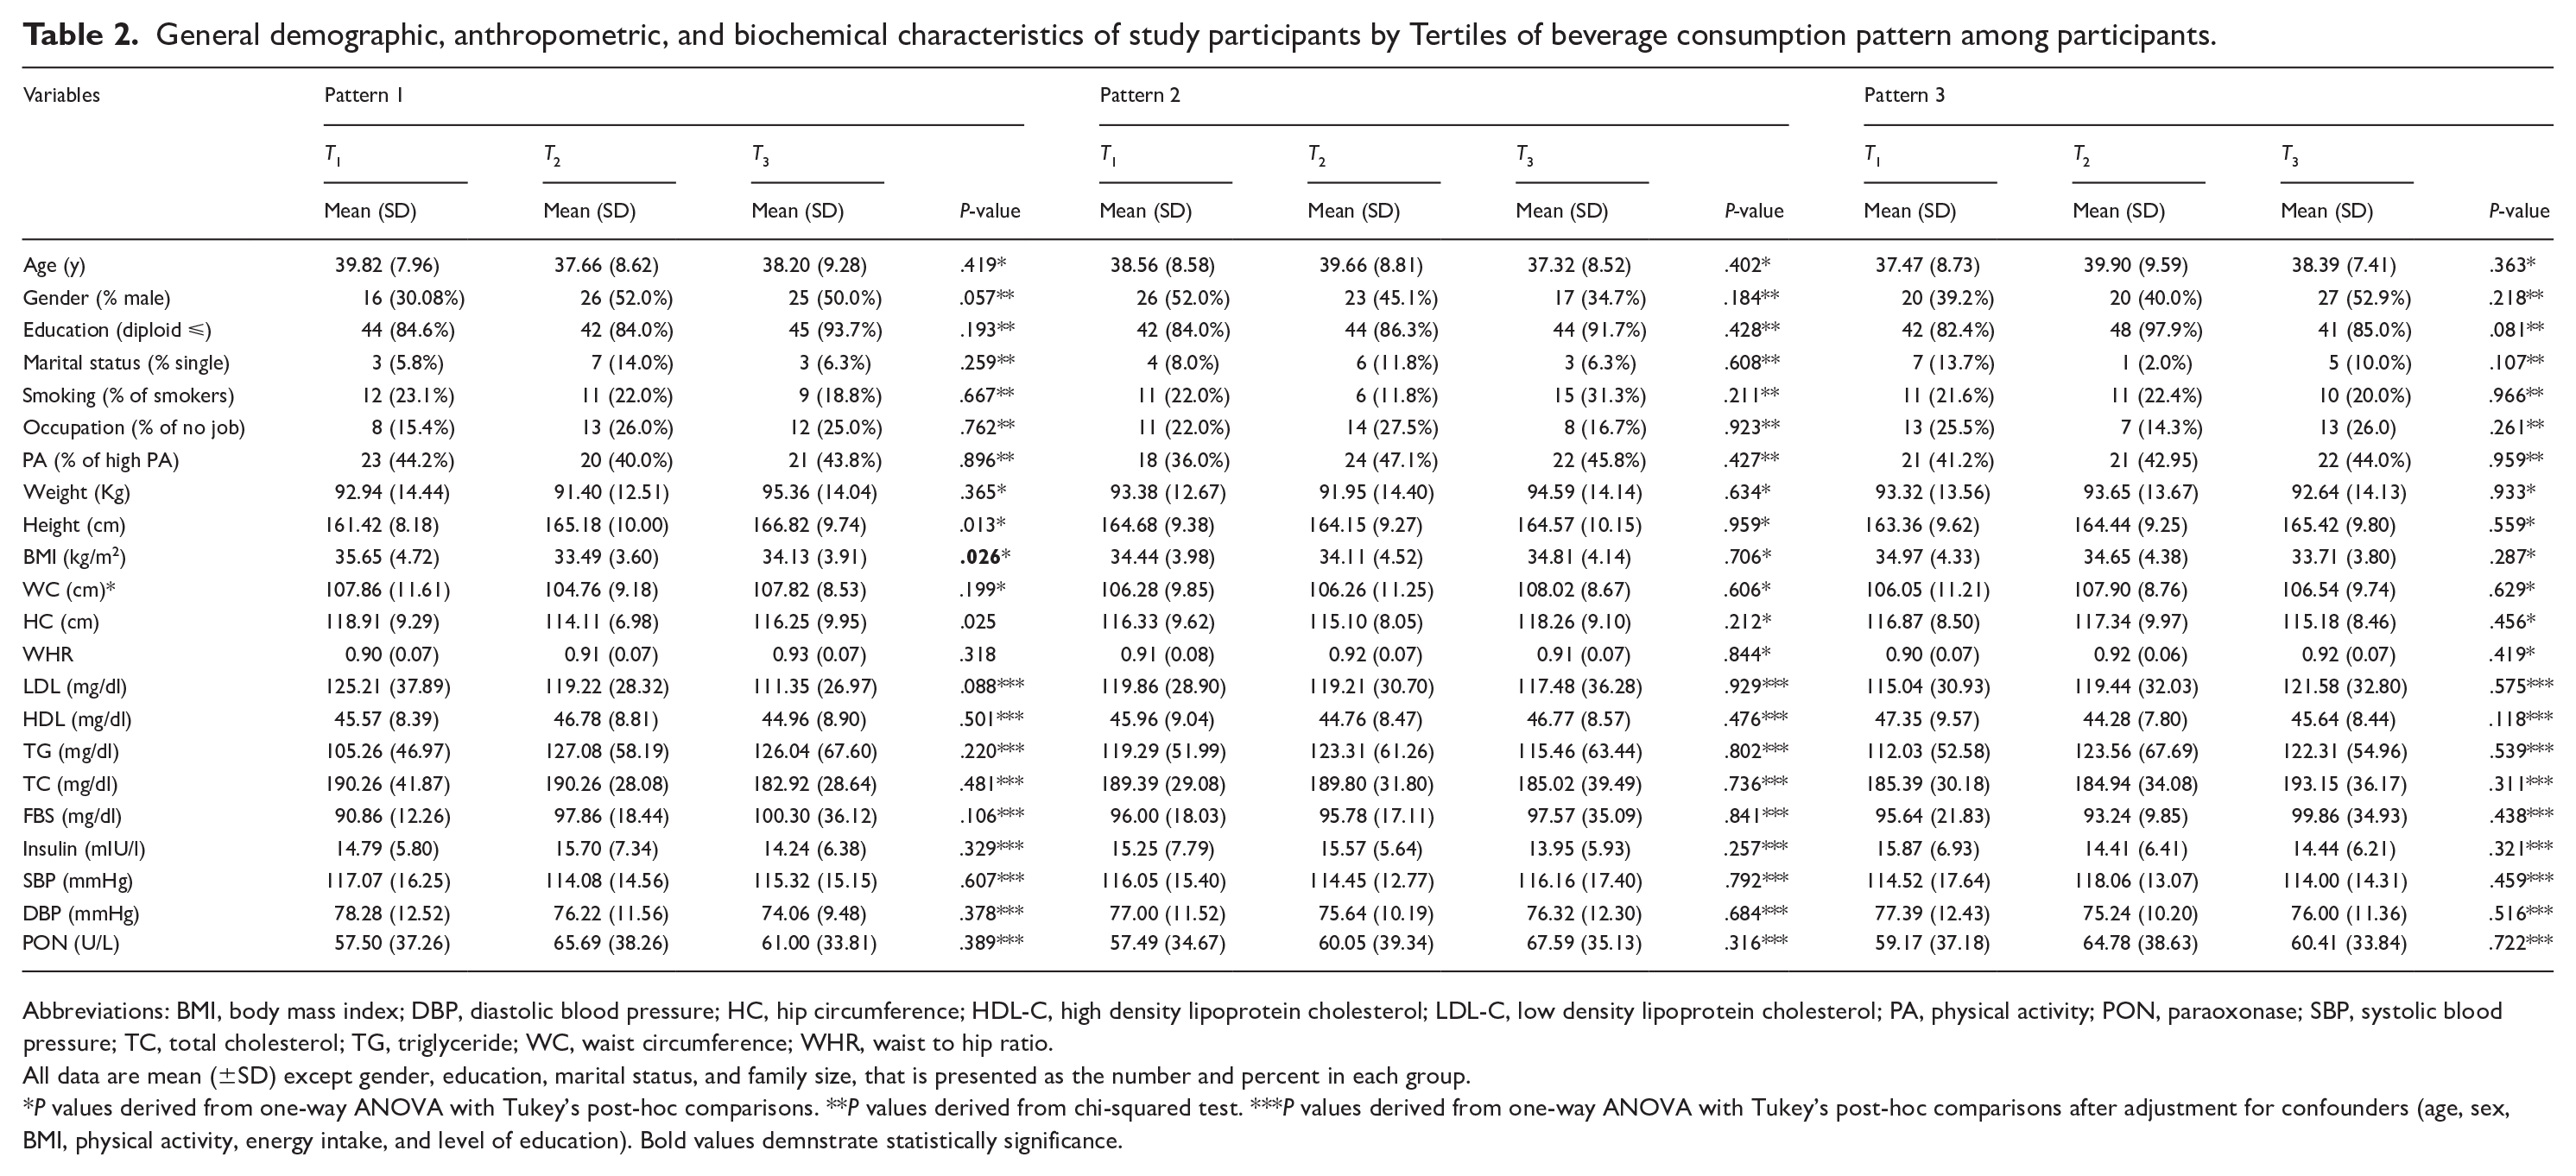
Abbreviations: BMI, body mass index; DBP, diastolic blood pressure; HC, hip circumference; HDL-C, high density lipoprotein cholesterol; LDL-C, low density lipoprotein cholesterol; PA, physical activity; PON, paraoxonase; SBP, systolic blood pressure; TC, total cholesterol; TG, triglyceride; WC, waist circumference; WHR, waist to hip ratio.
All data are mean (±SD) except gender, education, marital status, and family size, that is presented as the number and percent in each group.
P values derived from one-way ANOVA with Tukey’s post-hoc comparisons. **P values derived from chi-squared test. ***P values derived from one-way ANOVA with Tukey’s post-hoc comparisons after adjustment for confounders (age, sex, BMI, physical activity, energy intake, and level of education). Bold values demnstrate statistically significance.
Dietary energy and nutrient intake of participants according to beverage consumption pattern among participants.

Abbreviations: CHO, carbohydrate; SFA, saturated fatty acids.
P values derived from one-way ANOVA with Tukey’s post-hoc comparisons after adjustment for confounders (age, sex, physical activity, and BMI). Bold values demnstrate statistically significance.
Pearson’s correlation analyses to examine the relationships between the three beverage consumption patterns and various dietary intake variables presented in Table 4. A statistically significant positive correlation was observed between all three beverage consumption patterns and energy intake (r = .27, P = .001 for pattern 1; r = .36, P < .001 for pattern 2; r = .25, P < .001 for pattern 3). Similarly, positive correlations were found for protein intake (r = .24, P = .003 for pattern 1; r = .45, P < .001 for pattern 2; r = .18, P = .023 for pattern 3), fat intake (r = .34, P < .001 for pattern 1; r = .32, P < .001 for pattern 2; r = .25, P = .001 for pattern 3), and saturated fat intake (r = .41, P < .001 for pattern 1; r = .34, P < .001 for pattern 2; r = .30, P < .001 for pattern 3). These findings indicate that higher consumption of all three beverage patterns was associated with higher overall energy, protein, fat, and saturated fat intake. Interestingly, cholesterol intake was only significantly and positively correlated with beverage consumption pattern 1 (r = .29, P < .01).
Association between beverage consumption patterns and energy and nutrient intake among participants.

Abbreviations: CHO, carbohydrate; P, two-tailed P-value; r, Pearson’s correlation coefficient; SFA, saturated fatty acids. Bold values demnstrate statistically significance.
Table 5 presents odds ratios (ORs) and 95% confidence intervals (CIs) of the cardiometabolic components across the tertiles of beverage consumption patterns. Subjects in the highest tertiles of “fruit juice” pattern showed lower LDL-C in the model I (OR: 0.986; 95% CI: 0.973-0.999; P: .03), model II (OR: 0.987; 95% CI: 0.973-0.999; P: .04), and model III (OR: 0.983; 95% CI: 0.969-0.997; P: .02) analyses. Moreover, third tertile of “fruit juice” pattern was positively associated with TG level in crude model (OR: 1.007; 95% CI: 1.001-1.015; P: .04), which was no longer significant after adjustment for confounders. Also, participants in higher tertiles of “fruit juice” pattern were more likely to have higher blood glucose in all three models (OR: 1.031; 95% CI: 1.002-1.061; P: .03, OR: 1.033; 95% CI: 1.002-1.065; P: .03 and OR: 1.034; 95% CI: 1.002-1.066; P: .02, respectively). Other cardiometabolic risk factors (HDL, TC, insulin, SBP, DBP, and paraoxonase) did not indicate any significant relationship across the tertiles of “fruit juice” pattern. We observed no significant association between the tertiles of the “milk and milk product” pattern and the odds of cardiometabolic risk factors. Furthermore, our results indicate that after controlling for age, sex, BMI, physical activity, energy intake, and level of education, individuals in the second tertile of the “tea and water” pattern showed lower HDL-C compare to the first tertile (OR: 0.950; 95% CI: 0.903-0.999; P: .04). There was no significant association between other cardiometabolic risk factors (LDL, TG, TC, FBS, insulin, SBP, DBP, and paraoxonase) across the tertiles of “tea and water” pattern.
Association between biochemical variables and beverage consumption pattern among participants.

Abbreviations: CI, confidence interval; DBP, diastolic blood pressure; HDL-C, high density lipoprotein cholesterol; LDL-C, low density lipoprotein cholesterol; OR, odds ratio; PON, paraoxonase; SBP, systolic blood pressure; TC, total cholesterol; TG, triglyceride.
The multivariate multinomial logistic regression was used for estimation of ORs and CI. Model I: crude, Model II: adjusted for age and sex, Model III: adjusted for age, sex, BMI, physical activity, energy intake, and level of education. Bold values demnstrate statistically significance.
Odds ratios (ORs) and 95% confidence intervals (CIs) of the anthropometric factors across the tertiles of beverage consumption patterns are shown in Table 6. Participants in the second tertiles of “fruit juice” pattern are negatively associated with lower BMI (OR: 0.878; 95% CI: 0.792-0.972; P: .01, OR: 0.895; 95% CI: 0.805-0.995; P: .03 and OR: 0.891; 95% CI: 0.800-0.992; P: .03, respectively) and HC (OR: 0.938; 95% CI: 0.893-0.984; P: .009, OR: 0.947; 95% CI: 0.901-0.996; P: .03 and OR: 0.947; 95% CI: 0.901-0.996; P: .03, respectively) in all three models. No other significant association was observed between anthropometric variables and dietary beverage consumption patterns among the study participants.
Association between anthropometric variables and beverage consumption pattern among participants.

Abbreviations: BMI, body mass index; CI, confidence interval; HC, hip circumference; OR, odds ratio; WC, waist circumference; WHR, waist to hip ratio.
The multivariate multinomial logistic regression was used for estimation of ORs and CI. Model I: crude, Model II: adjusted for age and sex, Model III: adjusted for age, sex, physical activity, energy intake, and level of education. Bold values demnstrate statistically significance.
The association between disturbed metabolic parameters as defined by the NCEP ATP-III25,26 criteria and beverage consumption patterns among the participants is shown in Table 7. The results indicate a significantly inverse association between LDL-C levels and the tertiles of beverage pattern 1. Conversely, a positive association was observed between TG levels and the tertiles of beverage pattern 1. These findings are in line with the results presented in Table 5. No other significant associations were observed between the other metabolic parameters and the beverage consumption patterns.
Association between disturbed metabolic parameters by NCEP ATP-III criteria with beverage consumption pattern among participants.

Abbreviations: DBP, diastolic blood pressure; HDL-C, high density lipoprotein cholesterol; LDL-C, low density lipoprotein cholesterol; NCEP ATP-III, national cholesterol education program adult treatment panel-III; SBP, systolic blood pressure; TC, total cholesterol; TG, triglyceride.
All data are number (percent). P values derived from chi-squared test. Bold values demnstrate statistically significance.
Discussion
This cross-sectional study revealed that participants in the last tertile of the “fruit juice” pattern had lower BMI. Individuals in the third tertiles of “milk and milk product” and “tea and water” patterns had higher energy intake than those in the first tertiles. Unlike the “tea and water” pattern, the “milk and milk products” pattern had significantly higher protein intake. Participants in the “fruit juice” patterns consumed higher amount of dietary cholesterol. Higher saturated fat consumption was observed in all three beverage consumption patterns.
Factor 1—fruit juice—which had a major contribution of apple juice, fruit juice, SSBs, soft drinks, cantaloupe juice, and orange juice, was positively associated with FBS in all three model (crude, and adjusted) and TG in just the crude model. Conversely, it was associated with lower LDL-C level in crude and adjusted models. Whole fruits contain dietary fibers, which have high satiating power, 27 increase the excretion of lipids by binding to bile acids, 28 and can slow down the absorption of sugars into the bloodstream. 29 Dietary fibers are almost completely removed from fruit juice during filtration, leading to increased calorie intake and lipid absorption, as well as a faster release of sugars, potentially causing a sharper rise in blood glucose levels. 30 An experimental study evaluating the effect of drinking pressed apple juice on lipid profile and oxidative stress showed a decrease in LDL-C, TG, and TC levels and an increase in serum antioxidant enzymes, 31 which is consistent with our results for LDL-C. A study by Ravn-Haren et al 30 showed a significant adverse effect on blood lipids following consumption of clear apple juice. In accordance with our findings, fruit juices such as apple juice and pear juice, which are high in fructose, may contribute to increased TG levels. 32 A randomized crossover study revealed a slight elevation in plasma TG levels after 6 weeks intervention with apple juice compared to whole apple, but did not reach a statistical significant. 33 There is a growing body of evidence suggesting a positive association between increased consumption of sugar-sweetened beverages and the risks of obesity and MetS components. 34 A cohort study by Dhingra et al showed that daily soft drink (diet or regular) consumption was associated with a 39% higher risk of MetS and a 22% greater risk of developing hypertriglyceridemia and low HDL-C over 4 years. 12 Consistent with our findings, among MESA participants, those who consumed ⩾1 serving of diet soda daily were more likely to have higher fasting glucose. 35 These sweetened beverages lead to a rapid increase in blood glucose and insulin, mainly due to the presence of sucrose or high-fructose corn syrup and their high dietary glycemic load. 36 Additionally, the high added sugar contents of sugar-sweetened beverages can lead to insulin resistance, 37 increased triglyceride levels 38 and decreased HDL-C. 39 A study including three prospective longitudinal cohort studies reported a reduction in the risk of type 2 diabetes by replacing fruit juice with fresh oranges. 40 The reduction in dietary fiber content through the juicing process, on one hand, and the relatively higher glycemic load values of fruit juices, on the other hand, may explain the increasing effect of fruit juice on type 2 diabetes.41,42 Our findings are also in line with previous studies showing that daily consumption of orange juice was associated with reduced LDL-C levels. 43
No significant association was observed between factor 2—milk and milk product—which consisted of milk alternatives, chocolate milk, unsweetened coffee, packaged fruit juice, milk, low-fat milk, “dough,” and “khakshir,” with cardiometabolic risks. Sjogren et al 44 reported lower TG levels and higher HDL-C in association with milk consumption in their study evaluated by fatty acid biomarkers. Skim milk consumption was also associated with decreased TC levels, while no significant relationship was observed between whole milk and TC levels. 45 A meta-analysis of 13 observational studies indicated a negative association between coffee consumption and risk of MetS. 46 The presence of different drinks in this pattern may have overlapping effects, so there was no significant relationship with cardiometabolic risks.
Factor 3, called “water and tea,” which includes sweet tea, unsweetened tea and water, was associated with lower HDL-c levels in model II, but this effect was not significant after adjustment for potential confounders. In addition to alkaloid contents such as caffeine, theobromine and theophylline, black tea contains polyphenols like theaflavins, thearubigins, and catechins, 47 which have been shown to have favorable effects on lipid profiles. Vinson and Dabbagh 48 reported an improvement in plasma lipid profile and reduction in lipid peroxidation by drinking tea, which our results are not in agreement with that. Similarly, another study indicated beneficial effects of green tea consumption against CVD risk through improved blood lipid levels. 49 Considering that our results regarding the relationship between tea consumption and HDL-C levels are contradictory to other studies, it may be due to the limitation in sample size. Further studies are needed to clarify this relationship. It is worth noting that this study may have found an association between beverage pattern and some cardiometabolic outcomes, but it did not demonstrate a causal relationship. This is because beverage consumption is indeed part of a broader lifestyle and cannot be considered in isolation.
To the best of our knowledge, this cross-sectional study is the first study examining the relationship between beverage consumption patterns and cardiometabolic risk among obese adults. Due to the performing of all recruitment and data collection phases by a trained nutritionist, the accuracy of the assessment increased. Additionally, numerous potential confounders were considered in the analysis in order to achieve an independent relationship between beverage patterns and cardiometabolic factors. The factor analysis used in this study better describes the pattern of beverage consumption and their cumulative effects on cardiometabolic risk in our population. There are several potential limitations to our study. The number of participants in our study was small. Additionally, the cross-sectional design of the study, which not include a non-obese control group, makes causal inference difficult and more longitudinal studies are needed. Despite our efforts to control the confounders, there may still be some residual confounders that we could not eliminate. Finally, the FFQ we used, was not only not specifically developed to assess beverage consumption, but also carries the risk of reporting and recall bias.
Conclusion
The current study found that participants in the highest tertile of the “fruit juice” pattern exhibited lower LDL-cholesterol but higher blood glucose levels. The “tea and water” pattern was associated with lower HDL-cholesterol in the second tertile. It is important to note that beverage consumption is part of a broader lifestyle. However, the cross-sectional design limits the ability to infer causation, and the lack of a non-obese control group makes it difficult to draw firm conclusions. Further research is warranted to better elucidate this association.
Supplemental Material
sj-jpeg-1-nmi-10.1177_11786388251346309 – Supplemental material for The Association Between Beverages Consumption Patterns, Metabolic Risk Factors, and Anthropometric Features Among Overweight and Obese Adults: A Cross-Sectional Study
Supplemental material, sj-jpeg-1-nmi-10.1177_11786388251346309 for The Association Between Beverages Consumption Patterns, Metabolic Risk Factors, and Anthropometric Features Among Overweight and Obese Adults: A Cross-Sectional Study by Fatemeh Abdi and Mahdieh Abbasalizad Farhangi in Nutrition and Metabolic Insights
Footnotes
Acknowledgements
The authors wish to thank all the study participants for their sincere collaboration. We also thank the Research Undersecretary of Tabriz University of Medical Sciences for their financial support (grant number: 71549).
Ethics Approval and Consent to Participate
All subjects provided written informed consent before participating in the study. We confirm that the methods followed the Declaration of Helsinki’s guidelines and regulations. Also, the legal guardians of the illiterate participants provided written informed consent. The study protocol was approved and registered by the ethics committee of Tabriz University of Medical Sciences (registration code: IR.TBZMED.REC.1402.214).
Authors’ Contributions
All authors approved the final version of the article. FA and MAF contributed to study design, supervision, statistical analysis, and manuscript writing. FA was involved in manuscript writing. FA were involved in data collection. MA and FA performed the statistical analysis
Funding
The author(s) disclosed receipt of the following financial support for the research, authorship, and/or publication of this article: The present study was financially supported by a grant from Tabriz University of Medical Sciences (Code: IR.TBZMED.REC.1402.214 and grant number: 71549). The funders had no role in hypothesis generation, recruiting, or designing the study.
Declaration of Conflicting Interests
The author(s) declared no potential conflicts of interest with respect to the research, authorship, and/or publication of this article.
Data Availability Statement
The datasets generated and/or analyzed during the current study are not publicly available due to privacy and ethical considerations but can be obtained from the corresponding author upon reasonable request.
Supplemental Material
Supplemental material for this article is available online.
References
Supplementary Material
Please find the following supplemental material available below.
For Open Access articles published under a Creative Commons License, all supplemental material carries the same license as the article it is associated with.
For non-Open Access articles published, all supplemental material carries a non-exclusive license, and permission requests for re-use of supplemental material or any part of supplemental material shall be sent directly to the copyright owner as specified in the copyright notice associated with the article.