
Abstract
Background:
With the growing accessibility of the internet, dietary assessment tools, including food frequency questionnaires (FFQs), are increasingly being adapted for web platforms. A web-based FFQ was developed as a dietary assessment tool for healthy adults in Iran.
Objective:
This study aimed to develop an online FFQ for dietary data collection among Iranian adults and to compare its performance with the validated Iranian printed FFQ.
Methods:
Eligible participants were randomly assigned to complete both the printed and web-based FFQs. The type of FFQ alternated for each participant after 10 days. The agreement between the two FFQs was assessed using the Bland-Altman method and correlation analysis.
Results:
Of the 190 participants, final analyses were conducted on 141 individuals, including 70 females (49.6%) and 71 males (50.4%) who completed both FFQs. Agreement was high for all nutrient intakes (r > .8). Among food groups, “Whole grains” showed the highest correlation (r = .84), while “Potato” had the lowest (r = .25). There were no significant differences in the time taken to complete the questionnaires.
Conclusion:
The web-based FFQ demonstrated strong agreement with the validated printed FFQ, accurately reflecting nutrient and food group intakes in Iranian adults.
Introduction
Nutritional problems are among the leading causes of chronic diseases in both developed and developing countries. 1 The increasing prevalence of obesity and other non-communicable diseases is significantly influenced by lifestyle changes, particularly those related to diet and nutrition. 2 Accurately assessing dietary intake is a complex and challenging task in epidemiological studies, which is critical for understanding the relationship between diet and disease. 3 Among the various methods used for dietary assessment, the food record, 24-hour dietary recall, and food frequency questionnaire (FFQ) are the most common.4,5
The food record method requires participants to document all foods and beverages consumed over a period of 3 to 7 days. 6 In contrast, the 24-hour dietary recall involves an interviewer asking participants to recall all foods and drinks consumed in the past 24 hours. 7 The FFQ is a retrospective tool designed to assess dietary intake over a period of 6 to 12 months, making it particularly valuable for long-term epidemiological and prospective cohort studies.8,9 The FFQ is recognized for its simplicity, cost-effectiveness, and efficiency, which contribute to its widespread use in nutritional research. 10
With the rapid advancement of internet technology, traditional dietary assessment tools, including the FFQ, have been adapted to web-based formats.11,12 These online questionnaires are distributed via a Uniform Resource Locator (URL) to participants, allowing for simultaneous data collection and more efficient data processing.13,14 Additionally, web-based FFQs reduce the risk of data loss and errors compared to their printed counterparts.15,16 The inclusion of photographs in online questionnaires can further enhance user experience by making the process more intuitive and convenient. 17 Web-based methods also offer advantages in terms of accessibility across different geographical locations and cost-effectiveness, as they eliminate the need for interviewers and reduce the time required to complete the forms.18,19 However, there are limitations to the online approach; for instance, individuals who lack internet access or proficiency are unable to participate, potentially leading to selection bias. 20
The printed FFQ, traditionally used in epidemiological studies, has been extensively validated and includes 147 food items, as developed for the Tehran Lipid and Glucose Study.21-23 This questionnaire is typically administered through interviews, with the collected data being manually entered into software programs for electronic analysis. Given the extensive number of food items included, both the completion of the FFQ and the data entry process can be time-consuming.
To address these challenges and enhance the efficiency of dietary data collection, this study aimed to develop a web-based FFQ tailored to the dietary habits of Iranian adults and to evaluate its comparability with the validated printed FFQ. This comparison is crucial for determining the reliability and validity of the web-based FFQ as an alternative tool in large-scale nutritional epidemiology studies.
Methods
Study sample
The sample size was determined using protein (mean = 16.53, SD = 3.26) and vitamin B12 (mean = 7.82, SD = 3.20) as primary outcomes, as reported in a study by Forster et al. 24 The sample size calculation was performed using the following formula:

where α = .05, with a 95% confidence level and d = 2%. This calculation yielded a sample size of 101 subjects. To account for a potential withdrawal rate of 40%, a total of 141 subjects were recruited. Participants aged over 18 were recruited from Ahvaz, Iran, via posters, email, social media, and the website (Figure 1). The exclusion criteria included pregnancy or lactation, limited internet access, adherence to a specific diet, use of appetite stimulants or suppressants, eating disorders such as anorexia or bulimia nervosa, food allergies or intolerances, and chronic conditions like diabetes, hypertension, or other diet-related diseases. All participants completed a medical history questionnaire and provided written informed consent. Weight was measured with participants wearing light clothing and no shoes, using a scale with 50 g accuracy. Height was measured without shoes, with participants standing straight, looking ahead, and with arms at their sides. A trained dietitian conducted all measurements.
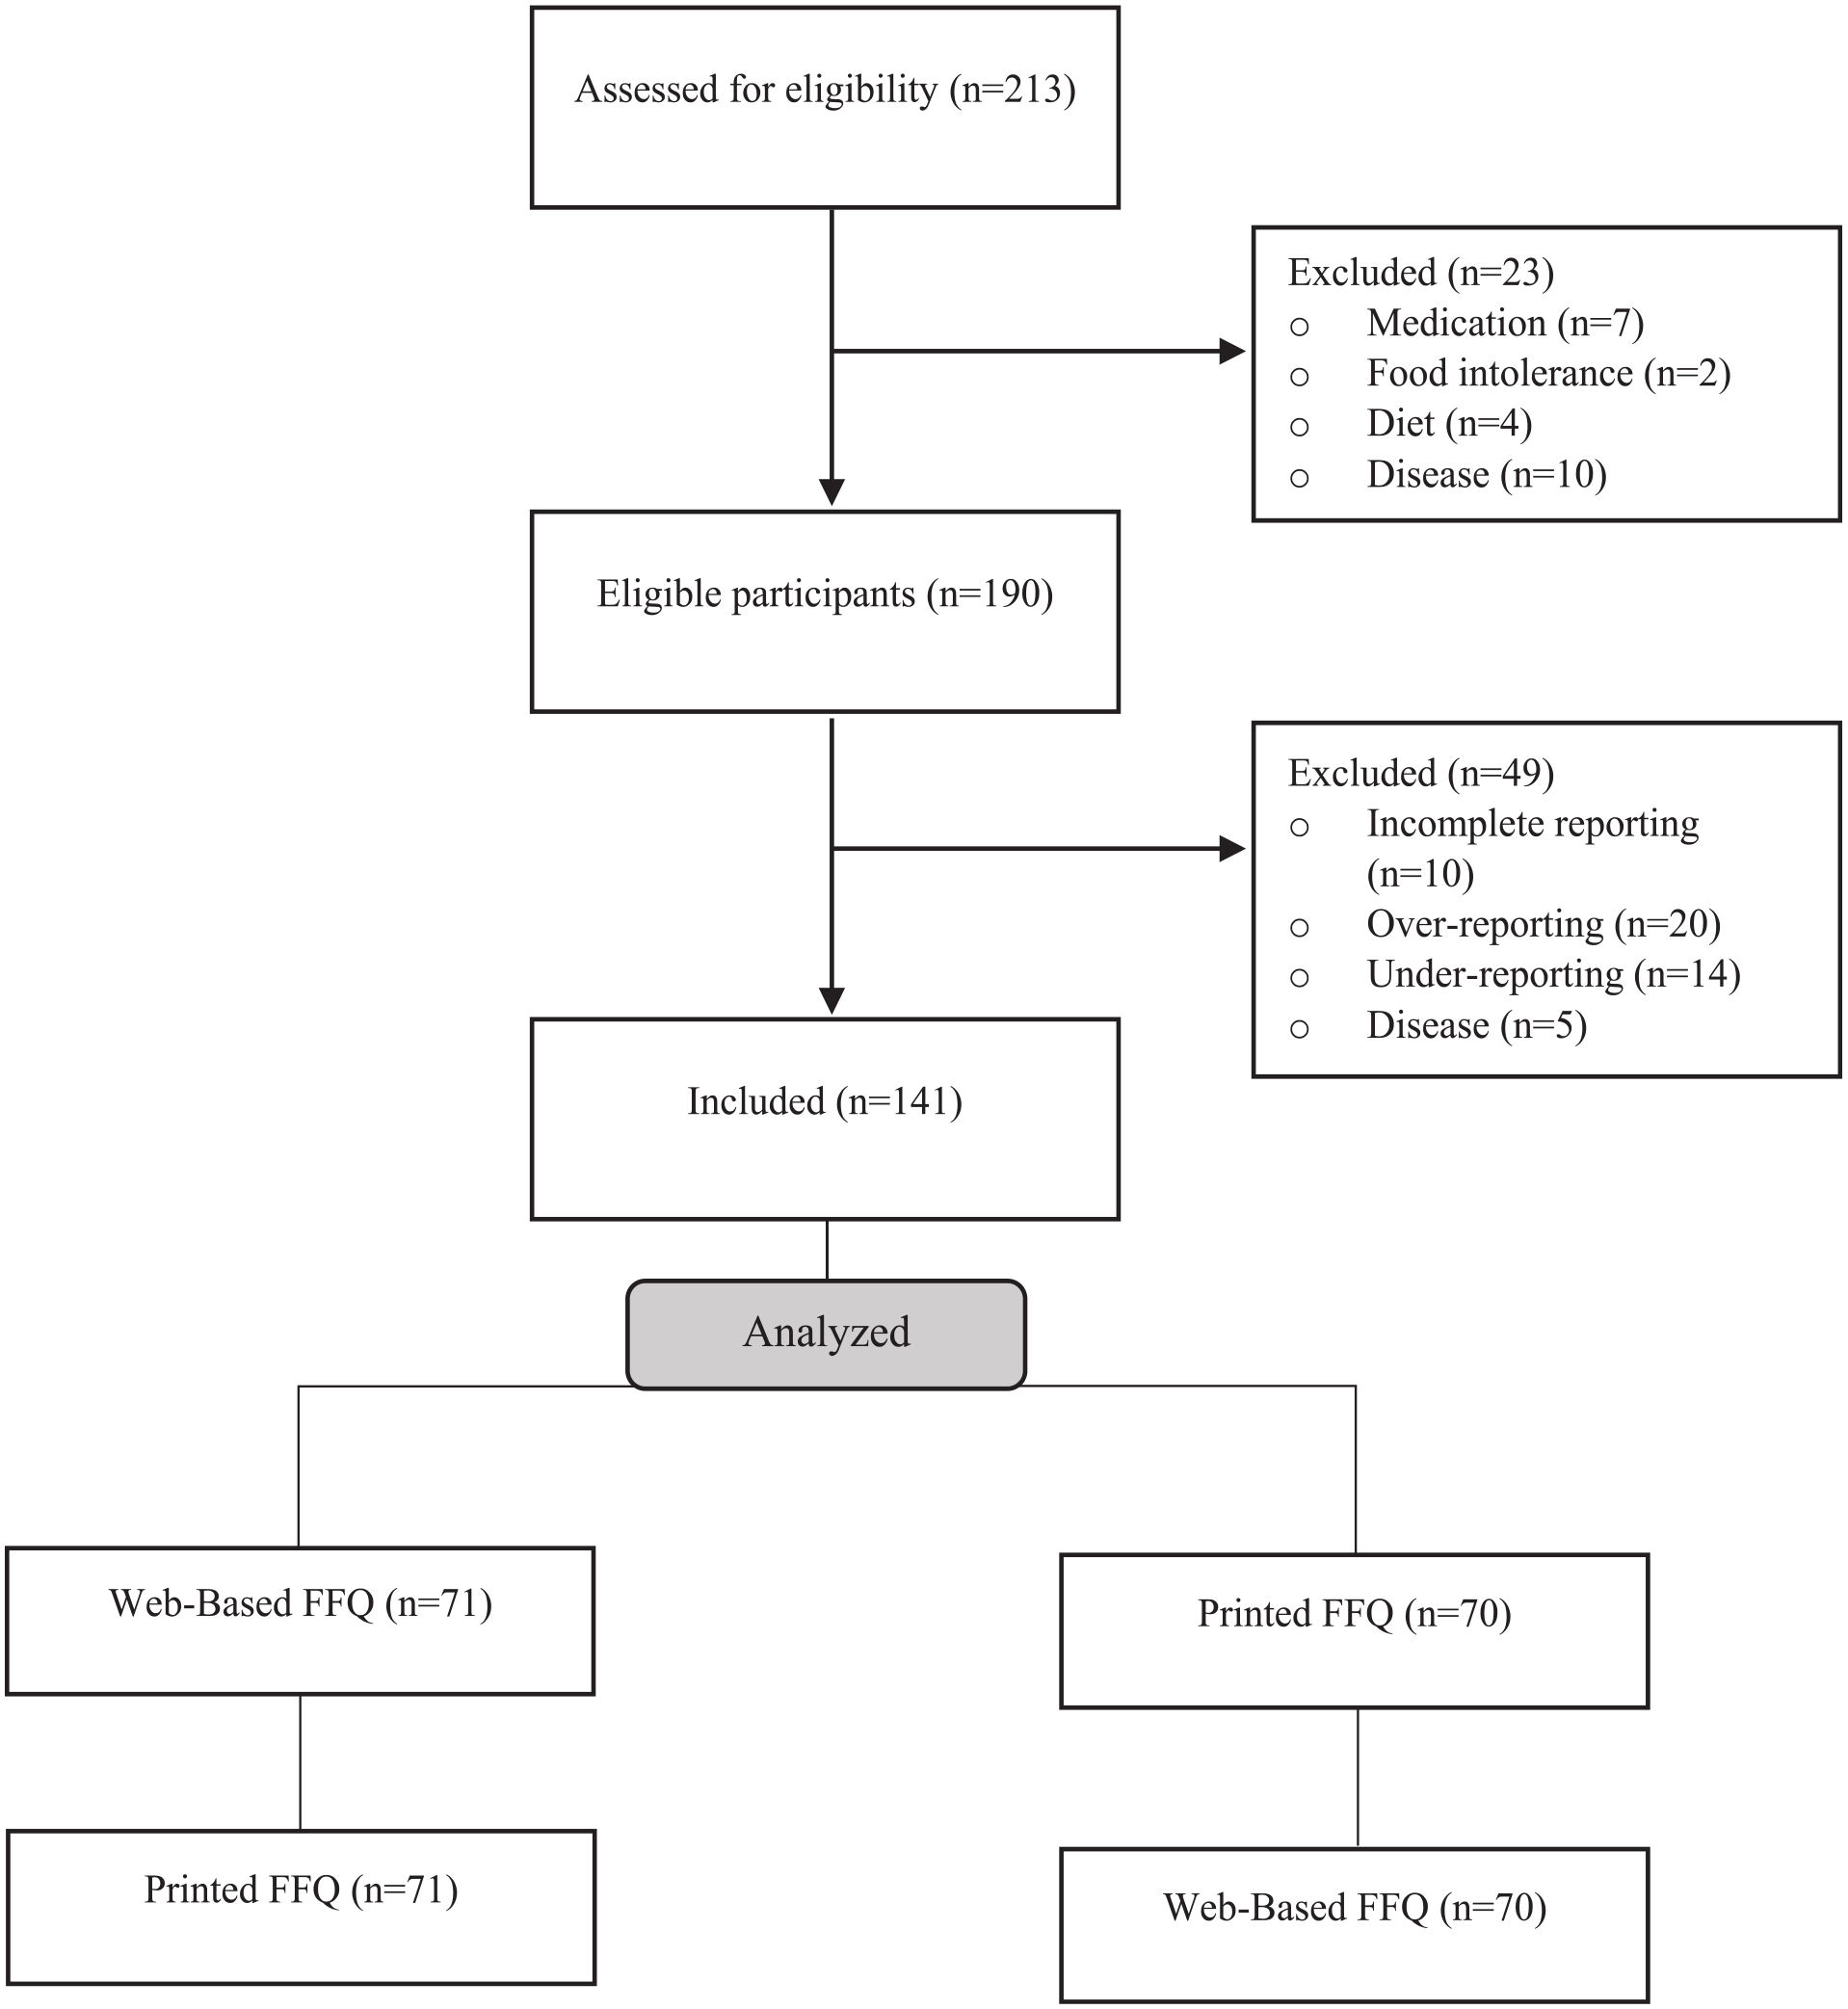
Flowchart of participant selection and retention.
Study design
This study aimed to validate the newly developed Web-based FFQ against the validated printed FFQ from the Tehran lipid and glucose study in Ahvaz, Iran, between October 2020 and February 2021. The Web-Based FFQ was developed on the Nutripors website (https://nutripors.ir/). Eligible participants were randomly asked to complete both the printed FFQ and the Web-Based FFQ. Both FFQs assessed the frequency of food intake, asking participants to report their consumption on a daily, weekly, monthly, or yearly basis. The order of the FFQs was alternated for each participant after a ten-day interval. The printed FFQ was distributed in person or by post, while the Web-Based FFQ was provided via a hyperlink sent through email or social media platforms like WhatsApp or Instagram. Participants who completed the two FFQs with a time interval greater than 10 days were excluded from the analysis. The Mifflin-St Jeor equation was used to calculate basal metabolic rate (BMR) and estimated energy expenditure (EER). Participants whose reported energy expenditure was lower or higher than the calculated EER were classified as under-reporters or over-reporters, respectively.
The Iranian online FFQ
The Web-Based FFQ was designed based on the well-validated FFQ used in the “Tehran Lipid and Glucose Study.” 21 The development of the Web-Based FFQ involved collaboration between dietitians and software engineers from Ahvaz Jundishapur University of Medical Sciences and Tehran University of Medical Sciences.
The Web-Based FFQ consisted of 147 food items categorized into 18 food groups, including “Refined grains,” “Whole grains,” “High-fat dairies,” “Low-fat dairies,” “Red meat,” “Processed meat,” “White meat,” “Potato,” “Egg,” “Legumes,” “Nuts,” “Fruits,” “Vegetables,” “Coffee, tea,” “Sugar,” “Sweets,” “Vegetable oils,” and “Hydrogenated fats.” A podcast was embedded within the Web-Based FFQ to guide participants on how to complete the questionnaire. The podcast provided instructions on the introduction of food items and groups, estimation of common portion sizes, and an explanation of the frequency of intake over different time periods (day, week, month, year). Both the FFQs and the podcast were presented in Persian.
Participants were asked to evaluate their intake frequency by responding to the question, “How many/much servings of the following food items have you consumed?” The frequency options were categorized as Daily, Weekly, Monthly, and Yearly, with each option further ranging from 1 to over 10 servings per time frame (Supplemental Figure 1). Participants could skip items they never consumed, and an empty box was provided at the end of the FFQ for additional explanations. Upon submitting the Web-Based FFQ, participants received an analysis of their dietary intake.
Nutritional composition and portion sizes were calculated using “The Manual for Household Measures, Cooking Yield Factors, and Edible Portion of Foods” and the “Tehran Lipid and Glucose Study.”21,25
Statistical analysis
In this study, various statistical methods were employed to compare the Web-Based FFQ with the printed FFQ. Descriptive statistics were used to summarize demographic characteristics and dietary intake data, with all data reported as mean ± standard deviation (SD). The normality of the data was assessed using the Kolmogorov–Smirnov test. For normally distributed data, comparisons between the two groups (Web-Based FFQ and printed FFQ) and between genders were made using the Independent t-test. Analysis of covariance (ANCOVA) was applied to compare the mean (SD) of normal data between the two groups after adjusting for energy intake.
To assess the agreement between the Web-Based and printed FFQs, Spearman’s correlation coefficient (SCC) was used to evaluate the strength and direction of the monotonic relationship between dietary intakes reported by the two FFQs. The SCC was selected due to its suitability for non-normally distributed data, as it does not assume a linear relationship. SCCs were calculated separately for nutrients and food groups, and further stratified by gender to explore potential differences in correlation between men and women.
The relationship between quantitative variables was further assessed using Pearson’s correlation coefficient (R) for unadjusted data and the Partial correlation test after adjusting for energy intake. Additionally, Bland-Altman plots were generated to visualize the limits of agreement between the two FFQs for macronutrient intakes. For each macronutrient, the difference in mean between the two methods (Printed FFQ—Web-Based FFQ) was plotted against the average of the two methods. The methods were considered comparable if more than 95% of data plots fell within the limits of agreement (mean ± 1.96 SD).
All statistical analyses were conducted using SPSS version 23.0 (SPSS Inc., Chicago, IL, USA). A P-value of less than .05 was considered statistically significant.
Results
Out of the 213 participants initially assessed for inclusion, 190 met the eligibility criteria. At the onset of the study, 15 participants were excluded due to a diagnosis of coronavirus disease and incomplete FFQs (Figure 1). An additional 34 participants were excluded from the final analysis due to reported energy intakes exceeding 4500 kcal/day (n = 20) or falling below 500 kcal/day (n = 14). Consequently, the final analysis was conducted on 141 participants, comprising 70 females (49.6%) and 71 males (50.4%), all of whom completed both the printed and Web-Based FFQs.
Demographic characteristics
As shown in Table 1, no significant differences were observed in age or body mass index (BMI) between male and female participants. However, significant differences were noted in weight, height, and BMI with male participants being significantly heavier (P < .01) and taller (P < .01) than their female counterparts.
Characteristics of the study participants.
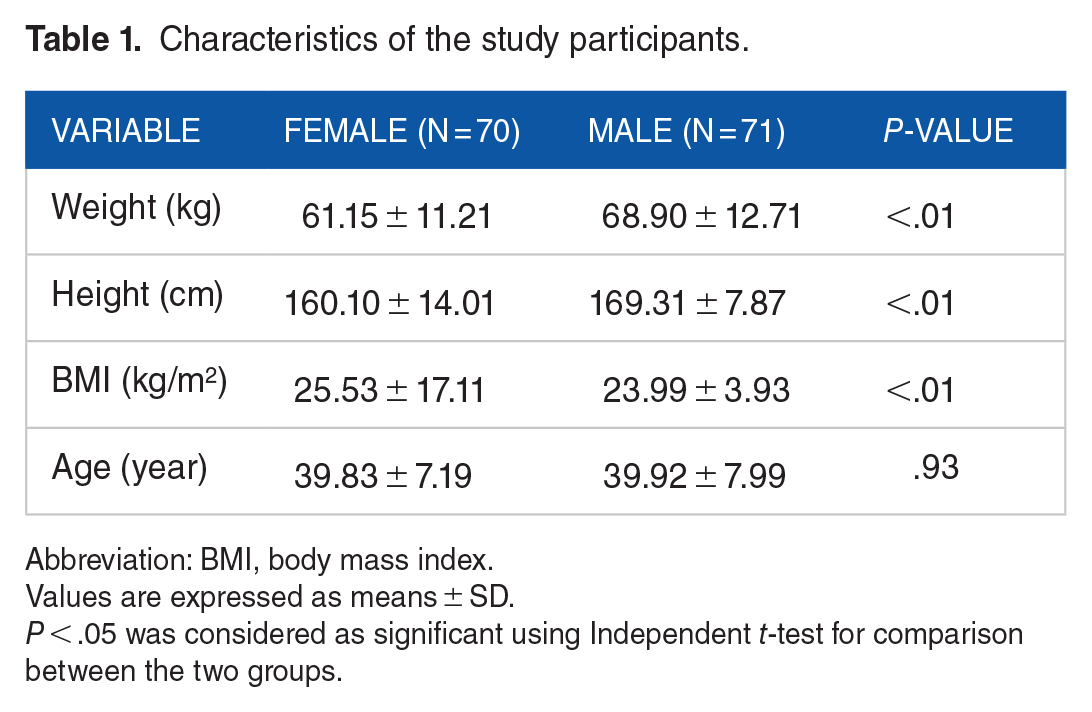
Abbreviation: BMI, body mass index.
Values are expressed as means ± SD.
P < .05 was considered as significant using Independent t-test for comparison between the two groups.
Macronutrient intakes
The mean energy and nutrient intakes from both the printed and Web-Based FFQs were compared based on the type of questionnaire and gender (Supplementary Table 1). There were no significant differences in energy intake between the two FFQs. However, cholesterol intake was significantly higher in the Web-Based FFQ compared to the printed version for the total participant group (P < .05). After adjusting for energy, no significant differences were found in the intake of protein, carbohydrates, total fat, and monounsaturated fatty acids (MUFA). Significant differences were observed for saturated fatty acids (SFA), polyunsaturated fatty acids (PUFA), and cholesterol (P < .05). When analyzing gender-specific data, cholesterol intake was significantly higher in women using the Web-Based FFQ (P = .01). Correlation coefficients for macronutrient intakes showed a strong relationship between the printed and Web-Based FFQs (r > .6; Table 2).
Correlation between each factor with itself before and after energy adjustment.

Abbreviations: MUFA, monounsaturated fatty acid; PUFA, polyunsaturated fatty acid; SFA, saturated fatty acid.
R was considered as correlation coefficient using Pearson- test for correlation between variables without adjusted-energy intake.
R was considered as correlation coefficient using Partial- test for correlation between variables with adjusted-energy intake.
P < .05 was considered as significant. **P < .001 was considered as significant.
Bland-Altman analysis was conducted to assess the agreement between the two methods for macronutrient intakes. As depicted in Figure 2, there was a good agreement for the estimated macronutrient intakes between the two FFQs.

Bland-Altman plots showing mean difference and limits of agreement.
Micronutrient intakes
The evaluation of micronutrient levels revealed that the intakes of vitamin C, thiamine, riboflavin, vitamin B6, calcium, potassium, and selenium were significantly higher in the Web-Based FFQ compared to the printed FFQ. After energy adjustment, significant differences remained for riboflavin, calcium, phosphorus, potassium, and selenium, while vitamin C and vitamin B6 differences were no longer significant (Supplemental Table 1). Gender-specific analysis showed that selenium intake was significantly higher in both women and men using the Web-Based FFQ (P < .05). Correlation coefficients for micronutrient intakes also demonstrated a strong relationship between the two FFQs (r > .6; Table 2).
Food group intakes
To compare food group intakes between the two FFQs, food items were categorized into 18 groups. As shown in Supplemental Table 2, the mean intake of eggs was significantly higher in the Web-Based FFQ (P < .01). Conversely, the mean intakes of potatoes and vegetable oil were significantly lower in the Web-Based FFQ (P = .03 and P < .01, respectively). Gender-specific analysis revealed that the mean intakes of eggs and vegetable oil differed significantly between the two FFQs in both women and men (P < .05). Additionally, the mean intake of potatoes was significantly lower in men using the Web-Based FFQ (P = .03).
Correlation coefficients for food group intakes are presented in Table 3. Strong correlations (r > .6) were found for several food groups, including “Refined grains,” “Whole grains,” “High-fat and Low-fat dairies,” “Red meat,” “Sugar,” “Sweets,” and “Hydrogenated Fats.” Moderate correlations (r = .4 to .6) were observed for “Processed meat,” “White meat,” “Egg,” “Legumes,” “Fruits,” “Vegetables,” “Coffee, tea,” and “Vegetable oil.” However, poor correlations (r < .4) were noted for “Potatoes” and “Nuts.” In gender-specific analyses, poor correlations were found for “White meat,” “Egg,” “Nuts,” “Legumes,” and “Fruits” in men. The intake of “Potatoes” was poorly correlated between the two FFQs in both men and women.
Correlation between each factor with itself before and after energy adjustment.
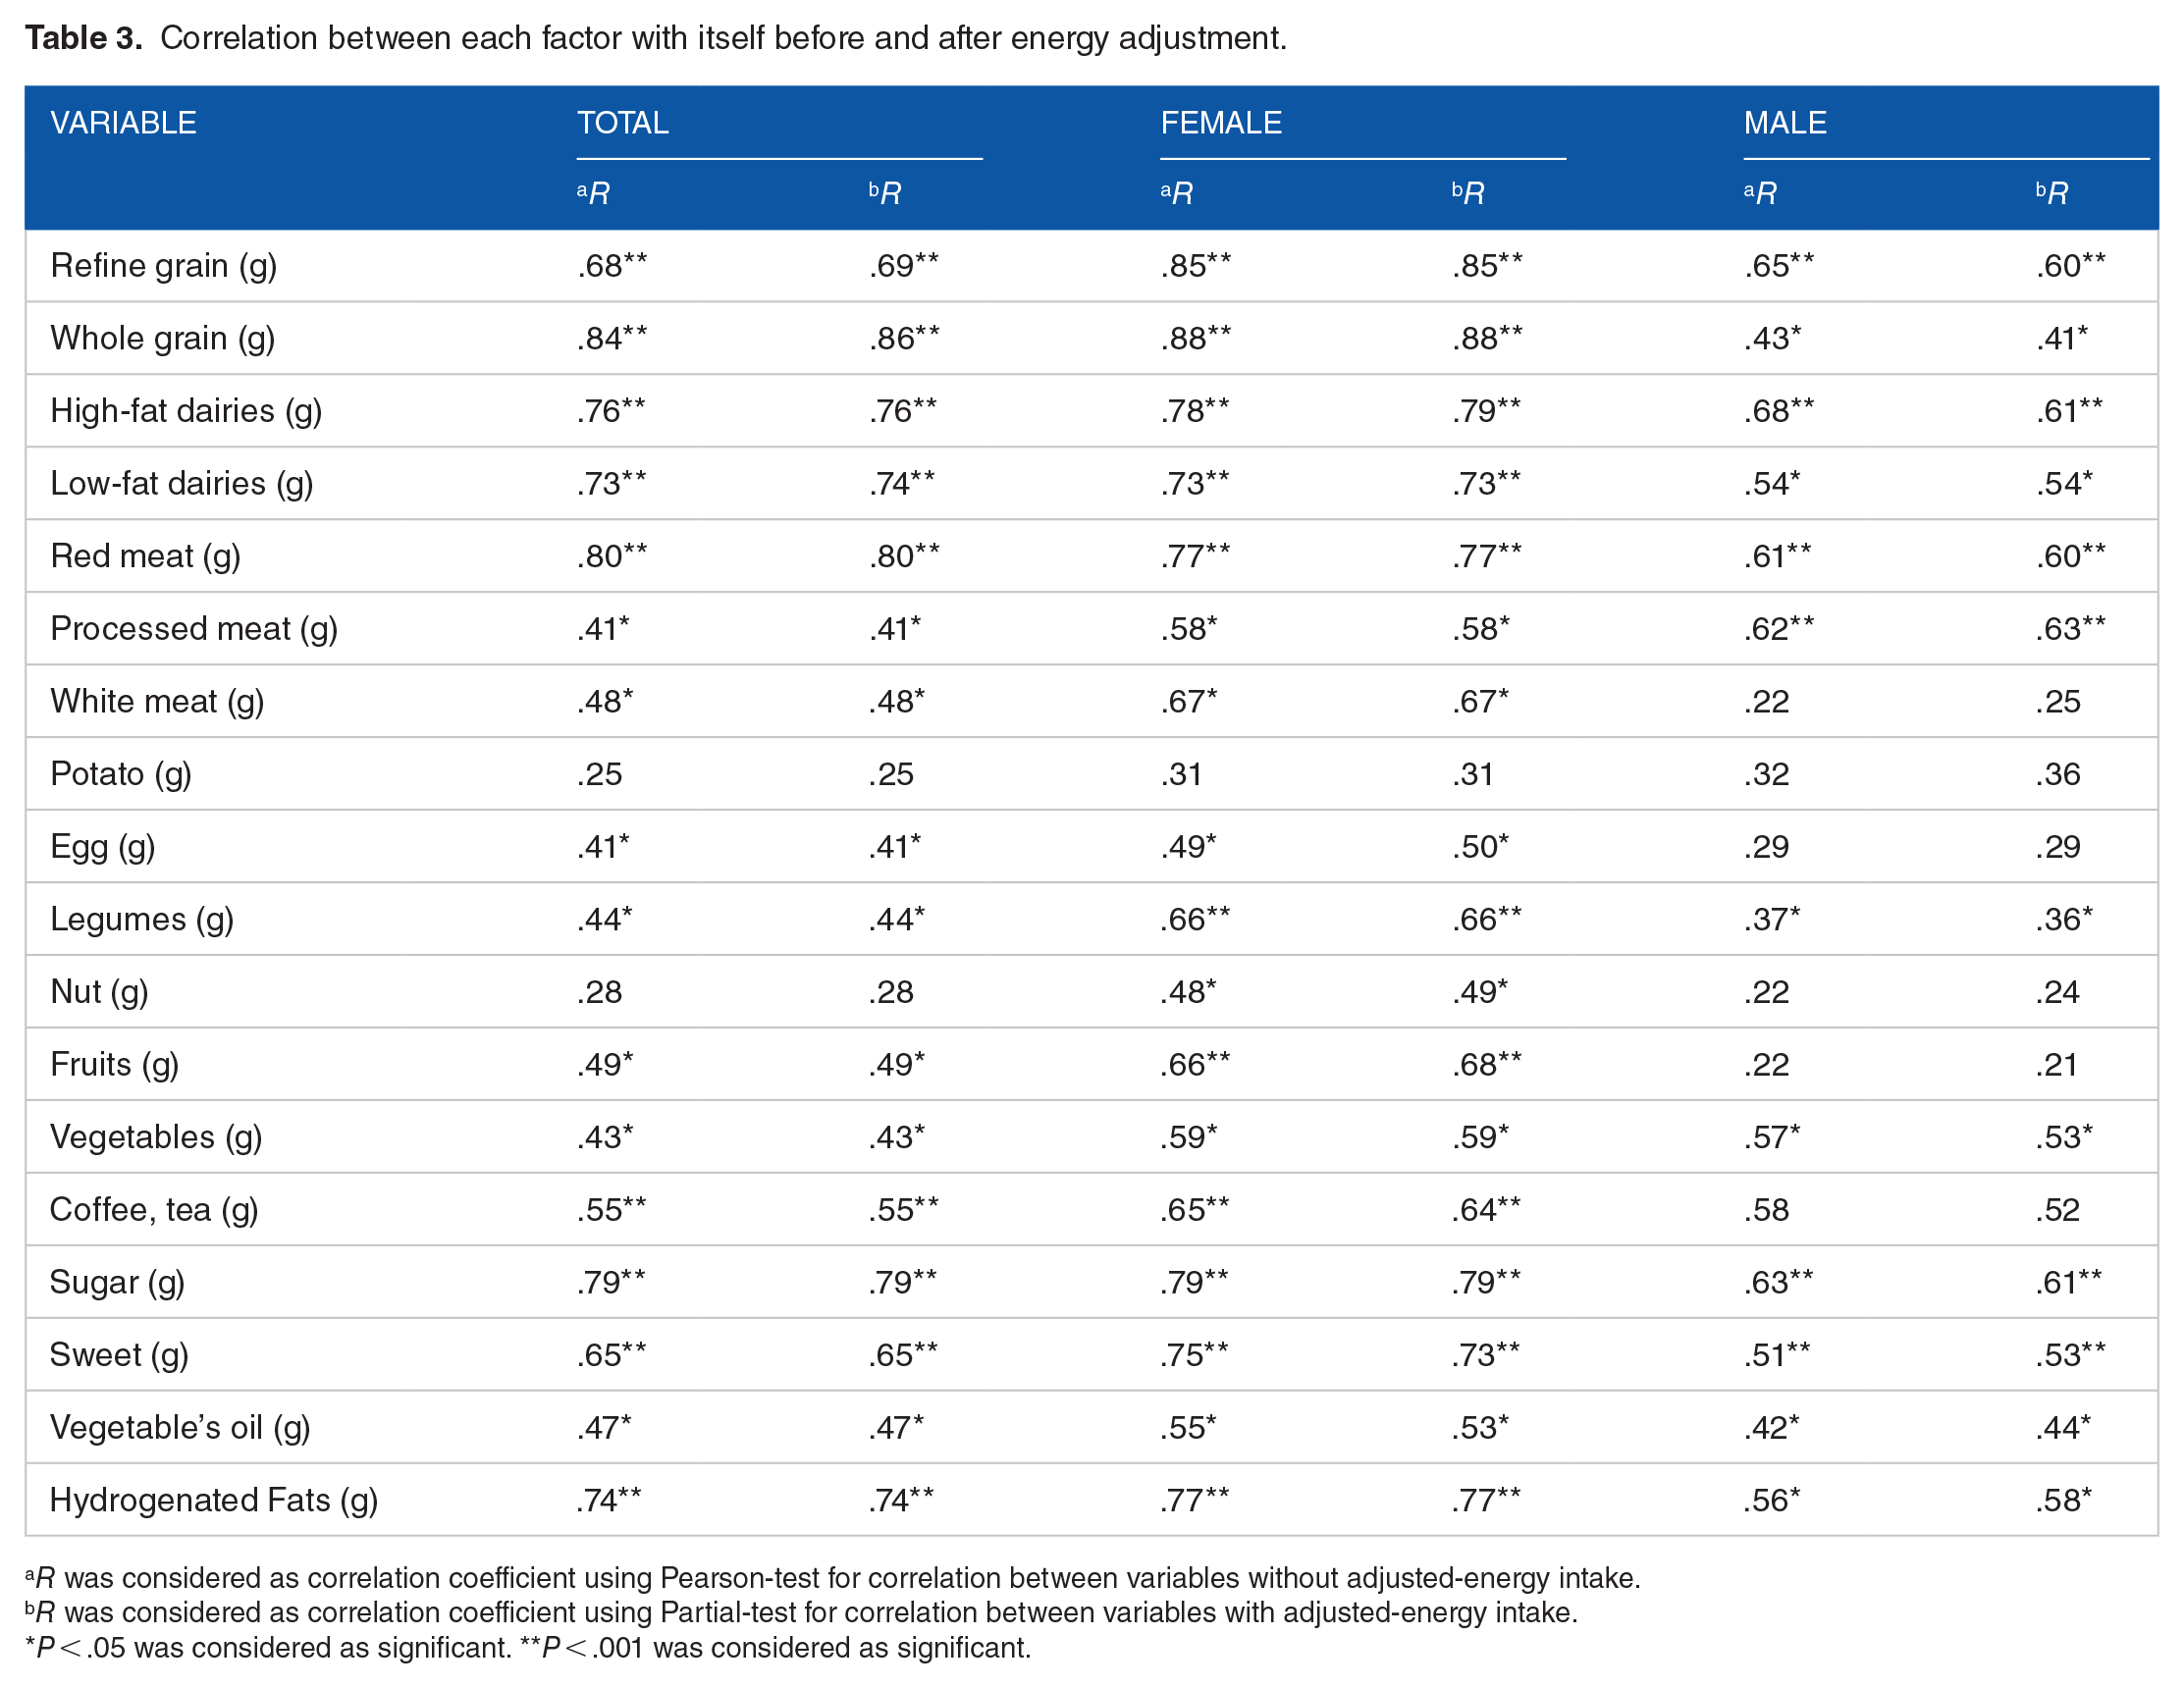
R was considered as correlation coefficient using Pearson-test for correlation between variables without adjusted-energy intake.
R was considered as correlation coefficient using Partial-test for correlation between variables with adjusted-energy intake.
P < .05 was considered as significant. **P < .001 was considered as significant.
Time to complete questionnaires
There were no significant differences in the time required to complete the printed versus Web-Based FFQs (P = .09; Table 4).
Comparison of mean time spent to complete the questionnaires.
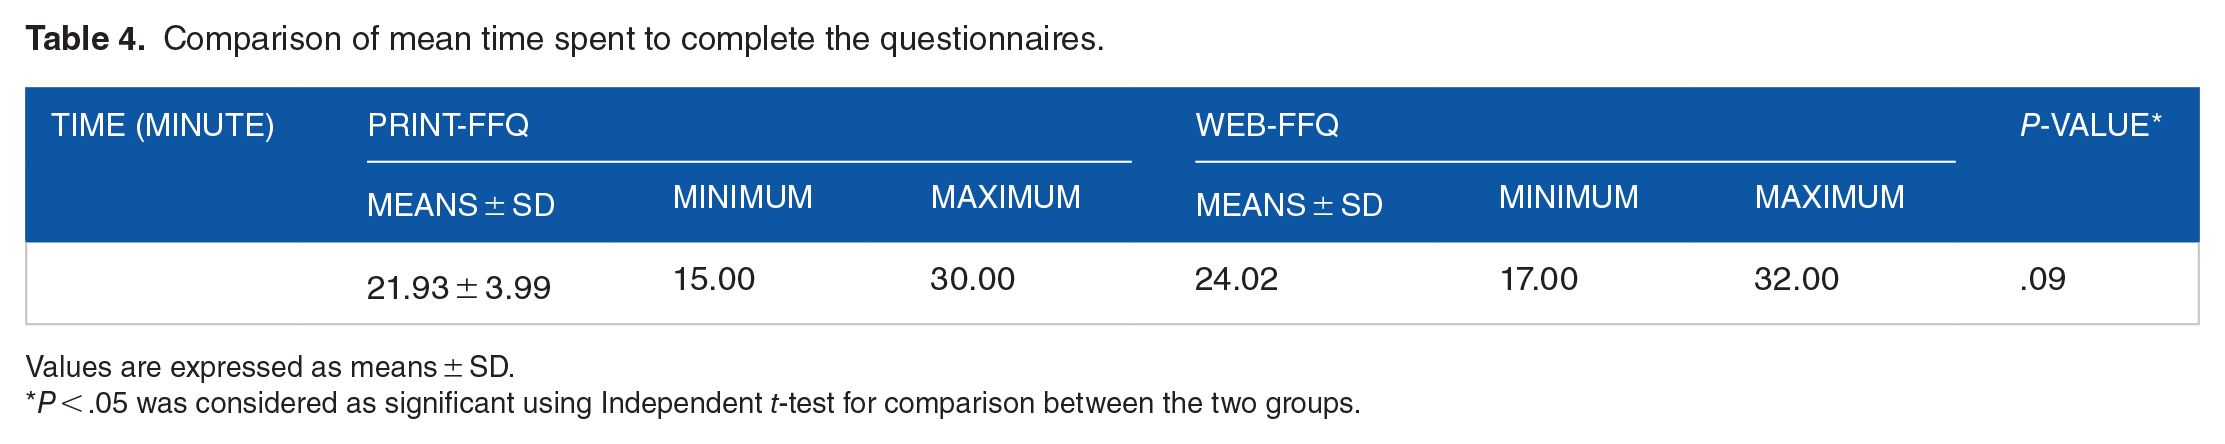
Values are expressed as means ± SD.
P < .05 was considered as significant using Independent t-test for comparison between the two groups.
Discussion
This study sought to validate a newly developed Web-Based FFQ by comparing its performance with a traditional, validated printed FFQ. The Web-Based FFQ was tailored to the dietary habits of the Iranian population, incorporating culturally specific food items and utilizing a podcast to aid participants in estimating portion sizes accurately. Our findings demonstrate that the Web-Based FFQ is a promising tool for dietary assessment, showing strong correlations with the printed FFQ across most nutrients and food groups. However, the use of correlation coefficients alone, while indicative of a relationship between the two methods, does not sufficiently address the issue of absolute agreement between the two FFQs. To provide a more nuanced evaluation, we employed Bland-Altman plots, which revealed that the Web-Based FFQ offers a comparable level of accuracy to the printed FFQ, albeit with some notable discrepancies in specific food groups and nutrient intakes.
Assessment of agreement
The high correlation coefficients observed between the two FFQs, with most nutrients exceeding a value of .7, align with the upper ranges reported in prior validation studies.15,16,24,26-29 However, reliance on correlation alone is insufficient for assessing agreement, as it does not account for potential systematic biases between methods. Bland-Altman analysis was therefore essential to this study, providing insight into the extent and nature of any discrepancies between the two FFQs. 30 Our analysis revealed that while the Web-Based FFQ generally mirrors the printed FFQ, there were variations in the reporting of certain nutrients, such as saturated fatty acids (SFA), polyunsaturated fatty acids (PUFA), and cholesterol, where systematic biases were observed. These findings underscore the importance of using multiple statistical approaches when validating dietary assessment tools, as correlation alone may mask underlying inconsistencies. 31
Food group intakes
The evaluation of food group intakes revealed a range of correlations, from as high as .86 for some groups to as low as .25 for others, such as “Potato” and “Nuts.” These variations are consistent with the literature, where certain food groups often present challenges in accurate dietary recall.27,32-35 The lower correlations for “Potato” and “Nuts” could be attributed to the inherent variability in portion sizes and the difficulty in estimating intake for these foods. Furthermore, the Web-Based FFQ’s incorporation of a podcast to standardize portion size estimation may have improved accuracy for some food groups, but it also highlights the limitations of audio guidance compared to visual aids like photographs. Research suggests that visual tools significantly enhance the accuracy of portion size estimation, particularly in web-based dietary assessments. 27 Thus, the absence of such visual aids in our Web-Based FFQ could explain the observed discrepancies in certain food group intakes.
Gender differences in reporting
A notable finding in our study was the gender-specific variation in correlation coefficients, with men generally showing lower correlations than women. This observation is consistent with existing research, which highlights gender differences in dietary reporting accuracy.36,37 Men are often found to have higher caloric intakes and larger portion sizes, which can contribute to greater variability and discrepancies in dietary recall. The lower correlations in men might also be influenced by social desirability bias, where participants report their dietary intake in a manner they perceive as more socially acceptable. This bias is often more pronounced in men, particularly in cultures where certain dietary behaviors are more socially prescribed. Additionally, the systematic overestimation or underestimation of food group intakes in web-based tools, as observed in men, may reflect differences in cognitive processing between genders, where men might be less attentive to or less accurate in reporting details related to portion sizes and food types.37-39
Impact of methodological choices
The methodological choices in the development of the Web-Based FFQ, such as the exclusion of visual aids due to slow internet speeds, likely impacted the study’s findings. While the use of a podcast was a practical solution, it may not have fully compensated for the absence of photographs, which are known to improve portion size accuracy. 27 This limitation highlights the need for future iterations of web-based dietary tools to incorporate both audio and visual aids, ensuring that participants have multiple reference points for accurate reporting. Furthermore, the 10-day timeframe within which participants completed both FFQs was designed to minimize the impact of dietary changes on the results. However, this short interval may not account for the day-to-day variability in dietary intake, which could introduce noise into the data and affect the reliability of the correlations observed. 40
Strengths and limitations
The strengths of this study include its culturally specific design and the gender-based analyses, which provide valuable insights into the differential performance of dietary assessment tools. The Web-Based FFQ’s strong correlations with the printed FFQ across most nutrients and food groups suggest it is a viable alternative for large-scale epidemiological studies, particularly in settings where traditional methods are logistically challenging. However, the study’s limitations, including the lack of visual aids and the challenges posed by the coronavirus pandemic, must be acknowledged. These factors likely influenced the accuracy of dietary reporting and the generalizability of the findings. Additionally, the study’s sample size, while adequate for initial validation, may not capture the full range of variability in dietary intake within the broader population.
Conclusion and Future Directions
In conclusion, the Web-Based FFQ developed in this study demonstrates good agreement with the validated printed FFQ and offers a practical tool for dietary assessment in epidemiological research. Despite some discrepancies in food group intakes and lower correlations in men, the overall findings support the use of the Web-Based FFQ as a reliable alternative to traditional dietary assessment methods. Future research should focus on improving the tool’s accuracy by incorporating visual aids and considering longer intervals between FFQ administrations to account for variability in dietary intake. Additionally, expanding the study to include diverse populations and multi-center designs will enhance the generalizability of the findings and address potential cultural and ethnic differences in dietary reporting. By refining these methodologies, web-based dietary assessments can become more accurate, user-friendly, and adaptable to a wide range of research settings.
Supplemental Material
sj-docx-1-nmi-10.1177_11786388251314447 – Supplemental material for Online Version of the Self-Administered Food Frequency Questionnaire for the Iranian Adult Population
Supplemental material, sj-docx-1-nmi-10.1177_11786388251314447 for Online Version of the Self-Administered Food Frequency Questionnaire for the Iranian Adult Population by Mehrnaz Morvaridi, Majid Karandish, Hadi Bazyar, Hamid Rasekhi and Hossein Bavi Behbahani in Nutrition and Metabolic Insights
Footnotes
Acknowledgements
We extend our sincere gratitude to all the participants for their cooperation in this study. We also wish to express our appreciation to the staff of Ahvaz Jundishapur University of Medical Sciences for their support. We also thank Siavash Arjangi and Fatemeh Bavi Behbahani for designing the Nutripors website.
Funding:
The author(s) disclosed receipt of the following financial support for the research, authorship, and/or publication of this article: This study was funded by the Vice-Chancellor for Research Affairs at Ahvaz Jundishapur University of Medical Sciences (grant number 98S36).
Declaration of conflicting interests:
The author(s) declared no potential conflicts of interest with respect to the research, authorship, and/or publication of this article.
Author Contributions
Conceptualization: M.M., H.B.B., M.k. Methodology: H.B.B., M.k., H.B., H.R. Resources: H.B.B., H.B. Writing - Original Draft: M.M., H.B.B. Writing - Review & Editing: H.B.B., M.M., M.K., H.B. Supervision: H.B.B., M.A., M.K. Project administration: H.B.B., M.K. Investigation: H.B.B., M.A., M.K., H.B., H.R. Formal analysis: H.B.B., M.A. Visualization: H.B.B., M.M.
All authors read and approved the final version of the manuscript.
Data Availability Statement
The datasets used and analyzed during the current study are available from the corresponding author upon reasonable request.
Ethics Statement
This study was conducted in accordance with the Declaration of Helsinki and received approval from the Ethics Committee of Ahvaz Jundishapur University of Medical Sciences (IR.AJUMS.REC.1398.254).
Supplemental Material
Supplemental material for this article is available online.
References
Supplementary Material
Please find the following supplemental material available below.
For Open Access articles published under a Creative Commons License, all supplemental material carries the same license as the article it is associated with.
For non-Open Access articles published, all supplemental material carries a non-exclusive license, and permission requests for re-use of supplemental material or any part of supplemental material shall be sent directly to the copyright owner as specified in the copyright notice associated with the article.