
Abstract
Background:
Although a palaeolithic diet promotes healthier food choices that aid in weight management and reduce cardiovascular risks, its effectiveness in endurance sports is still debated due to its typically low carbohydrate content.
Objective:
This study examined the impact of a 6-week palaeolithic diet (PD-G) versus a mixed diet (MD-G), both paired with Sprint interval training (SIT), on various metabolic and performance-related parameters.
Methods:
Body composition, time trial (TT) performance (covered distance during a 60-minute run on a 400-metre track) and changes in metabolic (respiratory exchange ratio [RER], substrate oxidation rates) and performance-related (time at ventilatory threshold [VT] and respiratory compensation point [RCP], maximum oxygen uptake (V̇O2max) and time to exhaustion [TTE]) parameters during a ramp incremental running test were assessed in 14 male endurance athletes. Additionally, Gastrointestinal Quality of Life index (GLQI) and perceptual responses to the diets [visual analogue scale (VAS)] were measured.
Results:
After 6 weeks, both groups improved in TTE and distance covered in the 60-minute TT, without significant group differences. In the PD-G body weight, fat mass and systolic and diastolic blood pressure decreased. At rest, RER and carbohydrate oxidation significantly decreased in the PD-G, with a tendency towards significance during exercise, while changes in fat oxidation rates were not statistically significant at rest and throughout the exercise test; in contrast, the MD-G exhibited smaller changes across these parameters.
Conclusion:
In this investigation, a palaeolithic diet in combination with SIT appeared to have positive effects on fat mass, blood pressure and substrate utilization under resting conditions in a group of male endurance athletes. However, based on the current findings for performance metrics, a palaeolithic diet cannot be recommended unreservedly for healthy endurance athletes.
Plain language title:
Effect of modern Paleo diet on metabolism and performance in male endurance athletes
Keywords
Introduction
Over the past 30 years, a palaeolithic diet has gained in importance as a healthy nutritional concept. Since the exact nutritional conditions in the upper Palaeolithic period (40,000-10,000 BC) are still unclear and foods of these days are not comparable with foods 40 000 years ago, the modern palaeolithic diet does not pursue the identical nutritional concept of hunters and gatherers. 1 In addition, there was no universal palaeolithic diet due to regional differences. 2 Anthropological examinations showed that our ancestors consumed less refined carbohydrates (cultured grains and sugars), no dairy products, and less foods high in sodium. There was also a different composition of micronutrients. 1 The assumption that a palaeolithic diet results in healthier food choices is supported by the observation that people whose nutrition is similar to those of our ancestors rarely experience health problems. 3 Clinical studies have examined the effect of a palaeolithic diet on metabolic diseases and weight loss with positive results. The positive effects are attributed to improved plasma glucose levels, lower cardiovascular risk factors, increased insulin sensitivity and an improved lipid profile.4-7
The hypothesis is that the palaeolithic diet, characterized by a higher intake of micronutrients such as calcium, magnesium, B vitamins, iron, and zinc due to healthier food choices, may support muscle contraction, energy supply, and immune function, potentially leading to improved training adaptations. The palaeolithic diet is rather associated with lower carbohydrate content 8 which might be impractical for endurance sports, as studies often link low carbohydrate intake to minimal or even negative effects on endurance performance. 9 However, the variability in the specific foods included in different interpretations of the palaeolithic diet leads to differences in macronutrient compositions, including variations in the amount of carbohydrate intake. 10 Based on the carbohydrate content, it, therefore, cannot be concluded, whether the palaeolithic diet is advantageous for endurance performance. A major aspect of carbohydrate intake is the quality of the sources chosen. The sources of carbohydrates (fruit, vegetables, some legumes and natural sweeteners) are characterized by a low glycaemic index and a high proportion of minerals and vitamins. Low glycaemic carbohydrates and the increased intake of monounsaturated fatty acids reduce postprandial hyperglycaemia. 11 In a randomized, controlled study, a palaeolithic diet showed a significantly greater improvement in glucose tolerance and a reduction in insulin resistance compared to a Mediterranean diet. 12 A reduced insulin reaction is the up-regulating signal for an increased fat oxidation and the preservation of intramuscular and intrahepatic glycogen stores during intensive, long-lasting endurance training.13,14 Therefore, there is public interest in a palaeolithic diet to improve health in daily life and sport. 1 First case reports of marathon runners showed that the interviewed endurance athletes followed most frequently a vegetarian, a gluten-free or palaeolithic diet due to the self-reported belief in performance elevating effects of the respective diet. 15 Additionally, an initial study involving physically active men and women demonstrated that following a palaeolithic diet for 3 weeks led to significant reductions in weight and systolic blood pressure, without notable differences in physical fitness compared to the control group. 16 So far, clinical research on the effects of a palaeolithic diet in endurance athletes remains limited. 17
This pilot study aimed to evaluate the effects of a 6-week palaeolithic diet (PD-G) versus mixed diet (MD-G) control, both combined with Sprint interval training (SIT), on metabolic and performance-related parameters in healthy male endurance athletes.
Methods
Experimental design and participants
A monocentric, prospective, open pilot trial at the University of Freiburg, Germany was designed to assess the additional effect of a palaeolithic diet on metabolic and performance-related parameters, beyond the effects of a standardized SIT regimen. For that purpose, both groups followed the same supervised SIT protocol at the University of Freiburg within a window of 8 am – 8 pm. Participants were assigned specific time slots within this 12-hour period to complete their training. One group also implemented an ad libitum palaeolithic diet (PD-G), while the control group maintained a mixed diet (MD-G). A total of 20 healthy male endurance athletes, including distance runners, cyclists, and those engaged in basic endurance training (eg, soccer, racket sports), aged 18 to 50 years (with at least 2 training sessions per week), were recruited. Each group consisted of 10 participants to gather data for a power analysis to determine significant group differences. 18 Exclusion criteria included reported health problems during or after physical activity, unstable weight or eating behaviour, adherence to a special diet (eg, vegan), and contraindications to physical activity per the American College of Sports Medicine guidelines, such as cardiovascular, metabolic, or renal diseases diagnosed from anamnesis. 19
The study protocol was approved by the Ethical Committee of the University of Freiburg (ETK: 208-18) and registered at the German Clinical Trials Register (DRKS00025708). The study was completed over a 6-week period. The different phases of the study are summarized in Figure 1.

Overview of the study schedule.
After providing written informed consent, participants completed a screening with a medical history questionnaire to ensure they met the inclusion criteria and had no risk factors that could be exacerbated by the exercise protocols. Anthropometric data (height, weight, age) as well as blood pressure were also collected. To ensure that participants in both groups had similar mean baseline values in performance-related parameters, eligible participants were matched according to their maximum oxygen uptake (VO2 max) after enrolment in the study. Study allocation was performed by the supervising study investigator. At baseline (T0) and post-intervention (T6), body composition was assessed as described in the efficacy outcomes section. To evaluate endurance running performance, participants completed a ramp incremental test and a 1-hour time trial. Pooled analyses of studies examining substrate oxidation during exercise have shown that substrate utilization, as reflected by the respiratory exchange ratio (RER), is influenced by nutritional status, including carbohydrate intake before and during exercise. 20 In this context, following a 12-hour fast the participants consumed 2 bananas à 125 g (50 g carbohydrates) 45 minutes prior to both exercise tests at baseline (T0) and post-intervention (T6), to standardize their nutritional status. 21 For all visits (screening, T0, and T6), participants were instructed to arrive at the laboratory at the same morning time after this fasting period and to empty their bladders before measurements. To ensure euhydration, they were advised to drink 1 l of water in the evening and 0.5 l in the morning. 22 Alcohol consumption was prohibited for 48 hours before all examinations. The responsible statistician remained blinded throughout the analysis procedures. Data were not unblinded until after the completion of data collection and database locking, in accordance with guidelines for data management.
Efficacy outcomes
Body composition (fat-free mass and fat mass) was assessed using bioelectrical impedance analysis (BIA), which has high reliability for evaluating body composition in physically active adults.23,24 As described by Zdzieblik et al, 22 participants were measured with the OMRON BF-500 scale, entering their age, height, and male sex. While wearing skintight clothing, they stood barefoot on the scale and grasped the handle electrodes for about 10 seconds. In accordance with the manufacturer’s recommendations, measurements were taken in the morning after a fasting period, and systolic and diastolic blood pressure were recorded at rest.
A spiroergometry (Geratherm Respiratory GmbH, Germany) was performed on the treadmill (RAM Model 770CE, United Kingdom), as current studies suggest that an SIT has a significant impact on the VO2max .25,26 First evidence suggests, that the improved performance associated with a palaeolithic lifestyle may also be linked to an increase in aerobic capacity (VO2max).27,28 To determine respiratory parameters (RER, VO2max, ventilatory threshold [VT], respiratory compensation point [RCP]) the BRUCE ramp protocol (Figure S1) was selected: Within the first 14 minutes and 20 seconds the grade of the treadmill is increased by 0.2% to 0.4% every 20 seconds. The subsequent grade increment is 0.5% every 40 seconds. The speed starts at 2.7 km per hour (1.7 mph) and is increased by 0.2 km per hour (0.1 mph) from 2 minutes 40 seconds to 14 minutes every 20 seconds. Subsequently speed increases every 40 seconds. 29 The actual ramp test was preceded by a 3-minute rest phase and a warming-up period including 3 minutes of very light constant load (1.7 mph) to ensure saturation of the tissue with carbon dioxide and consequently to exclude a misinterpretation of the VT. 30 VT is identified during incremental exercise where ventilation (VE) increases disproportionately relative to oxygen consumption (VO2), indicating a shift from aerobic to anaerobic metabolism. RCP is a later stage where ventilation rises significantly relative to carbon dioxide production (VCO2). Both VT and RCP are graphically determined using the V-slope method, which involves plotting VCO2 against VO2 and VE against VCO2, respectively. Disproportionate increases in these plots reveal the transition points for VT and RCP. VT and RCP were assessed by 3 independent, blinded reviewers. 31 In addition, VO2max was calculated from the highest 30-second VO2 average during the ramp test. 32 Another outcome variable was time to exhaustion (TTE) during the treadmill ramp test.
By using the following Equations (1) and (2) substrate oxidation rates were calculated assuming a negligible protein oxidation.33,34


For assessing RER and substrate oxidation rates, the area under the curve (AUC) was computed from the beginning of the test until the last minute completed by all participants before reaching exhaustion, using the trapezoidal method. Additionally, substrate oxidation rates were calculated only for exercise intensities where the RER values were below 1.00, as values above 1.00 can indicate hyperventilation and elevated blood lactate, which distort substrate utilization measurements. 35
To evaluate the prolonged endurance performance a fixed-time running time-trial exercise was performed under standardized conditions (16-26°C, 60%-80% relative humidity) and after on a 400-metre track a 5-minute warm-up. 36 The distance covered [km] within 60 minutes was recorded using a GPS device (Polar M200, Kempele, Finland).
During the intervention phase, general condition, gastrointestinal condition, and perceived effort (during training sessions) were assessed using a visual analogue scale (VAS). This validated instrument, previously used to evaluate these parameters in endurance athletes undergoing nutritional interventions and training, 22 measures conditions on a scale from 0 (‘optimal condition’) to 100 (‘worst condition’) without intermediate values. A reversed VAS scale was used for gastrointestinal condition, with lower values indicating better gastrointestinal comfort. This approach was selected to better reflect participant feedback and to align with the measurement of ‘general conditions’ and ‘perceived effort’. The VAS score is calculated by measuring the distance in millimetres between the ‘optimal condition’ endpoint and the mark made by the participant. In addition, the Gastrointestinal Quality of Life index (GLQI)- a questionnaire containing 36 questions and with a maximum score of 144 was used to measure the quality of life. A score below 112 indicates an impaired quality of life. 37
Nutritional guidelines
Participants adhered to their assigned dietary regimen (PD-G or MD-G) throughout the 6-week study period. The palaeolithic diet of the PD-G in this study focussed on consuming whole, unprocessed foods such as vegetables, fruits, meat, fish, eggs, nuts, and seeds, while excluding grains, dairy products (except ghee), and processed foods. Protein sources were unrestricted except for processed meats, and natural fats like ghee and oils were preferred over butter or margarine. Although ghee is a dairy product, it was permitted in the study because it is often considered a pure form of fat with minimal lactose and casein. Ghee was also allowed due to its positive benefits, including its high content of nutrients such as fat-soluble vitamins A, D, E, and K. 38 Vegetables, including sweet potatoes, and fruits without added sugars were encouraged, while legumes and sugared dried fruits were avoided. The general nutritional recommendations are outlined in Supplemental Table S1, while Table S2 provides example meals for the palaeolithic diet. Example meals included muesli made from nuts and seeds, and chilli con carne prepared with natural ingredients, all aligning with the diet’s emphasis on natural foods. Those in the MD-G group were instructed to maintain their usual diet without alterations. Both groups were instructed to complete a 3-day dietary record, which included 2 weekdays and 1 weekend day, at the start, midpoint (3 weeks), and end (6 weeks) of the intervention. These records were analysed using Nutriguide software (Nutri-Science GmbH, Pohlheim, Germany). Nutritional guidance and meal preparation instructions were provided by a certified dietitian, who was available for queries regarding the palaeolithic diet and for advice on food measurement using household items. To monitor adherence to the diet, participants were also asked to use diet tracking applications (eg, Food Database, MyFitnessPal) throughout the intervention.
Exercise protocol
The protocol was based on Sprint Interval Training (SIT) that uses the Wingate anaerobic test format as the exercise component, in an active population experienced in endurance exercises.39,40 The running sessions were performed on a 400 -metre-track 3 times a week for a duration of 6 weeks (in total 18 sessions). The supervised training began with a 5-minute warm up at 70% to 80% of maximal heart rate below the measured VT. 41 The programme included 30-seconds all-out sprints followed by a recovery phase of 4 minutes on the same level as the warm up. The number of repetitions was adjusted as follows: week 1 to 2: 4 repetitions, week 3 to 4: 5 repetitions, week 5 to 6: 6 repetitions. At the end a cool down was performed under the same conditions as the warm up and the recovery phases.
Statistical analysis
As this study was a pilot trial, clinical endpoints were treated equally. Statistical evaluation aimed to estimate an appropriate sample size and determine the primary outcome for a subsequent main randomized controlled trial (RCT) based on this study’s protocol.
All data are presented as mean ± standard deviation (SD). Statistical analyses were performed using SPSS Statistics (IBM SPSS Statistics for Windows, Version 25.0, Armonk, NY: IBM Corp.). Descriptive tests were conducted as 2-sided tests with a significance level (α-level) was set at 0.05 and a p-value less than 0.05 was considered to be significant.
Given the small sample size and unequal group sizes, baseline homogeneity between study groups was assessed using the Mann-Whitney U test. Mean differences between groups were also compared using the Mann-Whitney U test. Changes in endpoints within groups during the intervention were analysed with the Wilcoxon signed-rank test. Comparisons between dietary patterns and reference values from nutritional guidelines were performed using the 1-sample Wilcoxon signed-rank test. Effect sizes, calculated using Cohen’s d, were determined from the mean differences between groups at the study’s conclusion and from baseline to post-intervention within groups (small effect: 0.2 ⩽ d < 0.5, medium effect: 0.5 ⩽ d < 0.8, large effect: d ⩾ 0.8).
Results
Study population
Out of the 20 men who met the inclusion criteria and were assigned to the intervention groups (Figure 2), 14 participants successfully completed the trial and were included in the statistical analysis. Among these, 5 participants were from the PD-G group and 9 from the MD-G group. Matching was done at enrolment to ensure baseline similarity. However, 6 participants dropped out during the intervention, contributing only baseline data. Despite these dropouts, baseline characteristics remained comparable between groups, with no significant differences observed except for the participants’ age. The reasons for dropout were voluntary withdrawals occurring during the intervention prior to the final visit after 6 weeks. There were no reports of adverse events, and routine medical history did not indicate any abnormal findings.

Flow chart of subject recruitment, randomization, and follow up.
Table 1 summarizes the baseline data. The participants in the MD-G were significantly (P = .042) older (26 ± 5 years) than in the PD-G (21 ± 1 years) due to 1 outlier in the MD-G (37 years). The mean height was 1.79 ± 0.08 m for PD-G, and 1.78 ± 0.02 m for MD-G with no significant group differences (P = .606). At baseline, no significant differences between the study groups were identified for any of the efficacy outcomes. Additionally, the evaluation of the training protocols showed no significant differences (P = .797) between the PD-G (17 ± 1) and MD-G (17 ± 1) in respect to the number of completed training sessions.
Body composition, blood pressure and performance-related outcomes at baseline and following the nutritional concepts.
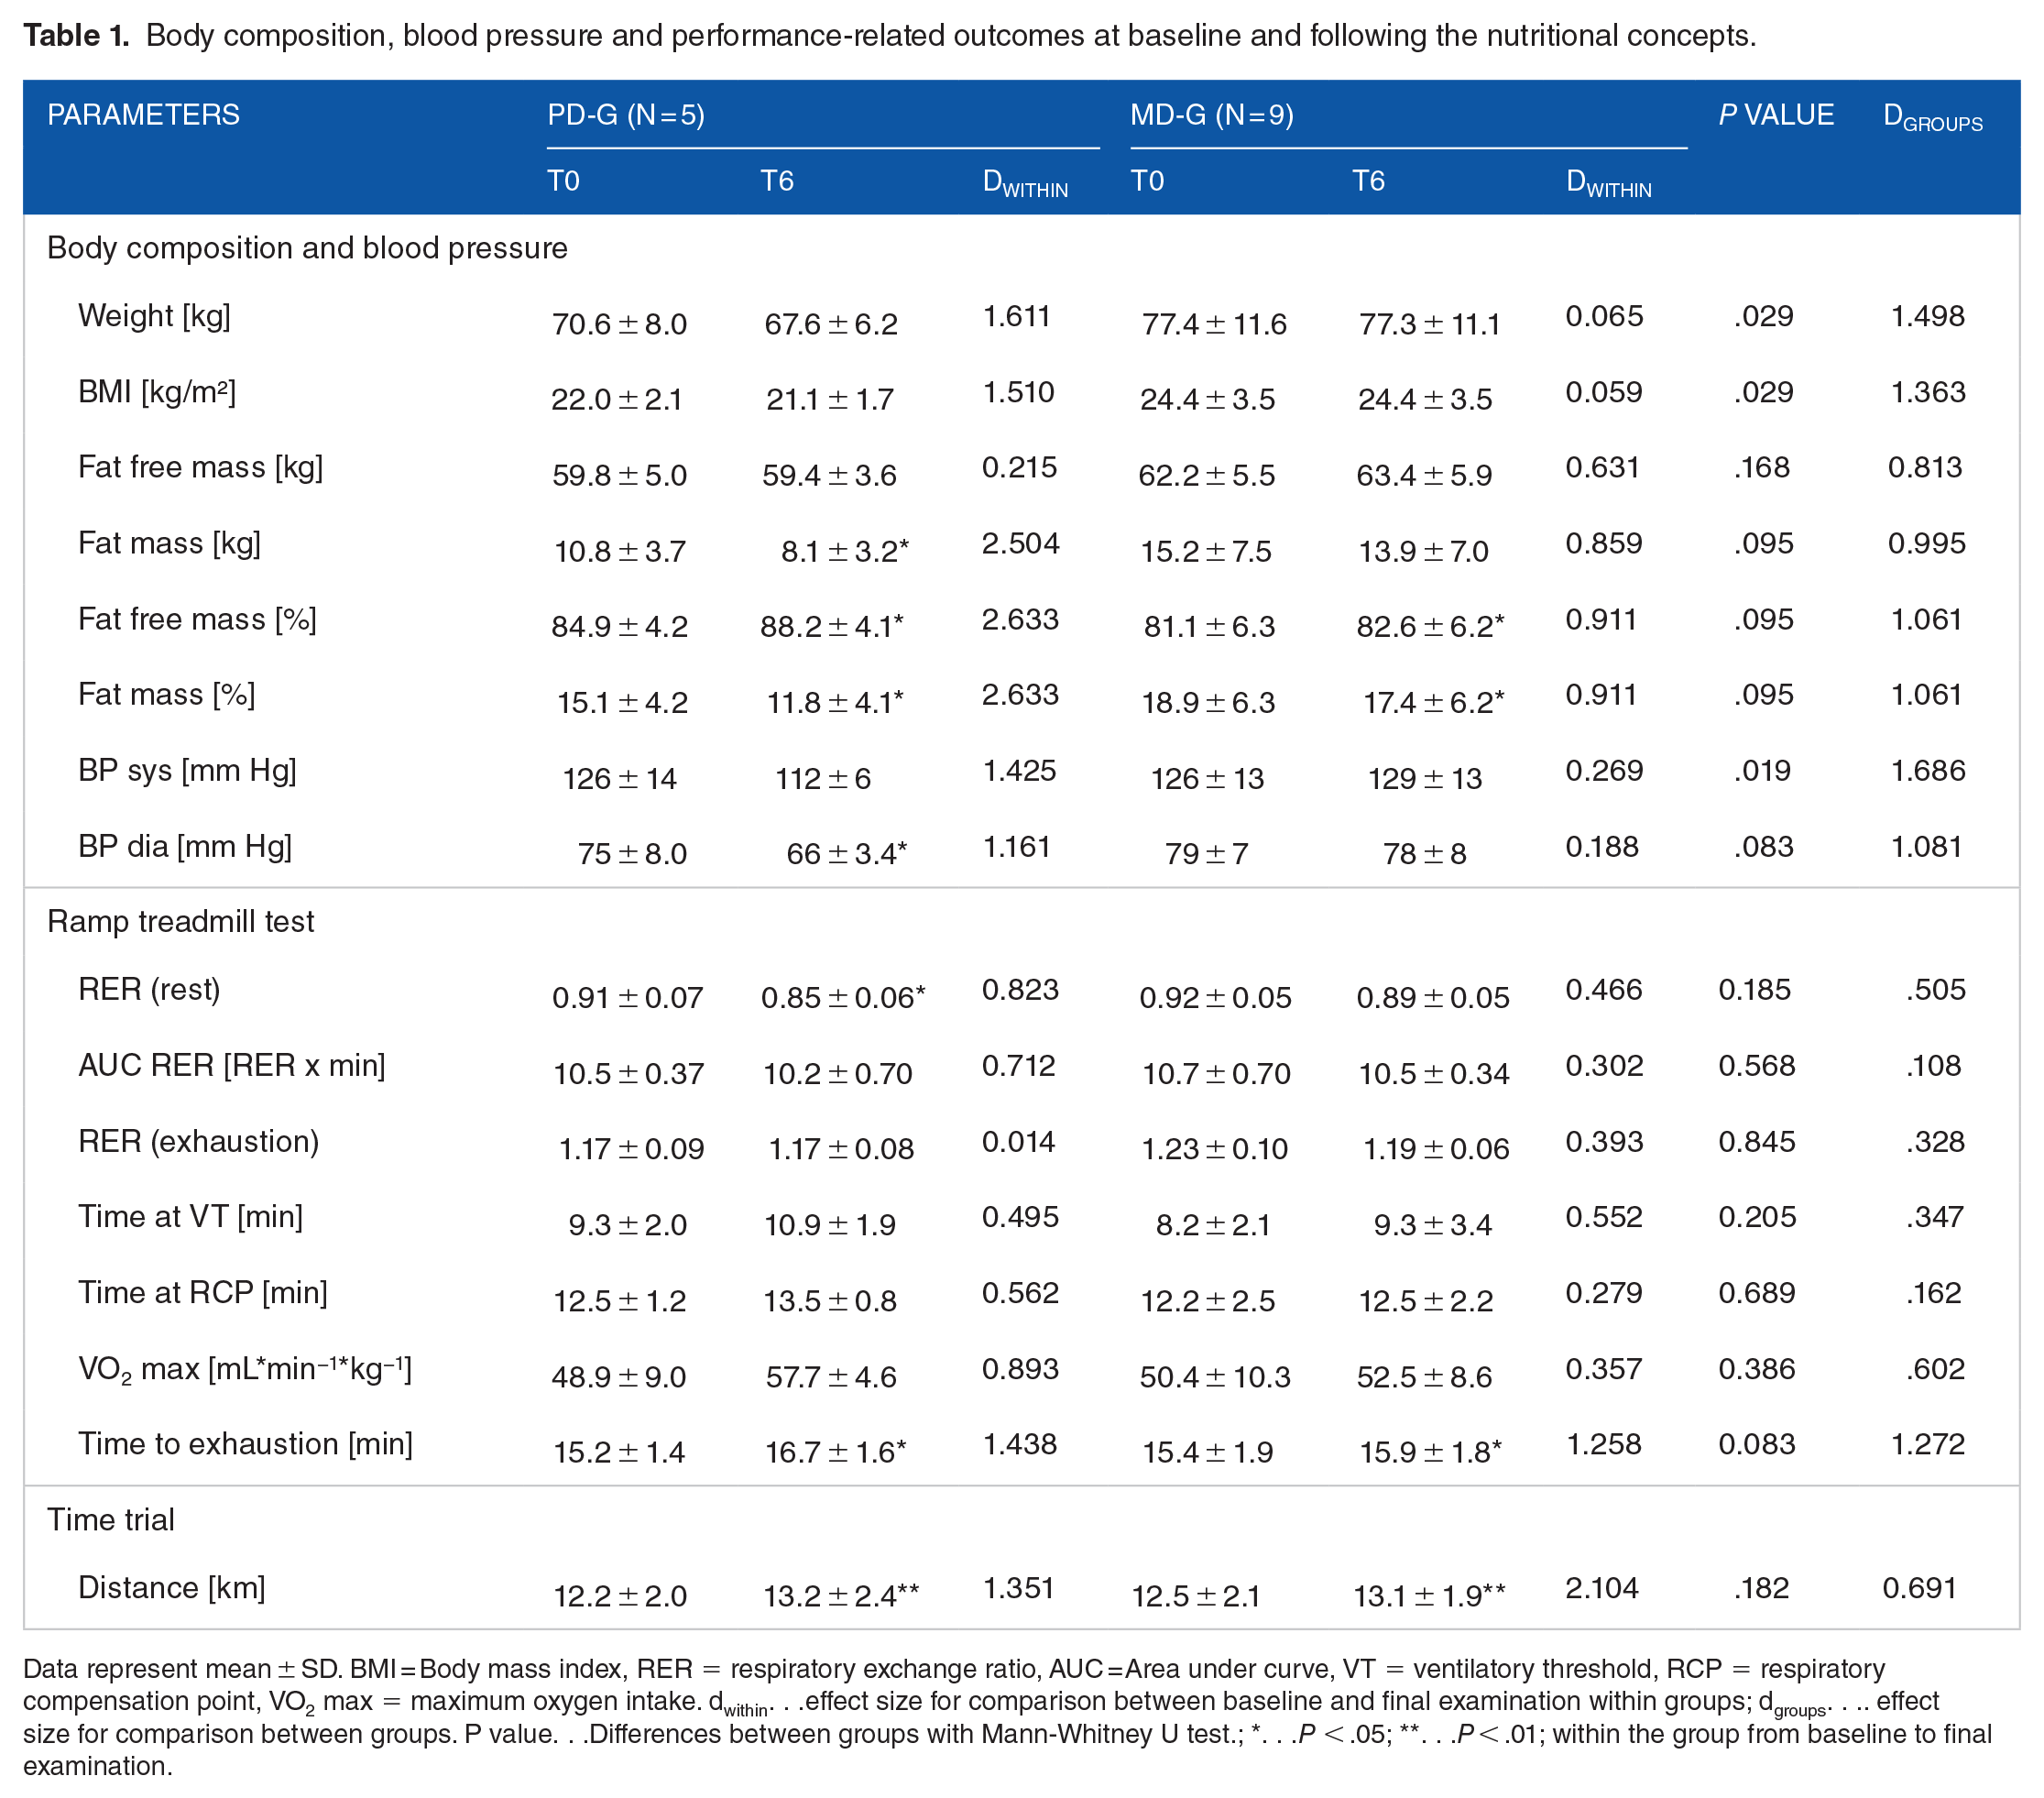
Data represent mean ± SD. BMI = Body mass index, RER = respiratory exchange ratio, AUC = Area under curve, VT = ventilatory threshold, RCP = respiratory compensation point, VO2 max = maximum oxygen intake. dwithin. . .effect size for comparison between baseline and final examination within groups; dgroups. . .. effect size for comparison between groups. P value. . .Differences between groups with Mann-Whitney U test.; *. . .P < .05; **. . .P < .01; within the group from baseline to final examination.
Nutritional protocol
Table S3 summarizes the nutritional pattern of the intervention groups at baseline and during the intervention. Except for the percentage fat and carbohydrate intake, groups did not differ significantly in terms of the mean energy and nutritional intake at baseline. Prior to the intervention both groups did not reach the recommendations for the fatty acid profile, potassium, iodine and vitamin D. In addition, the participants’ mean intake of calcium, riboflavin and vitamin B12 was below the recommended daily intake in the PD-G. The daily intake of carbohydrate was lower and of fat and salt was higher in the MD-G than recommended.
In both groups the mean energy intake decreased by ~100 kcal. Although following the palaeolithic diet led to a slightly decrease in carbohydrate intake potentially due to a higher fat intake, the participants’ mean consumption of fibres increased. During the intervention, the intake of mono- and polyunsaturated fatty acids increased and the intake of saturated fatty acids decreased on a non-statistical level in the PD-G leading to a fat intake according to the nutritional guidelines. Moreover, the intake of micronutrients improved except for calcium. The increase of potassium, vitamin A, D, E and B6 intake was significant. On average, the participants of the PD-G reached the nutritional recommendations except for calcium, iodine and vitamin D. In the MD-G, the consumption of Riboflavin, iron, vitamin E, C and D, folic acid and niacin decreased on a non-statistical level but was still in accordance with the recommended intake. No other changes in nutritional patterns were observed for the MD-G during the intervention. Consequently, the carbohydrate intake, the fatty acid profile, salt, potassium, calcium, iodine and vitamin D intake did not meet the criteria of the nutritional recommendations during the intervention. The intake of saturated fatty acids, salt, potassium, vitamin A, D, E and C differed significantly between groups.
Body composition and blood pressure
According to the large effect sizes, a decrease in weight and BMI was shown in the PD-G in contrast to the MD-G. The absolute fat mass decreased significantly, while the absolute fat free mass remained stable in the PD-G. As a consequence, the percentage of fat free mass increased and the percentage of fat mass decreased significantly in the PD-G. Smaller, but also meaningful changes in absolute fat mass, resulted, too, in significant changes of body composition in the MD-G. Differences between groups did not reach the level of significance except for the changes in weight (P = .029) and BMI (P = .029), but were meaningful as indicated by the high effect sizes for differences in weight (d = 1.498), BMI (d = 1.363) and body composition (d = 1.061; Table 1).
As shown in Table 1, the systolic and diastolic blood pressure decreased in the PD-G but remained unchanged in the MD-G. As a result, group differences were significant for the systolic blood pressure (P = .019; d = 1.686) and tended to be significant for the diastolic blood pressure (P = .083; d = 1.081).
Metabolic and performance-related outcomes
RER, carbohydrate and fat oxidation rates during the ramp incremental test are shown in Figure 3. Under resting conditions, RER values (P = .042; d = 0.823) and carbohydrate oxidation rates (P = .043; d = 0.700) decreased, while fat oxidation rates (P = .138; d = 0.823) exhibited a non-significant tendency to increase in the PD-G as indicated by medium to large effect sizes (Figure 3A-C). In contrast, changes in the MD-G (Figure 3D-F) were rather small (RER: P = .278; d = 0.466; carbohydrate oxidation: P = .374; d = 0.325; fat oxidation: P = .441; d = 0.351). However, group differences were not significant for changes in RER values (P = .185, d = 0.505), carbohydrate oxidation rates (P = .606; d = 0.269) and fat oxidation rates (P = .289; d = 0.632) at rest.

Metabolic outcomes at baseline (grey) and after 6 weeks of intervention (black). (A) Changes in respiratory exchange ratio (RER), (B) changes in CHO oxidation rates, (C) changes in fat oxidation rates in the PD-G; (D) Changes in respiratory exchange ratio (RER), (E) changes in CHO oxidation rates, (F) changes in fat oxidation rates in the MD-G. Data shown as mean ± SD. *P < .05 Wilcoxon signed-rank test for differences between baseline and after 6 weeks of intervention. CHO. . .Carbohydrate; End. . .Power output at exhaustion.
In the PD-G, RER values decreased with a tendency towards significance at 8 minutes (P = .080; d = 0.856) and 9 minutes (P = .059; d = 1.157) of the ramp incremental test. As a potential consequence, the AUC for RER values was slightly lower (P = .080, d = 0.712) after 6 weeks of intervention. Concomitantly, carbohydrate oxidation decreased (8 minutes: P = .043; d = 1.227; 9 minutes: P = .043; d = 1.519) and fat oxidation increased (8 minutes: P = .050; d = 0.686; 9 minutes: P = .043; d = 0.892), respectively. Throughout the test, changes were large (AUC: P = .080; d = 0.821) for total carbohydrate oxidation rates and medium (AUC: P = .225; d = 0.564) for fat oxidation rates, yet not statistically significant (Figure 3A-C). In the MD-G, no changes in RER values or substrate oxidation during the ramp incremental test have been identified (Figure 3D-F). Furthermore, no changes in RER values at exhaustion were measured in any of the groups (Figure 3A and D). At 9 minutes during the ramp incremental test, although group differences in fat oxidation rates were characterized by a medium effect size (d = 0.655), this difference was not statistically significant (P = .298). For all other timepoints of the ramp incremental test group differences for changes in RER and substrate oxidation were small (all P ⩾ .05; d < 0.5).
After 6 weeks, there was a mean change of VO2 max of 8.7 ± 10.4 mL*min−1*kg−1 (P = .080; d = 0.893) in the PD-G. The mean change of VO2 max in the MD-G was 3.1 ± 8.7 mL*kg-1*min-1 (P = .214; d = 0.357). Both the PD-G and MD-G groups exhibited comparable changes in time at VT, with similar mean differences observed (ΔPD-G = 1.7 ± 3.4 minutes; P = .345; d = 0.495 and ΔMD-G = 1.1 ± 2.2 minutes; P = .342; d = 0.552). RCP in the PD-G group, did not change in the PD-G (Δ = 1.0 ± 1.2 minute; P = .197; Cohen’s d = 0.562), and also remained unchanged in the MD-G group (Δ = 0.3 ± 1.6 minutes; P = .357; Cohen’s d = 0.279). Group differences did not achieve statistical significance for VO2max (P = .302; d = 0.602), time at VT (P = .545; d = 0.212) and RCP (P = .763; d = 0.444). After 6 weeks of intervention, TTE improved in both groups on a significant level (ΔPD-G = 1.4 ± 1.0 minute; P = .032; d = 1.438 and ΔMD-G = 0.6 ± 0.4 minute; P = .015; d = 1.258) with no significant group difference (P = .083; d = 1.272).
A significant improvement in distance covered during the 60-minute time trial was identified in both groups (ΔPD-G = 1.0 ± 0.7 km; P = .008; d = 1.351 and ΔMD-G = 0.6 ± 0.3 km; P = .001; d = 2.104). Group differences for improvements in the 60-minute time trial performance were medium (d = 0.691) but not significant (P = .182).
Visual analogue scale and GLQI
At baseline, the participants of the PD-G patients gave their quality of life a slightly lower overall score (126 ± 17) than the participants of the MD-G (134 ± 4) due to 1 participant of the PD-G with an impaired quality of life (GLQI-Score = 95). As a potential consequence, the GLQI-Score increased in the PD-G on a non-statistical level (P = .188) with a medium effect (d = 0.607). A comparison between groups (Figure 4A) showed no statistically significant differences but a large effect (d = 1.250).
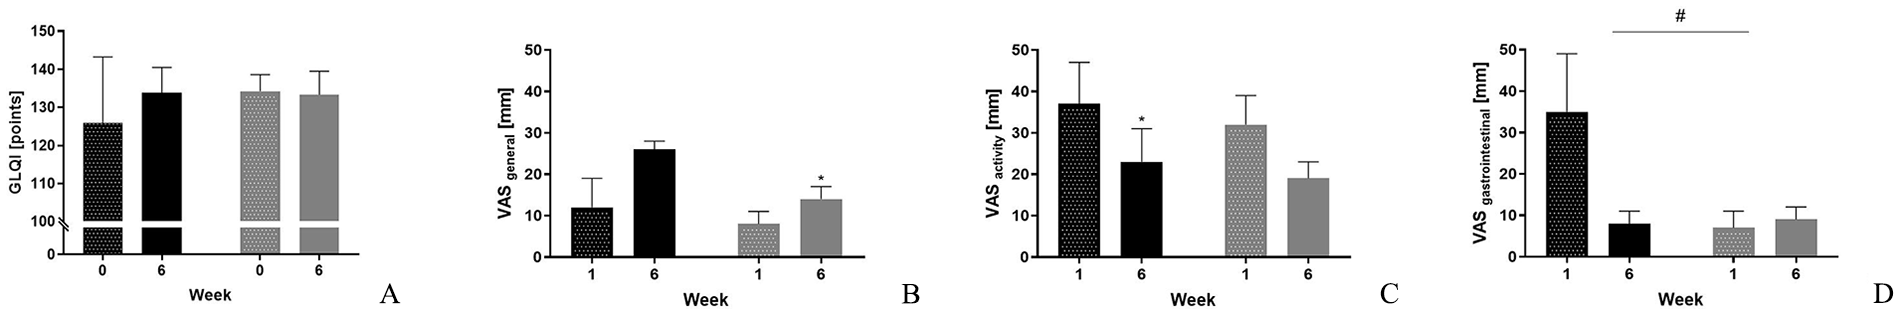
Changes in (A) Gastrointestinal Quality of Life index (GLQI) Score; Changes in visual analogue scale (VAS) Scores. (B) General, (C) during physical activity, (D) gastrointestinal comfort. Data shown as mean ± SD at week 1 and week 6. PD-G (black), MD-G (grey). *P < .05 Wilcoxon signed-rank test for changes between baseline and after 6 weeks of intervention; #P < .05 Mann-Whitney U test for differences between groups.
The evaluation of the VAS scores showed a statistically significant increase (deterioration) for general conditions (Figure 4B) from week 1 to week 6 in both groups (PD-G: d = 2.72 and MD-G: d = 2.00) with a significant result in the MD-G (P = .048). In addition, the VAS score in the subscale ‘sports’ decreased (improved) in both groups (PD-G: d = 1.55 and MD-G: d = 2.28) with a significant result in the PD-G (P = .026). Improvements for VAS scores in the subscale ‘gastrointestinal condition’ were large for the PD-G (d = 2.67). Comparisons between groups revealed a significant difference between the PD-G and MD-G in the subscale ‘gastrointestinal comfort’ (P = .003; d = 3.99).
Discussion
This study investigated the effects of a palaeolithic diet versus a mixed diet, each paired with SIT, on body composition, metabolic markers, and performance outcomes in young, physically active men. Given the current state of research, this is the first study focussing on how a palaeolithic diet influences performance-related metrics in an active population.
In the current study body composition improved significantly in both groups after 6 weeks of intervention as a potential result of the SIT. 42 The superior effects on fat mass in the group following a palaeolithic diet, can be considered as meaningful as indicated by the effect sizes. Moreover, significant and practically relevant improvements of the blood pressure were observed in the PD-G after 6 weeks of intervention. Similar results have been shown in a previous investigation with significantly greater reduction in body weight and systolic blood pressure in a group of physically active men and women, that consumed a palaeolithic diet for 3 weeks. 16
According to the effect sizes, following a palaeolithic diet for 6 weeks was associated with a tendency for a more pronounced decrease in RER values under resting conditions and during the ramp incremental running test. Concurrently, there was a tendency for decreased carbohydrate oxidation and a tendency for increased fat oxidation in the PD-G. However, these changes should be viewed cautiously given that they were not statistically significant and considering the potential for overestimation of effect sizes in this small sample. Similarly, the increase in TTE was greater in the PD-G relative to the control diet. In addition, the results of the time trial showed a slightly greater improvement in the group following the palaeolithic diet.
While the correct implementation of the palaeolithic diet may have contributed to the observed trends, including a potential shift towards increased fat oxidation, these effects did not reach statistical significance, making it difficult to definitively attribute them to the dietary intervention. Although the diet involved increased fibre intake and hence possibly greater consumption of low glycaemic carbohydrates, which are known to lower postprandial glucose and insulin levels, the evidence from our study does not robustly support a definitive improvement in fat metabolism. In various experimental settings it could be demonstrated that low glycaemic meals were associated with reduced lactate concentrations, decreased RER levels and increased use of free fatty acids indicating an improved fat metabolism at rest and during a subsequent exercise.43-46 In a recent study, it could be demonstrated, that a low glycaemic, carbohydrate-rich nutrition over a period of 4 weeks resulted in a significant improved fat metabolism measured by reduced lactate and glucose concentrations under resting and exercise conditions. 22 However, our findings did not achieve the level of statistical significance needed to draw similar conclusions.
The increased intake of low glycaemic carbohydrates might be an explanatory approach for the more pronounced effects on body composition in the PD-G, due to the more balanced fat and carbohydrate metabolism. According to meta-analyses from the Cochrane Database of Systematic Reviews, low glycaemic diets appear to facilitate weight loss and enhance metabolic health in obese and overweight adults, in contrast to control diets. 47 In addition, clinical trials in healthy adults or participants at a higher risk for metabolic and cardiovascular diseases have shown, that compared to an isocaloric control diet a palaeolithic diet over a period of 2 weeks to 6 months led to significantly reduction in body weight and promote the metabolic balance including increased insulin sensitivity, glycaemic control and an improved lipid profile.4-7,48 There is first evidence, that consuming a low glycaemic diet without energy restriction lead to an improved body composition in endurance athletes, too.22,49
Despite group differences in the mean energy intake, it is not assumed that the decrease in body weight and changes in body composition in the PD-G are attributed to the reduced caloric intake of 120 kcal during the intervention phase but rather the choice of foods. Despite a similar reduction in energy intake, the weight of the participants in the MD-G remained stable. Hall et al stated that a daily energy restriction of approximately 215 kcal (900 kJ) is required to achieve weight loss. 50 It is likely that there was some degree of underreporting, as the reported energy intake of approximately 2000 to 2100 kcal in the PD-G group before and during the intervention is about 700 kcal less than the energy needs for average-weight men in the same age range.51,52 However, the participants in this study were of normal weight and did not experience significant weight loss before the intervention. Additionally, no positive correlation was found between energy intake and the participants’ weight or body composition at any stage of the intervention. The evaluation of the nutritional protocols revealed an increased intake of vitamins and minerals except for calcium and iodine. It is criticized that the amount of calcium consumed in palaeolithic diet is lower than in the Western diet due to the avoidance of dairy products. However, according to former studies, the absorption and excretion of calcium is more important than the amount ingested. 53 In addition, alternative calcium sources such as nuts and green vegetables offer a better calcium-magnesium ratio. Moreover, by eliminating grain products, less phytic acid that impairs calcium uptake is absorbed. 54 Available evidence suggests that to limit sodium intake to approximately 2.0 g per day as recommended by the World Health Organization 55 may have a favourable effect on the blood pressure. 56 The majority of studies in participants adapted to a palaeolithic diet have reported reduction in systolic and diastolic blood pressure as a potential result of lower salt consumption.4-7,48 The iodine supply is also discussed critically in a palaeolithic diet. However, no evidence of a deficiency in thyroid hormones or a reduced thyroid function could be determined by a long-term application of a palaeolithic diet. 57 It has also to be mentioned, that the iodine intake in the PD-G was higher than in the MD-G in the current investigation. Furthermore, the intake of fatty acids improved in favour of mono- and polyunsaturated fatty acids. An increased intake of monounsaturated fatty acids and low levels of saturated fats are associated with improved postprandial glucose concentrations.58,59 Consequently, the shift in the fatty acid profile may contribute to the promotion of weight loss and metabolic balance.
The results on performance related outcomes were inconclusive. The positive impact on performance-related outcomes in the ramp incremental and time trial test was rather small. So far, first evidence suggests that a palaeolithic lifestyle characterized by endurance training improves performance related parameters as the VO2max. 3 The effects of a palaeolithic diet on performance in endurance athletes are scare. A first clinical study in patients subjects with type 2 diabetes mellitus showed, that the combination of a palaeolithic diet and exercise led to an improvement in VO2 max. However, the lack of a control group with exercise intervention only make it difficult to assess the single impact of the dietary intervention on the results. 28 Improvements in performance were mainly due to the training intervention. There is evidence, that SIT has a positive impact on the time trial performance.25,60,61 The current results of the VAS subscale sport indicate, that improvements in training sessions led to the observed improvement in the performance tests in both groups. Only the PD-G has shown an improvement in VAS scores of the subscale ‘gastrointestinal comfort’. Same findings were observed for the values of the GLQI. These changes are contributed to 1 case, that had an impaired quality of life according to a low baseline score of the GLQI. An explanation for an improved gastrointestinal condition with a palaeolithic diet is the avoidance of grains, whose components might lead to an increased gastrointestinal sensitivity even without the clinical manifestation of a coeliac disease.62,63 Especially during physical activity the gastrointestinal sensitivity can be increased. 64 In addition to cereals dairy products, which are excluded from a palaeolithic diet, can also lead to (stress-induced) intolerance reactions. 65 In people without clinical findings of a milk protein allergy or lactose intolerance, A1 casein could be the key factor for the ‘leaky gut syndrome’ during physical activity.66,67
However, changes in general VAS Scores and the high drop-out rate in the PD-G indicated that this diet might be less practical than other nutritional concepts in endurance sports. Reports from the participants’ compliance calendars of the PD-G revealed, that the eating plan was more expensive and time-consuming than the nutritional habits prior to the intervention. Despite a lower calcium intake in the PD-G, there was an overall improvement in micronutrient intake and quality of macronutrients, since the palaeolithic diet is characterized by the absence of unhealthy, processed foods. In addition, the avoidance of dairy and gluten can be of advantage for athletes with gastrointestinal complaints.
This study has several limitations. The small sample size and high dropout rate in the PD-G group warrant careful interpretation of the statistical results and effect sizes. Although matching was done at enrolment to ensure baseline similarity, dropout during the intervention phase limited the data available for post-intervention analysis. Participants who dropped out before the final visit contributed only baseline data. Despite balanced baseline characteristics and no significant differences between groups, the incomplete follow-up data may impact result interpretation. The lack of a control group without training is a serious limitation, as it prevents clear attribution of the observed effects to the diet alone. The palaeolithic diet, as a concept, is discussed critically due to its varying interpretations.1,2,10 Despite this, the modern palaeolithic diet typically emphasizes the consumption of vegetables, fruits, nuts, seeds, eggs, fish, and lean meats, while avoiding grains, dairy, salt, and refined sugars. Additionally, self-reported dietary data may be prone to underreporting, which could affect the accuracy of nutritional records. 68 Warmer temperatures near the upper limit of 24 to 26°C might challenge endurance performance, though temperatures within this range are manageable for field running tests. 69 Future research with a larger sample size, based on the current study’s findings, should incorporate a healthy mixed diet aligned with nutritional guidelines as a control and include groups without training to better evaluate the effects of the palaeolithic diet on body composition, metabolic health, and performance parameters in endurance athletes.
Conclusion
This pilot trial indicates, that while the combination of a SIT with a palaeolithic diet seems to be of advantage on fat mass and blood pressure, changes in substrate utilization under resting conditions and various exercise scenarios were only trends and did not reach statistical significance. Furthermore, the lack of a control group without training limits the ability to attribute these effects solely to the palaeolithic diet. The more pronounced improvements observed in the PD-G may be due to differences in individual responses or adaptations to the training protocol rather than the diet itself. Importantly, the MD-G also showed relevant changes, suggesting that the positive outcomes are likely influenced by the training effect rather than diet alone. Therefore, while the palaeolithic diet combined with SIT may offer some benefits, following a palaeolithic diet might be impractical and, therefore, not be universally recommended for healthy endurance athletes without food allergies or intolerances. Further research with larger sample sizes and control groups that isolate the effects of diet from training is necessary to draw more definitive conclusions about the impact of a palaeolithic diet on endurance performance in healthy athletes.
Supplemental Material
sj-docx-1-nmi-10.1177_11786388241299896 – Supplemental material for Effect of a Modern Palaeolithic Diet in Combination with a Sprint Interval Training on Metabolic and Performance-Related Parameters in Male Athletes: A Pilot Trial
Supplemental material, sj-docx-1-nmi-10.1177_11786388241299896 for Effect of a Modern Palaeolithic Diet in Combination with a Sprint Interval Training on Metabolic and Performance-Related Parameters in Male Athletes: A Pilot Trial by Denise Zdzieblik, Tobias Waldvogel, Anna Zierke, Albert Gollhofer and Daniel König in Nutrition and Metabolic Insights
Supplemental Material
sj-docx-2-nmi-10.1177_11786388241299896 – Supplemental material for Effect of a Modern Palaeolithic Diet in Combination with a Sprint Interval Training on Metabolic and Performance-Related Parameters in Male Athletes: A Pilot Trial
Supplemental material, sj-docx-2-nmi-10.1177_11786388241299896 for Effect of a Modern Palaeolithic Diet in Combination with a Sprint Interval Training on Metabolic and Performance-Related Parameters in Male Athletes: A Pilot Trial by Denise Zdzieblik, Tobias Waldvogel, Anna Zierke, Albert Gollhofer and Daniel König in Nutrition and Metabolic Insights
Supplemental Material
sj-docx-3-nmi-10.1177_11786388241299896 – Supplemental material for Effect of a Modern Palaeolithic Diet in Combination with a Sprint Interval Training on Metabolic and Performance-Related Parameters in Male Athletes: A Pilot Trial
Supplemental material, sj-docx-3-nmi-10.1177_11786388241299896 for Effect of a Modern Palaeolithic Diet in Combination with a Sprint Interval Training on Metabolic and Performance-Related Parameters in Male Athletes: A Pilot Trial by Denise Zdzieblik, Tobias Waldvogel, Anna Zierke, Albert Gollhofer and Daniel König in Nutrition and Metabolic Insights
Supplemental Material
sj-docx-4-nmi-10.1177_11786388241299896 – Supplemental material for Effect of a Modern Palaeolithic Diet in Combination with a Sprint Interval Training on Metabolic and Performance-Related Parameters in Male Athletes: A Pilot Trial
Supplemental material, sj-docx-4-nmi-10.1177_11786388241299896 for Effect of a Modern Palaeolithic Diet in Combination with a Sprint Interval Training on Metabolic and Performance-Related Parameters in Male Athletes: A Pilot Trial by Denise Zdzieblik, Tobias Waldvogel, Anna Zierke, Albert Gollhofer and Daniel König in Nutrition and Metabolic Insights
Footnotes
Acknowledgements
We would like to thank all the participants as well as the staff of the University of Freiburg who supported us with the examination.
Funding:
The author(s) received no financial support for the research, authorship, and/or publication of this article.
Declaration Of Conflicting Interests:
The author(s) declared the following potential conflicts of interest with respect to the research, authorship, and/or publication of this article: The authors declare that the research was conducted in the absence of any commercial or financial relationships that could be construed as a potential conflict of interest.
Author’s Note
After the study was finished DZ started as researcher in the Collagen Research Institute, Kiel.
Author Contributions
DZ, TW, AZ, AG, and DK designed the study. DZ, TW, AZ, and DK were responsible for data acquisition and performed the analysis. All authors read and approved the final version of the manuscript.
Ethics Statement
The study was conducted according to the guidelines of the Declaration of Helsinki, and approved by the independent Ethics Committee of the University of Freiburg (protocol code: 208-18 and date of approval: 2019/28/05). The study was registered at the German Clinical Trials Register (DRKS00025708).
Supplemental Material
Supplemental material for this article is available online.
References
Supplementary Material
Please find the following supplemental material available below.
For Open Access articles published under a Creative Commons License, all supplemental material carries the same license as the article it is associated with.
For non-Open Access articles published, all supplemental material carries a non-exclusive license, and permission requests for re-use of supplemental material or any part of supplemental material shall be sent directly to the copyright owner as specified in the copyright notice associated with the article.