
Abstract
Background:
Various studies have shown an inverse relationship between the quality of protein intake based on essential amino acids (EAAs) with obesity and its complications. We assumed that increasing EAAs-based protein intake quality improves glycemic and metabolic markers and anthropometric measurements in obese and overweight people.
Methods:
This cross-sectional study included 180 obese and overweight participants aged 18 to 35. Dietary information was obtained using an 80-item food frequency questionnaire. The total intake of EAAs was calculated using the United States department of agriculture (USDA) database. Quality protein was defined as the ratio of EAAs (gr) to total dietary protein (gr). Sociodemographic status, physical activity (PA), and anthropometric characteristics were evaluated using a valid and reliable method. Analysis of covariance (ANCOVA) tests adjusted for sex, PA, age, energy, and body mass index (BMI) were used to measure this association.
Results:
Protein quality intake was highest among the group with the lowest weight, body mass index (BMI), waist circumference (WC), hip circumference (HC), waist-to-hip ratio (WHR), and fat mass (FM); and on the other hand, the fat-free mass (FFM) has increased; also Increasing the quality of protein intake improved the lipid profile and some glycemic indices and insulin sensitivity, although this association was not significant.
Conclusions:
Increasing the quality of protein intake significantly improved anthropometric measurements, and also improved some glycemic and metabolic indices although, their relationship was not significant.
Keywords
Background
Obesity relates to metabolic and glycemic disorders in several ways, including hypertension and irregularities in fat and blood sugar.1-5 There is some evidence that the quality of protein intake is inversely related to body mass index.6,7 The presence of essential amino acids (EAAs) is a significant determinant of dietary protein quality. 8 Protein quality is measured by the proportion of EAAs (g) to total dietary protein (g). 9 Histidine, valine, isoleucine, leucine, tryptophan, phenylalanine, lysine, methionine, and tyrosine are examples of EAAs that the body generates in limited quantities and must be obtained from diet. 10 Long-term, adequate consumption of EAAs through diet reduces the risk of becoming overweight by influencing the body’s metabolism. 11 Sufficient and high-quality protein consumption, combined with regular physical activity (PA), enhances physical performance by increasing fat-free mass (FFM) and decreasing fat mass (FM), lowers fatigue by conserving glycogen stores, and improves health. 12
Studies indicate that lifestyle modifications such as weight loss, increasing PA, and dietary changes can enhance glucose tolerance and improve lipid profile.13-18 Adequate consumption of EAAs is required for normal lipid and glucose metabolism.16,19,20 Several studies have demonstrated a negative association between the quality of protein intake based on EAAs content and metabolic and glycemic indicators.16,17,21 However, studies are limited and conflicting regarding the relationship between dietary protein quality with glycemic and metabolic factors.16,22
Adults’ nutritional status is evaluated in several ways, the most prominent of which are anthropometric measurements. Obesity causes shifts in body composition that affect energy expenditure, diet, FFM, and FM. 23 More protein in the diet has been shown to accelerate weight loss and improve body composition through several mechanisms, including increased FFM, the thermogenic effect of meals, and satiety.24-27 In a prospective 5-year study, waist circumference (WC) changes were found to be inversely associated with dietary protein intake. 27 However, no study has examined the correlation between protein intake quality based on the amount of EAAs with metabolic and glycemic markers and anthropometric indicators in overweight and obese adults.
Methods
Participant population
This cross-sectional study included 180 participants in Tabriz, Iran (n = 102 men; n = 78 women; 26.5 ± 4 years; 171 ± 10 cm; 83 ± 18.5 kg; 28.3 ± 6 BMI) who were selected using the combination of 2 projects and by telephone. The number of participants was determined using Cochran’s formula. Inclusion criteria were consent to participate in the study, a BMI greater than 25 kg/cm2, and an age between 18 and 35. The exclusion criteria included menopause, lactation, pregnancy, bariatric surgery, alcohol, drug use, weight-bearing medications, and protein-rich nutritional supplements. All participants completed and signed a written consent. Tabriz University of Medical Sciences ethics committee approved the study’s proposal.
Dietary amino acid and total EAAs calculation
Dietary intake was calculated using an 80-item food intake frequency questionnaire (FFQ). 28 The software Nutritionist 4 (version 7.0; N Squared Computing, Salem, OR) was used to compute the calories and nutrients in an Iranian diet. Using the USDA database, the EAA profile of each food was established. By inputting the name of each product on the USDA website, 29 the number of EAAs per 100 g of each food was calculated, divided by 100, and then multiplied by the gram of the same food. Finally, the quality of the ingested protein was calculated by dividing the grams of EAAs in the total ingested food by the grams of protein.
Sociodemographic, anthropometric, and physical activity measurements
An expert dietician gathered social and demographic data (age, sex, and education level), as well as anthropometric measurements, such as body mass index (BMI), height, weight, waist circumference (WC), hip circumference (HC), and waist-to-hip ratio (WHR). A Seca 753E electronic scale was used to measure the weight of individuals with minimal error (accurate to 0.1 kg). The BMI of the subjects was calculated using the formula (kg/m2) and their standing heights (accurate to 0.1 cm) without shoes measured. The WHR was calculated by dividing the minimum WC by the highest HC of all subjects. After 12 hours of fasting, the participants’ body composition was measured using a bioelectrical impedance analysis (BIA) instrument (Tanita, BC-418 MA, Tokyo, Japan) while wearing light clothing. The short form of the International Physical Activity Questionnaire (IPAQ), a questionnaire consisting of 7 easy items, was used to assess the international PA level. 30 (Validity and reliability were already measured).
Biochemical measurements
All participants were required to fast for 8 hours before having blood collected from their brachial veins. We prepared serum samples for laboratory analysis by freezing them at −86°C. An Enzyme-Linked Immunosorbent Assay (ELISA) kit was used to test fasting blood glucose (FBS), fasting insulin (FI), total cholesterol (TC), triglycerides (TG), and high-density lipoprotein (HDL) following the manufacturer’s instructions. Low-density lipoprotein (LDL) concentration was calculated using the Fried-Wald equation. 31 The homeostatic model of insulin resistance (HOMA-IR) was assessed using the formula fasting insulin (μIU/ml), fasting blood glucose (mmol/L)/22.5, and quantitative insulin sensitivity index (QUICKI) as 1/[log fasting insulin (mU/L) + log (fasting plasma glucose × 18.0182) (mmol/L)].32,33
Analyzing data statistically
SPSS software (version 21.0; SPSS Inc, Chicago, IL) was used to analyze the collected data. P-values less than .05 were considered significant. Quantitative data were represented as mean standard deviation (SD), and qualitative data were represented as numbers and percentages (%). The Kolmogorov-Smirnov test and histogram curve were used to ensure the normality of quantitative variables. Using analysis of variance (ANOVA), numerical variables were compared with protein quality (Grams of EAAs/grams of total protein intake per day). After adjusting confounders (age, sex, energy, BMI, PA), biochemical and nutritional variables were compared using analysis of covariance (ANCOVA).
Results
The initial population of 380 potential participants, 260 met the study’s inclusion criteria. However, 80 participants were left out due to missing or inadequate information on biochemical markers, body composition, or dietary data. As a result, 180 subjects participated in the research (Figure 1). Table 1 displays participants’ basic characteristics and anthropometric measurements in the various tertiles of quality protein intake. A significant relationship was found between protein intake quality and all anthropometric indicators. The group with the highest protein quality intake was in the lowest range regarding weight, BMI, WC, HC, WHR, and FM (%). Table 2 displays the individuals’ energy-adjusted food consumption by tertiles of dietary protein quality. After controlling for confounding variables, a significant association was discovered between the quality of protein intake and certain micronutrients such as magnesium, zinc, potassium, selenium, fluoride, vitamin C, vitamin B6, biotin, folate, and vitamin K. The biochemical parameters of the participants in the study are shown in different tertiles of dietary protein quality in Table 3. Among the biochemical variables, average insulin, TG, and HOMA-IR showed a decreasing trend with the increase in protein intake quality. In addition, there was a positive association between protein quality and HDL, which was not statistically significant but clinically meaningful. However, in general, considering the confounding variables (eg, age, gender, BMI, PA, and energy intake), no significant relationship was found between the quality of protein intake and any of the biochemical indicators of the present study. Increasing protein intake quality and PA improved some anthropometric and body composition indicators (Figures 2 and 3 and Supplemental Figure 1).

Study flowchart.
General characteristics and anthropometric measurements of study participants across tertiles of quality protein.
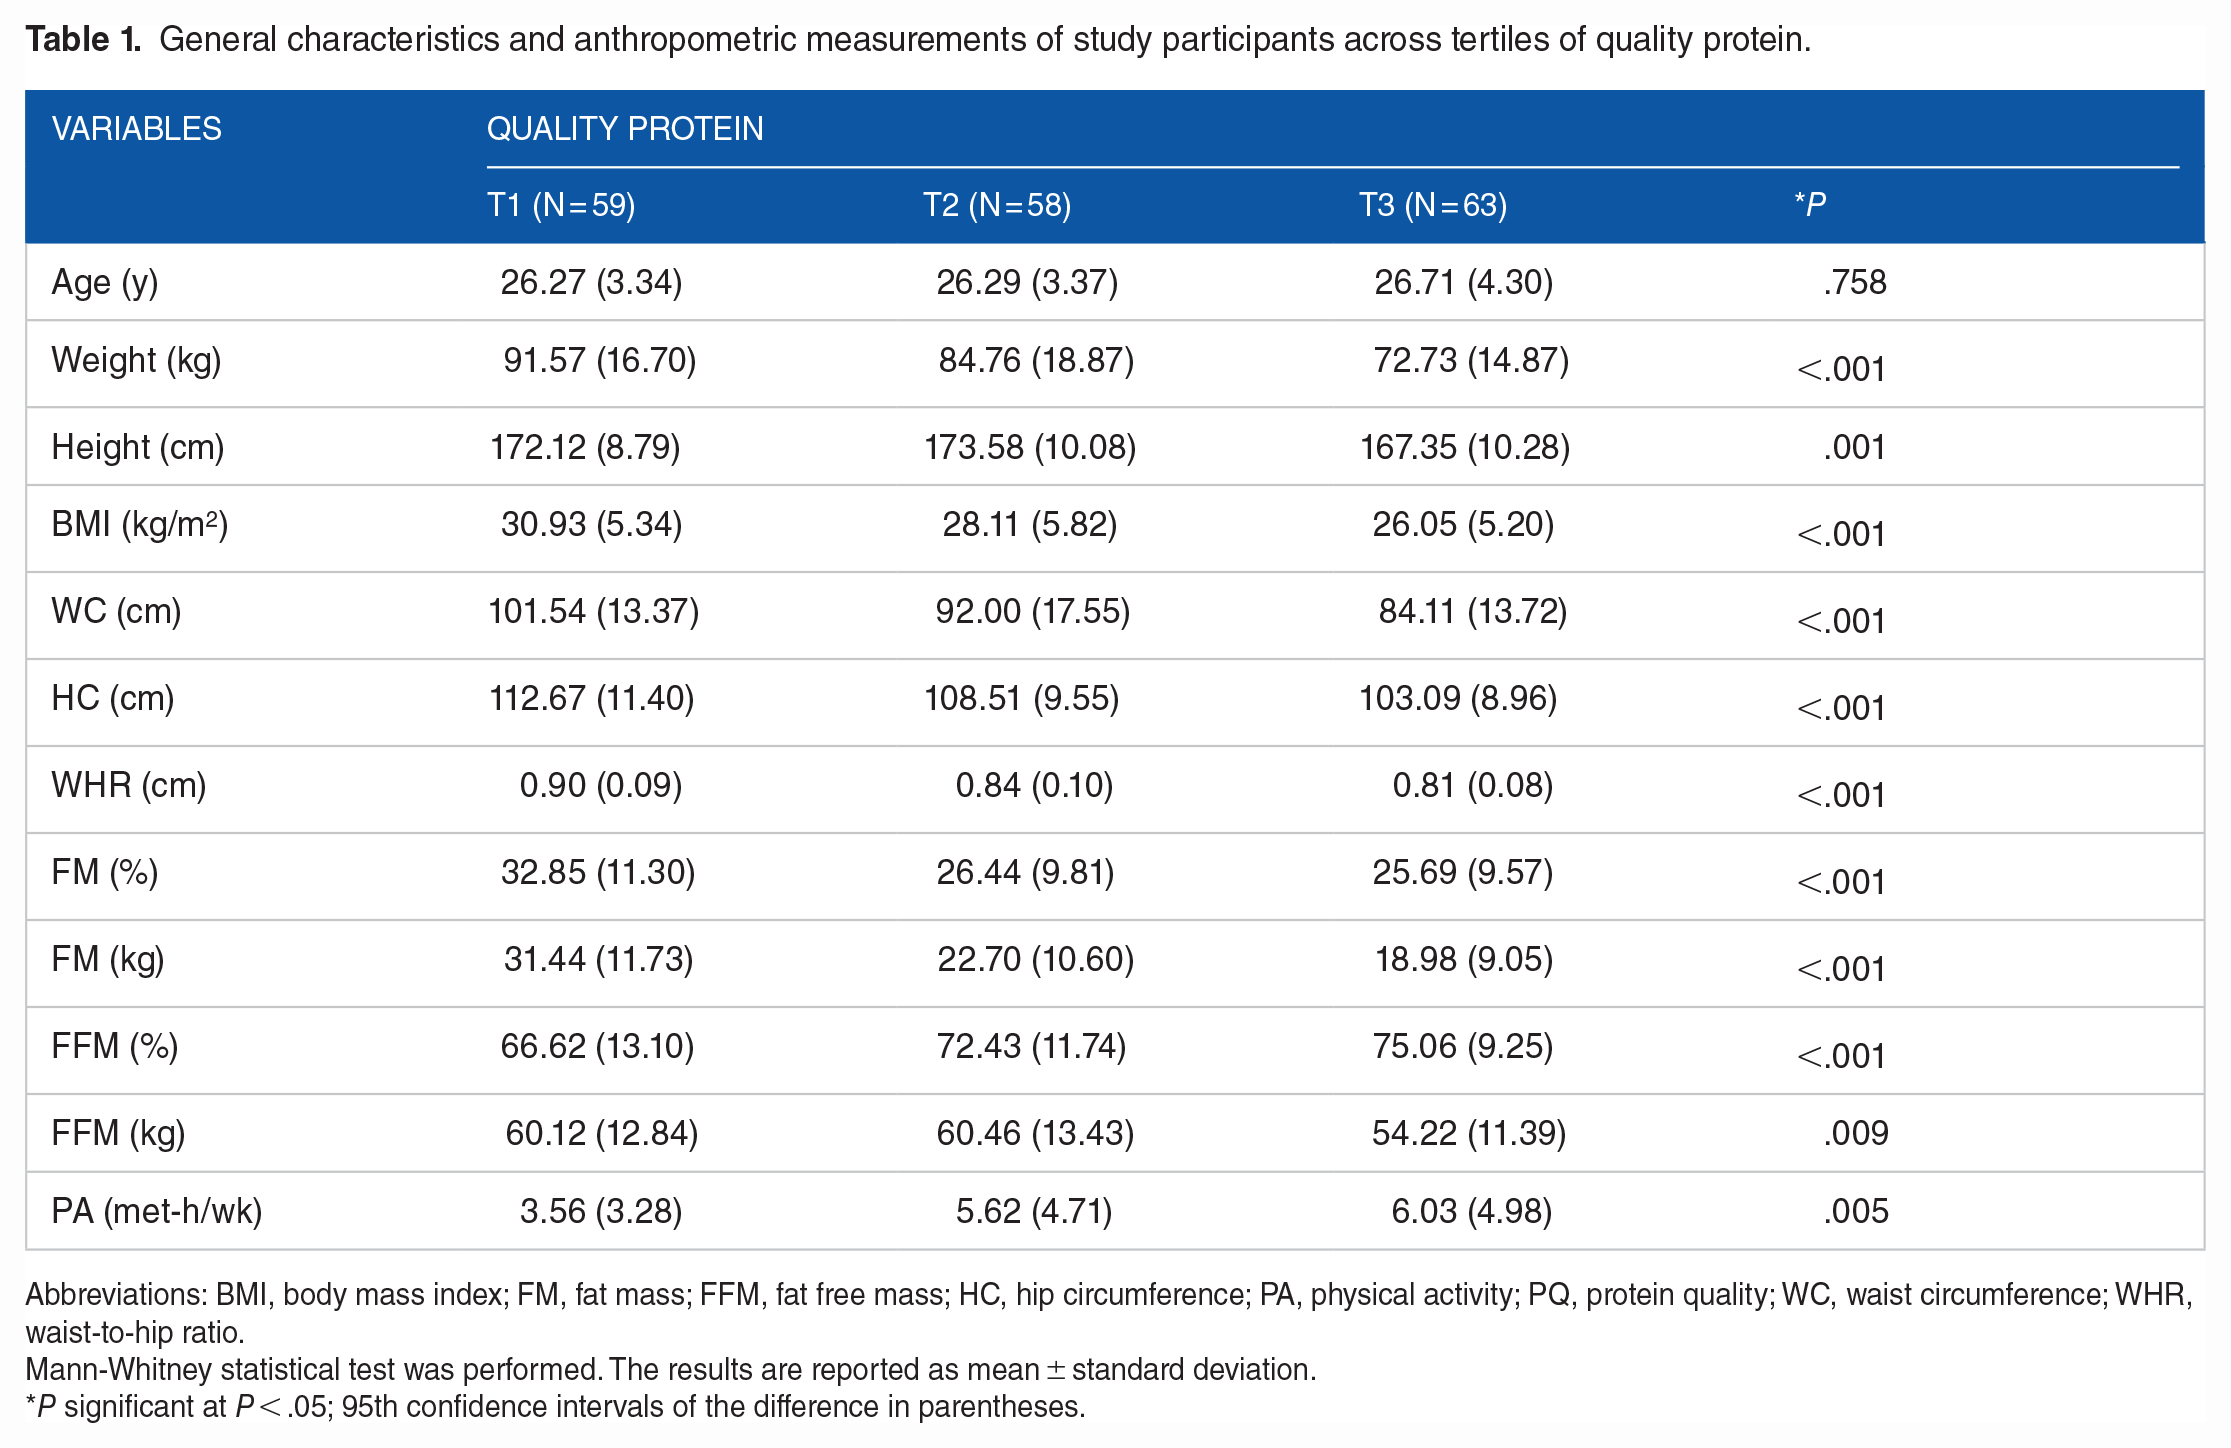
Abbreviations: BMI, body mass index; FM, fat mass; FFM, fat free mass; HC, hip circumference; PA, physical activity; PQ, protein quality; WC, waist circumference; WHR, waist-to-hip ratio.
Mann-Whitney statistical test was performed. The results are reported as mean ± standard deviation.
P significant at P < .05; 95th confidence intervals of the difference in parentheses.
Energy adjusted dietary intakes of study participants across tertiles of quality protein.

Abbreviations: CHO, carbohydrate; MUFA, monounsaturated fatty acids; PUFA, poly unsaturated fatty acids; SFA, saturated fatty acids.
P significant at P < .05; 95th confidence intervals of the difference in parentheses.
P-values are obtained from ANCOVA model after adjustment for the confounding effects of age, sex, BMI and physical activity, calorie intake.
Biochemical parameters of study participants across tertiles of quality protein.

Abbreviations: FBS, fasting blood sugar; HDL, high-density lipoprotein; HOMA-IR, homeostatic model assessment for insulin resistance; LDL, low-density lipoprotein; QUICKI, quantitative insulin sensitivity check index; TC, total cholesterol; TG, triglycerides.
The results are reported as mean ± standard deviation.
P significant at P < .05; 95th confidence intervals of the difference in parentheses.
P values are obtained from ANCOVA model after adjustment for the confounding effects of age, sex, BMI and physical activity, calorie intake.

The interaction between protein quality intake and physical activity on Anthropometric measurements. Abbreviations: *BMI, body mass index; HC, hip circumference; WC, waist circumference; WHR, waist-to-hip ratio.
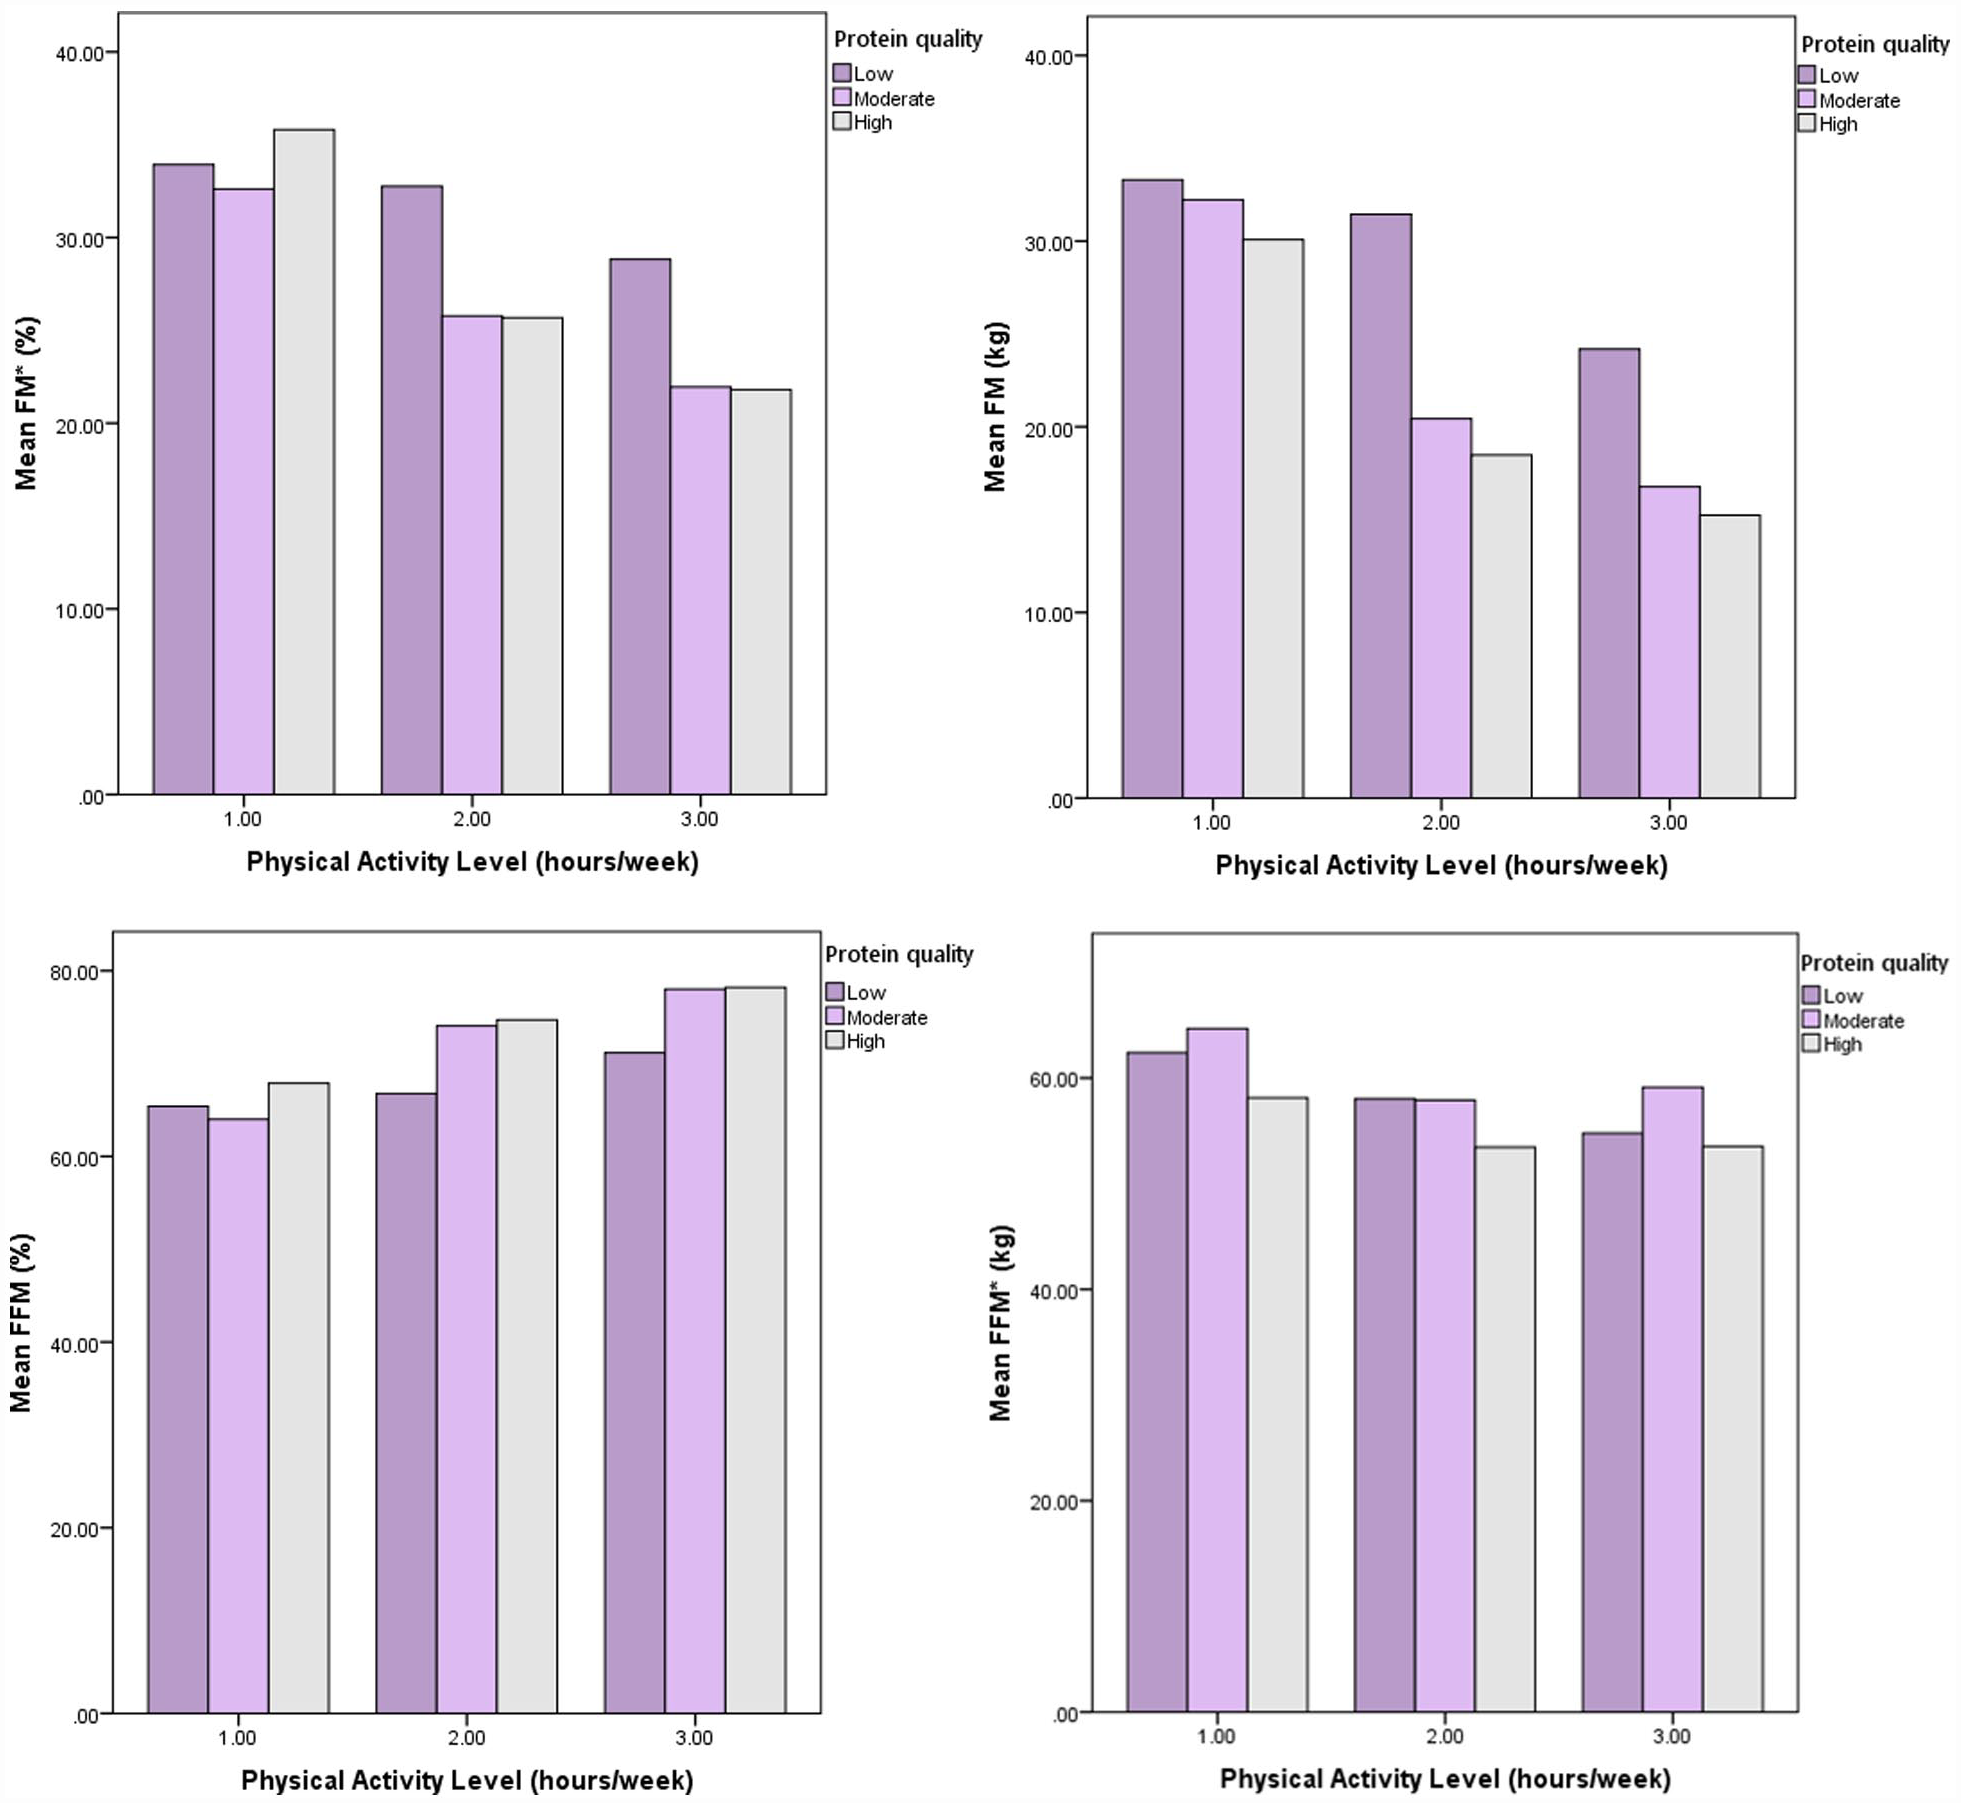
The interaction between protein quality intake and physical activity on body composition measurements. Abbreviations: *FM, fat mass; FFM, fat free mass.
Discussion
On a global scale, few studies have examined the association between the quality of protein intake (ratio of grams of amino acids to grams of total protein per day) and anthropometric indicators and glycemic and metabolic variables in obese and overweight individuals. However, no such study has been conducted in Iran. Our study’s results showed that higher protein quality enhanced anthropometric indicators but had no significant influence on biochemical parameters; however, it did yield interesting clinical results. Consumption of EAAs influences metabolism. Numerous specific findings are presented in this study because of the correlation between BMI and metabolic alterations. 34 It has been found that a high intake of EAAs has no effect on fasting blood sugar levels (FBS) but can boost insulin sensitivity. Higher EAA intake was related to improved anthropometric metrics, but this appears to have contradictory effects on lipid profile.7,16,34,35 The study by Im et al conducted in Korea on 25787 subjects showed that increased intake of EAAs significantly lowered serum TG. Although the trend in FBS, BMI, and WC decreased with increasing EAAs intake, it was not significant. 16 The study by Yu et al 34 on Chinese children and adolescents showed a positive correlation between dietary EAAs intake with LDL and HDL but no correlation with FBS. In the study by Loenneke et al, 36 the association between increasing the quality of protein consumption based on EAAs and abdominal fat was inverse. A diet rich in EAAs may improve glycemic and anthropometric indices by decreasing lipogenic factors, enhancing insulin sensitivity, and boosting glycogenesis.7,16,34,35 Satiety is affected by increases in glucagon-like peptide-1 (GLP-1) levels, thermogenesis, and protein metabolism. However, this may vary depending on the source of the protein. The amino acid composition of the protein may also be a major factor in the metabolic efficiency of protein oxidation, as there are significant differences in the efficiency with which amino acids are oxidized owing to the vast array of carbon chains and cofactors formed during amino acid breakdown. 37 EAAs are crucial in protein synthesis, muscle regeneration, 38 control of blood glucose levels, and lipid metabolism. 39 Several amino acid sensors, including general control nonderepressible 2 (GCN2), activating transcription factor 4 (ATF4), Mammalian Target of Rapamycin (mTOR), and AMP-activated protein kinase (AMPK) allow cells to respond appropriately to variations in amino acid levels. These receptors play crucial roles in metabolic balance, glucose metabolism, and energy homeostasis. 40 First, GCN2 is recognized as an amino acid deficit sensor; by phosphorylating eukaryotic initiation factor 2-α (eIF2α), this sensor promotes the translation of proteins involved in amino acid biosynthesis and transport. 41 mTORC1 regulates food intake and is specifically activated by leucine.42,43 Furthermore, ATF4 is essential for regulating the high proliferation during fetal liver hematopoiesis, 44 organ memory, 45 endoplasmic reticulum stress,46,47 glucose metabolism, energy homeostasis, 48 and osteoblast differentiation. 49 In addition to regulating energy balance, AMPK modulates insulin sensitivity by direct phosphorylation of the insulin receptor substrate1 or tuberous sclerosis complex 2, an upstream inhibitor of mTOR regulated by prolonged metabolic stress.50-53 No obvious mechanism for detecting amino acid levels and regulating metabolic homeostasis, including lipid, glucose, and energy homeostasis, has been established as of yet; nonetheless, amino acid sensors are involved in metabolic disorders. 40 This study is the first to examine the effect of EAAs and PA co-ingestion on glycemic and metabolic markers and anthropometric measurements in obese and overweight adults in Iran. Regular PA combined with EAAs intake improves insulin sensitivity via the above processes and aids muscle building. An increase in myofibrillar protein accumulation may occur in the first phase after exercise and may be enhanced by EAAs.12,54,55
Conclusions
In the current cross-sectional study conducted on obese and overweight Iranian youth, there was a significant correlation between the quality of protein intake and anthropometric measurements. On the other hand, there was no statistically significant connection between biochemical indicators and an increase in the quality of protein intake based on EAAs. Future studies with larger samples and various demographics are required to further study and characterize the potential causes for this association.
Supplemental Material
sj-docx-1-nmi-10.1177_11786388231181038 – Supplemental material for Protein Quality, Glycemic and Metabolic Indices and Anthropometric Features Among Overweight and Obese Adults
Supplemental material, sj-docx-1-nmi-10.1177_11786388231181038 for Protein Quality, Glycemic and Metabolic Indices and Anthropometric Features Among Overweight and Obese Adults by Ensiye Soleimani and Mahdieh Abbasalizad Farhangi in Nutrition and Metabolic Insights
Footnotes
Acknowledgements
We thank all of the study participants. We also are thankful to the Research Undersecretary of Tabriz University of Medical Sciences for their financial support (GrantNo: 69507; 70010).
Funding:
The author(s) disclosed receipt of the following financial support for the research, authorship, and/or publication of this article: The work has been granted by the Research Undersecretary of Tabriz University of Medical Sciences. The present study has been financially supported by a grant from Tabriz University of Medical Sciences. (Code: IR.TBZMED.REC.1401.033; IR.TBZMED.REC.1401.444). The funders had no role in hypothesis generation, recruiting, and designing the study. Their role was only financial support.
Declaration of conflicting interests:
The author(s) declared no potential conflicts of interest with respect to the research, authorship, and/or publication of this article.
Author Contributions
All authors approved the final version of the article. MAF designed the project and supervised it. ES also contributed to statistical analysis and manuscript writing. ES was involved in hypothesis generation and statistical approach. Both authors were involved in manuscript writing.
Availability of Data and Material (ADM)
The datasets used and/or analyzed during the current study are available from the corresponding author upon reasonable request.
Ethics Approval and Consent to Participate
The present study project is a combination of two research projects. This study protocol has been approved by the ethics committee of the Tabriz University of Medical Sciences (Code: IR.TBZMED.REC.1401.033; Code:IR.TBZMED.REC.1401.444 ). Written informed consent was obtained from all the participants before participation in the study. All procedures utilized in this study were in accordance with the principles outlined in the Declaration of Helsinki.
Consent for Publication
Not applicable.
Supplemental Material
Supplemental material for this article is available online.
References
Supplementary Material
Please find the following supplemental material available below.
For Open Access articles published under a Creative Commons License, all supplemental material carries the same license as the article it is associated with.
For non-Open Access articles published, all supplemental material carries a non-exclusive license, and permission requests for re-use of supplemental material or any part of supplemental material shall be sent directly to the copyright owner as specified in the copyright notice associated with the article.