
Abstract
Background:
Males are more likely than females to suffer from cardiovascular disease (CVD). So, sex hormones may modify these variations and affect the lipid profile. We examined the relationship between sex hormone-binding globulin (SHBG) and CVD risk factors among young males in this study.
Methods:
Using a cross-sectional design, we measured total testosterone, SHBG, lipids, glucose, insulin, antioxidant parameters, and anthropometric factors in 48 young males in the age range of 18 to 40 years. Atherogenic indices of plasma were calculated. In this study, a partial correlation analysis was carried out to assess the relationship between SHBG and other variables after adjustment for confounders.
Results:
According to the results of multivariable analyses adjusted for age and energy, SHBG had a negative correlation with total cholesterol (r = −.454, P =.010), low-density lipoprotein cholesterol (r = −.496, P =.005), quantitative insulin-sensitivity check index, and positive correlation with high-density lipoprotein cholesterol (r = .463, P =.009). No significant correlation was observed between SHBG and triglycerides (P >.05). Several atherogenic indices of plasma have a negative correlation with SHBG levels. These include Atherogenic Index of Plasma (r = −.474, P = .006), Castelli Risk Index (CRI)1 (r = −.581, P < .001), CRI2 (r = −.564, P = .001), and Atherogenic Coefficient (r = −.581, P < .001).
Conclusion:
Among young men, high plasma SHBG was associated with reduced CVD risk factors, modified lipid profile and atherogenic ratios, and better glycemic markers. Therefore, reduced SHBG concentrations could be a prognostic marker of CVD among young sedentary males.
Keywords
Introduction
Mortality is widespread in people with cardiovascular disease (CVD). 1 The term “CVD” refers to a number of disorders, including coronary artery disease, ischemic stroke, and dyslipidemia. 2 The fasting lipid profile, which includes total cholesterol (TC), 3 low-density lipoprotein cholesterol (LDL-C), high-density lipoprotein cholesterol (HDL-C), and triglycerides (TG), 4 has long been evaluated to predict the CVD risk. 5 Based on previous studies, lowering TC and LDL-C can decrease CVD risk, and HDL-C contributes independently to CVD risk. 6 Along with lipid profiles, some conventional biomarkers such as the Atherogenic Index of Plasma (AIP), Castelli Risk Index (CRI), and Atherogenic Coefficient (AC) can be used to predict CVD risk. 7
The incidence of CVD is different between males and females so it is much higher in males. Sex hormones, especially estrogens, and androgens, may partially be responsible for sex differences in cardiovascular diseases.1,8 In males, the physiological testosterone levels have protective effects on CVD, while testosterone deficiency is related to the high prevalence of CVD,9,10 low testosterone levels may result in lower HDL-C and higher TG levels.11,12 Testosterone as well as other hydrophobic steroids are transported partially by plasma sex hormone-binding globulin (SHBG). 13
The human liver produces SHBG, a glycoprotein 14 that regulates the concentration of free hormones in the bloodstream and their transport to target tissues. 15 In males, more than 40% of total testosterone (TT) in the bloodstream is bound to SHBG. 16 The possible role of SHBG in CVD risk has gained attention but the results of previous studies are inconsistent. For instance, Gyawali et al 17 , reported elevated SHBG and lower TT were associated with higher CVD risk and mortality in old men. Controversially, in another study lower plasma testosterone was not associated with CVD-related, mortality. 17 Li et al 18 , found no direct causal effect between both SHBG and TT with coronary heart disease. Since age and sex have been found as confounding factors regarding the interaction between SHBG and CVD, we conducted this study among young sedentary males to examine the relationship between SHBG and CVD risk factors with detailed lipid profiles and atherogenic indices in young men after adjusting age and energy intake.17,19
Methods
We conducted this cross-sectional study among 48 sedentary (<600 metabolic equivalents (MET)-minutes/week) young males aged 18 to 40 years in Tabriz, Iran in 2021. Tabriz University of Medical Sciences Ethics Committee approved the study (code: IR.TBZMED.REC.1399.1015). Males with respiratory disease, thyroid disease, neurological disease, autoimmune disease, CVD, diabetes, or skeletal disorders were excluded from the study. The subjects had not taken any medications or supplements in the last 2 months.
Diet, physical activity (PA), and anthropometric measurements
In this study, 24-hour dietary recall interviews were conducted with all participants. We used the brief version of the International Physical Activity Questionnaire (IPAQ) to assess physical activity levels.20,21 MET-min/week was used to measure activity levels, according to the IPAQ categories 22 as follows: Walking = 3.3 METs × minutes × walking days; moderate PA = 4.0 METs × minutes × moderate days; vigorous PA = 8.0 METs × minutes × vigorous-intensity days; and total PA = walking + moderate PA + vigorous PA MET-minutes/week scores. In addition to measuring height and weight with minimal clothing and no shoes, measurements were made with a stadiometer that was accurate to 0.1 cm and a digital scale (SECA, Germany) that was accurate to 0.1 kg. A body mass index (BMI) is computed by dividing weight in kilograms by height in meters squared. Analyses of body composition were conducted using the Tanita body analyzer (Tanita, Tokyo, Japan). The percentage of body fat, fat-free mass, and muscle mass were evaluated based on the bioelectrical impedance method. Participants were instructed to step with bot on electrodes and grab 2 handgrips based on the manufacturer’s instructions. The body fat percentage is the proportion of fat weight to total body weight and muscle mass is estimated based on height in kilograms.
Laboratory analysis
In this study, sterile, dry, and disposable syringes were used to collect intravenous blood samples after 12 hours of fasting early in the morning. Five minutes of centrifugation were performed on the samples at 3000 rpm. Plasma samples were separated and frozen at -80 °C. All tests were performed in a triplicate manner.
TT and SHBG were analyzed using enzyme-linked immunosorbent assay 23 (DiaMetra kit, Italy). The sensitivity of the method for TT was 3.28 mg/ml. The ELISA was performed in accordance with the manufacturer’s instructions. Microtiter plate readers were used to measure optical absorbance at 450 nm. The intra-assay coefficient of variation (CV) and inter-assay CV of the Anti-TT assay was ⩽2.42% and ⩽5.58%, respectively. 24 Inter and intra-assay CV for SHBG was 7.2% and 4.6%, respectively.
Fasting blood sugar (FBS), TG, and TC were estimated with a commercial kit (Pars Azmoon kit, Iran) based on a colorimetric enzymatic process, and reporting was conducted using an Auto analyzer device (Abbott, model Alcyon 300, USA). The sensitivity of the method for FBS was 5 mg/dl. Inter and intra-assay CV were 1.19% and 1.74% for FBS, respectively. In the measurement of lipid parameters, the inter and intra-assay CV was 1.14% and 1.62% for TC and 1.6% and 1.53% for TG, respectively. The HDL-C was measured using a biochemical kit (Bionik Diagnostic Systems, Iran) with a sensitivity of 1 mg/Dl, inter-assay CV = 1.3%, and intra-assay CV = 0.8%. Friedewald’s formula was used to estimate LDL-C: LDL-CF = Total cholesterol—HDL-C—(TG/5). 25
Atherogenic ratios including AIP = (log TG/HDL-C), CRI-I = (TC/HDL-C), CRI-II = (LDL-C/HDL-C), and AC = (TC–HDL-C)/HDL-C were calculated 7 based on previous studies.
Superoxide dismutase (SOD) amounts were determined by a Nasdox kit (Navand Lab Kit, Iran). Catalase Plasma level was measured using Catalase diagnostic Kit (Item No. 707002). Glutathione peroxidase (GPX) activity was analyzed with a standard colorimetric kit (ZellBio GmbH, Germany). ELISA kits (LDN, Germany) evaluated total antioxidant capacity (TAC). Malondialdehyde (MDA) activity was assessed via spectrophotometric analysis using the thiobarbituric acid reactive substances method.26,27
We measured insulin levels using an ELISA kit (Insulin kit, Monobind, Lake Forest, USA). The sensitivity of the method for insulin was 0.75 µIU/mL. Inter and intra-assay CV were <9.8%, and <8% respectively. Calculations of insulin sensitivity were performed using the homeostasis model assessment of insulin resistance (HOMA-IR) based on fasting blood glucose and insulin values: (Fasting plasma glucose concentration [mg/dL] ×Fasting plasma insulin concentration [mIU/L])/22.5. 28 A lower insulin sensitivity is indicated by an increase in HOMA-IR values. In order to calculate the Quantitative Insulin-sensitivity Check Index (QUICKI), we used the following formula: 1/(Fasting plasma insulin concentration [mIU/L] + Fasting plasma glucose concentration [mg/dL]). 28 Insulin sensitivity is directly related to QUICKI.
The concentration of high-sensitivity C-reactive protein (Hs-CRP) was determined in cases using latex-enhanced immunonephelometric assays on a BN II analyzer (Dade Behring). At 0.35 and 0.5 mg/L concentrations, the assay has a day-to-day precision (CV) of ∼5% and a detection limit of 0.15 mg/L.
Standard balance, sit-up, and reaction time tests
Stork balance stand test
Stork’s test was used to evaluate and measure the balance of the participants. In this test, the amount of balance was measured based on time and in seconds. In this test, the participants stood on one leg with their hands on their hips and placed the non-supporting leg next to the knee of the supporting leg. A stopwatch was used to measure how long the participant could stand on one foot. If the supporting foot moved in any direction, the non-supporting foot slipped off the knee, or the hands separated from the hips, the timing was stopped. As a result of 3 attempts, the best score was obtained. 29
Sit-up test
To measure muscle endurance, we used the sit-up test and the number of correct movements was the measure of muscle endurance. In this experiment, the subjects lay on their backs with their knees bent and their feet flat on the ground. In the experiment, the assistant held the subjects’ feet on the ground while holding their hands on their chests. Participants returned to the ground once their elbows touched their knees. It was repeated for 30 seconds as many times as possible. A count was made of how many correct and long sessions were completed. 30
Reaction time test
One of the tests to measure mental strength is the reaction time test. The skeletal muscle reaction time (RT) test was performed using a website (Humanbenchmark.com). People were shown a blank page when they selected the start option and clicked immediately as soon as they saw the green color. In this test, participants were tested 5 times, and their average speed was measured in milliseconds.
Statistical analysis
We assessed the data’s normality using the Kolmogorov-Smirnov test. In data analysis, mean and standard deviation 31 were assessed for all variables. Categorical data were reported by percentage. Partial correlation coefficients adjusted for age and energy (kcal) were used to assess the correlation between SHBG and other related factors. P-value < .05 was considered statistically significant. SPSS software version 23 was used for all analyses.
Results
The general characteristics of all participants are summarized in Table 1. All participants were males with a mean age of 24.54 ± 3.90 years and a mean BMI of 25.82 ± 4.42. The correlations between SHBG and other parameters are presented in Table 2. According to the results, SHBG revealed a negative correlation with body weight (r = −.371, P = .04), BMI (r = −.438, P = .014), and fat mass (r = −.447, P = .012). SHBG showed no significant association with muscle mass or fat-free mass. 1
General characteristics of the study subjects (N = 48).

Abbreviations: SHBG, Sex hormone binding globulin; FFM, Fat free mass; BMI, body mass index; PAL, Physical activity level; FBS, Fasting blood sugar; HOMA-IR, Homeostasis model assessment of insulin resistance; QUICKI, quantitative insulin sensitivity check index; TC, Total Cholesterol, HDL-C, High density lipoprotein-cholesterol; LDL-C, Low density lipoprotein-cholesterol; TG, Triglyceride; TAC, Total antioxidant capacity; SOD, Superoxide dismutases; GPx, Glutathione Peroxidase; MDA, Malondialdehyde; hs-CRP, High Sensitivity C-Reactive Protein.
The correlation between SHBG with variables.
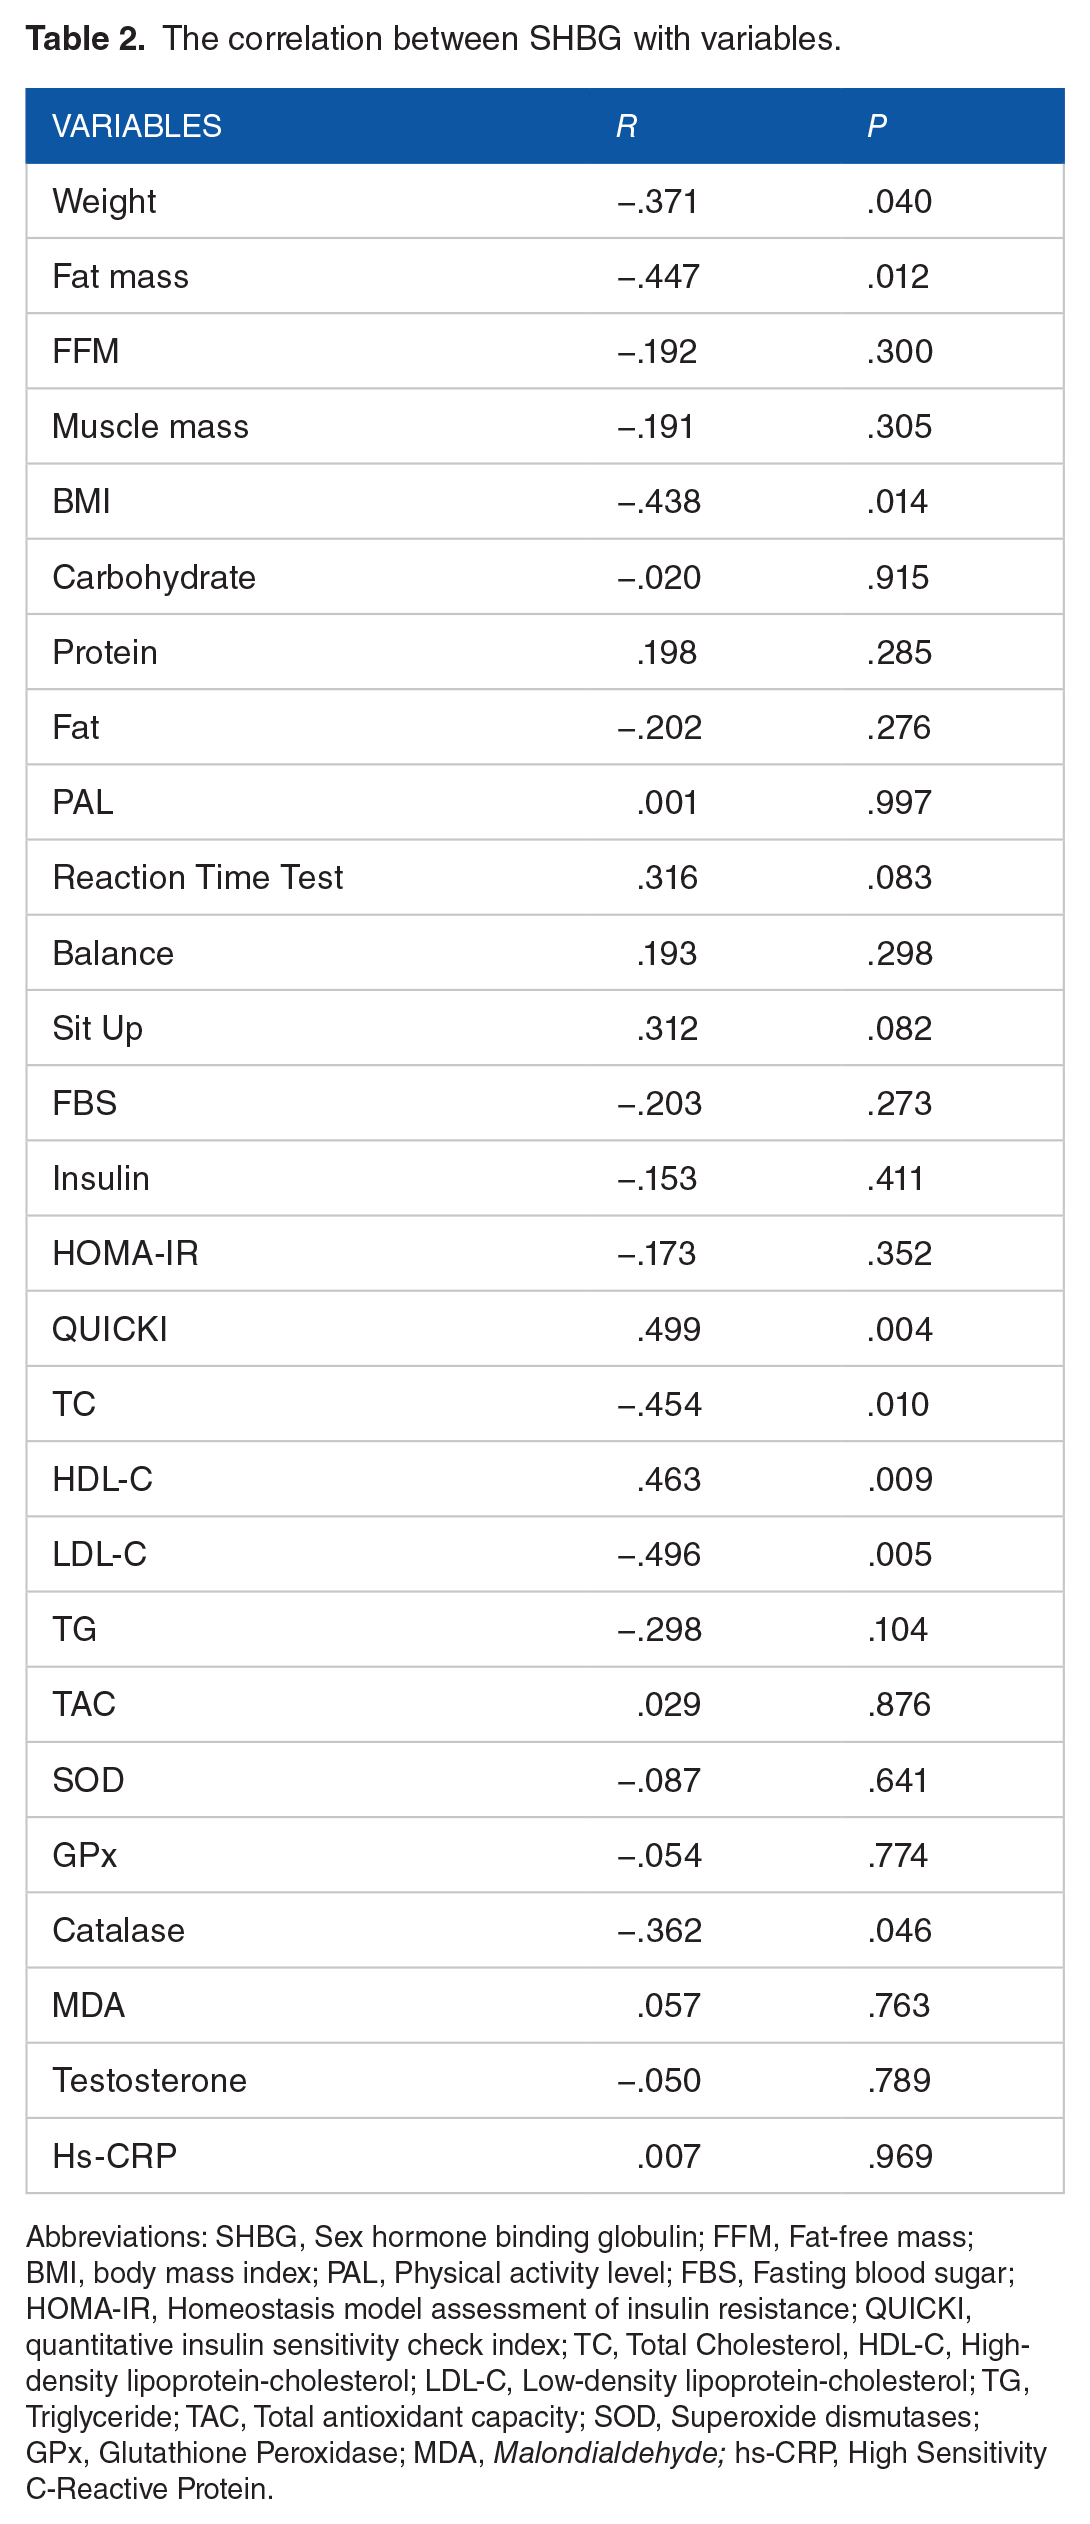
Abbreviations: SHBG, Sex hormone binding globulin; FFM, Fat-free mass; BMI, body mass index; PAL, Physical activity level; FBS, Fasting blood sugar; HOMA-IR, Homeostasis model assessment of insulin resistance; QUICKI, quantitative insulin sensitivity check index; TC, Total Cholesterol, HDL-C, High-density lipoprotein-cholesterol; LDL-C, Low-density lipoprotein-cholesterol; TG, Triglyceride; TAC, Total antioxidant capacity; SOD, Superoxide dismutases; GPx, Glutathione Peroxidase; MDA, Malondialdehyde; hs-CRP, High Sensitivity C-Reactive Protein.
Moreover, we found no significant correlation between SHBG and dietary intake of carbohydrates, protein, and fat. Among biophysical parameters, only sit-ups showed a positive correlation with SHBG (r = −.499, P = .003). A significant inverse correlation was found between SHBG levels and LDL-C (r = −.496, P = .005) and TC (r = −.454, P = .010). While SHBG showed a positive correlation with HDL-C (r = .463, P = .009), no significant correlation has been demonstrated between SHBG and TG (r = −.298, P = .104).
A strong significant negative correlation was shown between SHBG and atherogenic factors including AIP (r = −.474, P = .006), CRI1 (r = −.581, P < .001), CRI2 (r = −.564, P = .001), and AC (r = −.581, P < .001). Figure 1(a) to (d) with R2 linear shows how well a line follows the variations of SHBG and atherogenic ratios.

(a) Correlations between sex hormone-binding globulin (SHBG)and Atherogenic Index of Plasma (AIP) in young males, (b) correlations between sex hormone-binding globulin (SHBG) and Castelli Risk Index 1 (CRI-1) in young males, (c) correlations between sex hormone-binding globulin (SHBG) and Castelli Risk Index 2 (CRI-2) in young males, and correlations between sex hormone-binding globulin (SHBG) and Atherogenic Coefficient (AC) in young males.
No significant correlation was found between SHBG and FBS. The correlation between insulin (r = −.355, P = .040), HOMA-IR (r = −.387, P = .024), and SHBG was negatively significant. QUICKI and SHBG revealed a positive correlation (r = .499, P = .004).
No significant correlation was found between SHBG and TAC, SOD, GPx, catalase, and MDA. Hs-CRP revealed a positive significant correlation with SHBG (r = .387, P = .024).
Discussion
We found that elevated plasma SHBG levels were associated with a better lipid profile throughout the present study. Previous studies investigating the association between SHBG and CVD,16,32-35 were mostly conducted among postmenopausal women,36-38 middle-aged and older males,39-42 patients suffering from metabolic syndrome (MetS), obesity, or CVD.11,39,40,43-45 Therefore, we examined CVD risk factors in young males aging 18 to 40 years for preventing the development of CVD.
In our study, along with the improvement of lipid profile, atherogenic indices also had a potential negative correlation with SHBG. Similarly, a recent study among patients with MetS showed low SHBG concentration in association with higher LDL-C and reduced HDL-C in both sexes. 43 Also, Aribas et al 19 found that people with more CVD risk factors had lower SHBG levels. In a cohort study, the association of cardiovascular risk factors with SHBG was investigated in the Italian adult population. Among Italian adults, elevated levels of SHBG were associated with high HDL cholesterol. 46 Although some other studies have shown different results and found no association between SHBG and cardiovascular risk factors. In Collet et al study, no association between SHBG and CVD events has been found. 1 The mechanism underlying the association between SHBG levels and lipid profiles is still not clear, but SHBG may regulate the bioavailability of androgens in the plasma by binding to them. In males, androgens may affect lipid metabolism by inducing hormone-sensitive lipase and assisting lipolysis. Lipoprotein lipase could exchange very low-density lipoprotein cholesterol (VLDL-C) to LDL-C.47,48 The modulation of lipoprotein lipase activity by SHBG in the liver could explain the negative association between SHBG and TG. 49 SHBG could have an impact on hepatic biosynthesis of lipoprotein lipase, which has a primary role in regulating HDL-C levels.
We found a negative correlation between SHBG, BMI, weight, and fat mass in our study. Similarly, Gannagé-Yared et al 50 showed the same inverse correlation between SHBG and BMI in young 18 and 30 years aged males. On the contrary, Chen et al 44 indicated a positive correlation between SHBG and BMI in older males. Perhaps the differences in the results can be dependent on variables such as age and physical activity. Previous studies showed changes in plasma SHBG levels through their weight loss process51,52 or in patients with eating disorders 53 but based on our literature review no exact mechanism has been described before. 14 Among dietary intake and biophysical parameters, only the correlation between SHBG and sit-up was statistically significant. An understanding of the mechanism underlying this relationship requires further research.
Our results indicated that there was no association between TT and SHBG. But previous studies have shown different results. According to a study by Tsai et al 54 , a significant relationship was observed between SHBG and TT. They indicated that SHBG and TT were significantly associated with fasting glucose. Longcope et al 55 indicated that there is a positive relationship between SHBG concentrations and testosterone, but age and body mass index appears to be more important in predicting the SHBG concentration. Since the level of sex hormone-binding globulin (SHBG) is associated with glucose metabolism in nondiabetic women and men, the SHBG levels can predict the development of type 2 diabetes mellitus. In a study that was conducted on people with type 2 diabetes, there was a strong positive correlation between the level of SHBG and the sensitivity to insulin in these individuals but SHBG levels did not correlate with levels of free testosterone.56-58 Moreover, in Multiple Risk Factor Intervention Trial, men with decreased SHBG concentrations are more likely to develop insulin resistance and non-insulin-dependent diabetes mellitus, 59 whereas in other male populations, there is no such association. 60 It can be hypothesized that a low TT level induces hyperinsulinism, which, in turn, is the cause of the low SHBG level; insulin is known to inhibit the production and secretion of SHBG in vitro, 61 while insulin pulses 62 and the portal insulin concentration 63 seem to regulate SHBG production in men. It is possible that a low TT level causes a low SHBG level rather than being the consequence of it. This lack of significant correlation in our study can be attributed to the small sample size.
In a population-based cohort Study among 1344 men aged 20 to 79 years with a 5-year follow up an inverse correlation between SHBG and markers of inflammation and oxidative stress was found. 64 In this regard the same correlation was found in women with PCOS. 65 In our study no association has been found between SHBG and oxidative stress parameters including TAC, SOD, GPx, MDA, and catalase. A positive correlation was observed between the SHBG and Hs-CRP. Further studies are needed to understand the relationship between SHBG and inflammation and the antioxidant system. Based on national research that conducted by the National Health and Nutrition Examination Survey (NHANES) the association between endogenous sex steroid hormones and inflammatory biomarkers in US men was examined. The results of this study showed elevated total and calculated free testosterone concentrations were significantly associated with lower concentrations of CRP. These findings indicated that elevated androgen and decreased estrogen levels may have an anti-inflammatory effect in men. 66
Inflammatory biomarkers appear to be associated with steroid sex hormones, but the mechanisms explaining these associations are not well understood. Numerous studies have confirmed that androgens suppress the immune system. In androgen-deficient men, autoimmune diseases are more prevalent. 67 In older men, hypogonadism is associated with a significant increase in interleukin-6 levels, 68 as well as an anti-inflammatory effect from activating androgen receptors. 69 A direct effect of androgens on inflammation genes could be responsible for the immunosuppressive effect,70-72 or they could act in an indirect manner by inhibiting nuclear factor-kB activity. Estrogens play a significant role in the physiology of males, according to studies. The most biologically active estrogen in men is estradiol, which is formed primarily in adipose tissue from testosterone aromatization. Estradiol may have a positive effect on liver gene expression of CRP, thus explaining the potential positive association between estradiol and CRP. There is no evidence that steroid sex hormones are expressed in the CRP promoter, but estrogen can stimulate the transcription factor C/EBP-b that boosts CRP expression.73,74
In most cross-sectional studies, androgen concentrations were inversely related to inflammatory biomarkers.3,75-82 CRP concentrations were associated with lower total testosterone and calculated free testosterone in Chinese men, according to a recent study. An inverse association was found between testosterone and CRP levels in the Boston Area Community Health Survey. 81 On the other hand, some smaller cross-sectional studies have not found this effect, even though their point estimates were inverse.73,83-85
While we demonstrated no association between SHBG and FBS, a positive correlation has been found between the insulin sensitivity marker QUICKI and SHBG. HOMA-IR and insulin levels revealed a negative significant correlation with SHBG. Gannagé-Yared et al. 50 showed inverse correlations between SHBG and HOMA-IR in young males aged 18 to 30 years. SHBG may predict the development of insulin resistance in both sexes in a longitudinal study of 1193 individuals. 31 Insulin can affect both lipid profiles and SHBG. 86 Some dietary factors that influence SHBG gene transcription may describe the association between SHBG levels and type 2 diabetes. 15 Additionally, SHBG concentrations seem to be 50% heritable, and we should consider genetic factors investigating the function of SHBG in lipid and carbohydrate metabolism, type 2 diabetes, and cancer development. 87 SHBG concentrations are low when insulin levels are high, and insulin may inhibit hepatic SHBG synthesis, suggesting that low SHBG is a consequence of insulin resistance rather than a cause. SHBG production is inhibited by insulin in vitro in cell lines derived from hepatoma, 88 whereas Diazoxide raises SHBG levels after inhibition of insulin secretion.89,90 There has been a report that elevated fasting insulin levels had a negative effect on the hepatic synthesis of all proteins, not just SHBG. 91 We are unaware of any data describing insulin’s effects on SHBG clearance or degradation. According to one study, SHBG is positively related to insulin clearance rates. Correlations were no longer statistically significant after BMI was corrected. 92
This study had some limitations. First, due to the cross-sectional design of the study, further long-term studies are required to investigate the association between SHBG and CVD risk factors. Second, our study was based on SHBG. Therefore, for better evaluation, more hormones should be examined. For example, estradiol, a product of testosterone, can give us helpful information about lipid metabolism in the progression of CVD. 11 SHBG genetic variables may effectively assess the association between SHBG and testosterone and CVD risk factors. 16 In future studies, genetic factors could be addressed. Further studies with larger sample sizes and extra confounding variables are needed to evaluate the relationship between BMI, age, and race.
Conclusion
According to our results, elevated SHBG levels were correlated with improving CVD risk factors. SHBG levels were directly correlated with TG, TC, and LDL-C, but reversely associated with HDL-C levels in young males. Furthermore, decreased SHBG levels with high BMI had a vital role in increasing CVD. So, SHBG may have an essential role in the CVD risk factors among young males. Finally, finding the different SHBG pathways might help understand the association between SHBG and CVD risk factors.
Footnotes
Acknowledgements
The authors wish to thank all the study participants. This work has been extracted from the M.S. thesis of Ali Mohammadrezaei and the thesis protocol has been approved by the ethical committee of Tabriz University of Medical Sciences. We thanks Reserach Undersecretary of Tabriz University of Medical Sciences for their financial support (Grant num. 65399).
Funding:
The author(s) disclosed receipt of the following financial support for the research, authorship, and/or publication of this article: The current work has been granted by Tabriz University of Medical Sciences (Code:IR.TBZMED.REC.1399.1015).
Declaration of Conflicting Interests:
The author(s) declared no potential conflicts of interest with respect to the research, authorship, and/or publication of this article.
Author Contributions
All authors have read and approved the manuscript. MAF and AMA designed the idea of the project and revised the manuscript. She also was involved in data analysis and hypothesis generation. AMR performed the scientific literature search, wrote the first draft of the manuscript, and performed the statistical analysis. MMA, AMA, and RM were involved in lab work.