
Abstract
Chronic heavy alcohol exposure causes steatohepatitis manifested by abnormal intra-hepatocyte accumulation of lipid and parenchymal inflammation. Attendant alterations in polyunsaturated fatty acid (PUFA)-containing phospholipids could cause alcoholic liver disease (ALD) to progress by promoting oxidative stress, inflammation, and fibrogenesis. Previously we showed that myriocin, a serine palmitoyltransferase inhibitor, ameliorates experimental alcohol-induced steatohepatitis. However, the surprising overall therapeutic responses suggested that myriocin’s targets may go beyond sphingolipids. To this end, the present study examines the effects of myriocin on hepatic composition of docosahexaenoic acid (DHA)- and arachidonic acid (AA)-containing phospholipids in an experimental model of ALD. A chronic+binge ethanol exposure model was generated by feeding Long Evans rats with ethanol-containing diets (24% caloric content) for 8 weeks and simultaneously binge gavage administering 2 g/kg ethanol on Tuesdays, Thursdays and Saturdays during Weeks 6-8. Myriocin was administered by i.p. injection on Mondays, Wednesdays, and Fridays of Weeks 3-8. Control rats were studied in parallel. Upon euthanasia, the livers were harvested to examine ethanol- and/or myriocin-modulation of hepatic lipids using matrix-assisted laser desorption/ionization imaging mass spectrometry (MALDI-IMS). Results were analyzed statistically by two-way analysis of variance and depicted with data bar plots and heatmaps. Chronic+binge ethanol exposures significantly increased hepatic expression of AA-containing phospholipids including PE(36:4) (P = .005), PE(38:4) (P = .03), and PI(38:4) (P = .04) and reduced DHA-containing phospholipids including PS(40:6) (P = .03) and PE(40:6) (P = .04) relative to control. Myriocin partially reversed ethanol’s effects on hepatic PUFA expression by decreasing PE(36:4) (P = .004) and increasing PS(40:6) (P = .04) and PI(40:6) (P = .0003) relative to ethanol-exposed rats. Ethanol-mediated alterations in hepatic PUFA-containing phospholipids may contribute to hepatic oxidative and inflammatory injury by increasing AA and fibrogenesis by inhibiting DHA. The results suggest that Myriocin may help reduce or prevent long-term and progressive liver injury stemming from excessive chronic+binge ethanol consumption.
Introduction
Long-term alcohol abuse can lead to liver steatosis, which can progress to steatohepatitis, which in turn leads to liver fibrosis, cirrhosis and end stage liver disease. 1 Although abstinence and nutrient supplementation can be effective, in reality, social and behavioral abnormalities cause alcohol seeking behavior and addiction and prevent conservative therapeutic efforts. 2
Previous studies linked oxidative stress and inflammation in ALD to dysregulated lipid metabolism marked by altered lipid profiles including sphingolipids, particularly ceramides,3-7 and membrane phospholipids.8-10 Among various phospholipids, omega-3 (ω-3) and omega-6 (ω-6) polyunsaturated fatty acids (PUFA) containing phospholipids have begun to draw attention in relation to ALD.11-14 The ω-3 and ω-6 PUFAs are essential fatty acids that the human body cannot synthesize and therefore they must be supplied in the diet. ω-3 PUFAs, docosahexaenoic acid (DHA) and eicosapentaenoic acid (EPA), serve an important role in regulating inflammatory response as substrates for enzymatic conversion to potent bioactive compounds such as resolvins, protectins, and maresins that display protective anti-inflammatory and pro-resolving activities.15,16 DHA reduces oxidative stress and fibrogenesis by inhibiting hepatic expression of collagen type I alpha 1 (COL1A1) and alpha-smooth muscle actin (α-SMA).17-19 In contrast, human and experimental ALD studies revealed adverse effects of ω-6 PUFAs such as arachidonic acid (AA), a precursor in the biosynthesis of eicosanoids including prostaglandins, leukotrienes, and thromboxanes. Ethanol-induced hepatotoxicity is associated with increased levels of eicosanoids generally involved in pro-inflammatory responses, including 9,10-dihydroxy-octadecenoic acid (DiHOME); 8,9- and 11,12-dihydroxy-eicosatrienoic acids (DiHETrEs); and 15-hydroxy-eicosatetraenoic acid (HETE) in liver. 20 Given the opposing physiological functions of ω-3 PUFAs and ω-6 PUFAs, it is reasonable to predict that a chronically low ω-3/ω-6 ratio would confer a pro-inflammatory state whereas the opposite would support healthy liver function and either reduce or reverse ALD.
Previous human and experimental animal studies revealed elevated levels of hepatic ceramides in alcohol-induced steatohepatitis.3,4 Myriocin, a potent inhibitor of ceramide synthesis that functions by inhibiting serine palmitoyl transferase, 21 can broadly reverse structural, biochemical and molecular features of ALD. 22 Given the fact that many alterations in hepatic lipid profiles occur with chronic ethanol exposure, it is unlikely that myriocin’s striking therapeutic effects are mediated through a single class of lipids, and instead suggest that primary or secondary restorative changes also occur. Since alterations in ω-3 and ω-6 PUFA expression can critically impact development and progression of ALD, it is of interest to determine if myriocin’s therapeutic response is also mediated by normalization of ω-3/ω-6 balance. This research is novel since there is no substantive body of literature that addresses the potential effects of myriocin on DHA- or AA-containing phospholipids in ALD.
Materials and Methods
Materials: HPLC grade solvents, methanol and chloroform, 2,5-dihydroxybenzoic acid (DHB), α-cyano-4-hydroxycinnamic acid (HCCA), and myriocin were purchased from Sigma Aldrich (St. Louis, MO). Peptide calibration standard mix was purchased from Bruker Daltonics (Billerica, MA). Lieber-DeCarli isocaloric liquid diet mixes (F1258SP and F1259SP) were purchased from BioServ (Frenchtown, NJ, USA) (Supplemental Table 1).
Experimental Model: Four-week-old male and female Long Evans rats were pair-fed for 8 weeks with isocaloric liquid diets containing 0% or 24% ethanol (caloric content). During the last 3 weeks, the ethanol fed rats were gavaged with 2 g/kg ethanol in liquid diet on Tuesdays, Thursdays, and Saturdays while the control rats were gavaged with saline in liquid diet. In Weeks 3-8, rats were administered intraperitoneal injections of myriocin (0.3 mg/kg) or saline on Mondays, Wednesdays, and Fridays22,23 (Supplemental Figure 1). Food intake was monitored daily and body weight was measured weekly (Supplemental Figure 2). Each group included 6 male and female rats. At the end of Week 8, rats were euthanized by isoflurane anesthesia. Portions of livers were rinsed in ice-cold phosphate buffered saline buffer (pH 7.4) to remove excess blood, cut into small pieces, snap-frozen on dry ice, and stored in −80°C. Blood alcohol concentrations were measured with an Analox GM7 Analyzer (Analox Instruments, Lunenburg, MA). Ethanol exposed rats (±myriocin) had higher levels of blood alcohol levels (53.4-74.65 mg/dl) relative to control rats (±myriocin) (7.1-9.3 mg/dl). The specific animal protocol used in this study is consistent with the National Institutes of Health guide for the care and use of laboratory animals, and was approved by the Institutional Animal Care and Ethics Committee at the Lifespan-Rhode Island Hospital.
MALDI-IMS: For simultaneous analysis of hepatic phospholipids, a tissue microarray (TMA) consisting 24 frozen liver tissue cores (3-mm diameter) was generated, cryo-sectioned at 8 µm thickness, and mounted on an Indium Tin Oxide (ITO)-coated slide. After subliming DHB (200 ± 13 mg/cm2) onto the slide, the liver cores were imaged with Ultraflextreme MALDI time-of-flight (TOF) mass spectrometer (Bruker Daltonics, Billerica, MA). 24 Phospholipids were detected in the negative ion reflectron mode within a mass range of 600 to 1200 Da as described previously. 25 Data was calibrated externally with the peptide calibration mixture consisting of masses in the range of 377 and 2463 Da.
Data Analysis: The MALDI imaging dataset was normalized by total ion count (TIC) method with FlexImaging software (version 4.0) (Bruker Daltonics). 26 MALDI MS data (90 spectra per liver core) was imported into ClinProTools for normalization, baseline correction, peak defining, and recalibration. Tentative phospholipid assignment was accomplished by matching the mass-to-charge ratios (m/z) of ions with the previously identified ions in our laboratory or other publications.27-31 The average intensity of phospholipid ions detected in alcohol and myriocin groups were compared to control groups. The mean percent changes in phospholipid ion intensity were depicted in data bar plots. A heatmap was generated to compare the average intensities of phospholipid ions with respect to ethanol exposure and myriocin treatment. The hierarchical clustering of phospholipid ions were performed using GeneCluster 3.0 and visualized with Java TreeView. 32 The experimental groups were compared by two-way analysis of variance (ANOVA) with the post hoc Tukey tests (GraphPad Prism 8, San Diego, CA, USA).
Results
Arachidonic Acid (AA)- and Docosahexaenoic Acid (DHA)-Containing Phospholipid Profiles in the Liver: The tissue microarrays containing rat liver cores analyzed with MALDI-IMS revealed expression of several DHA-containing phospholipids such as DHA-phosphatidylserine (PS(40:6)), DHA-phosphatidylethanolamine (PE(40:6)), and DHA-phosphatidylinositol (PI(40:6)) in the negative ion mode. In addition, MALDI-IMS detected several AA-containing phospholipids such as AA-phosphatidylserine (PS(38:4)), 2 AA-phosphatidylethanolamines (PE(36:4) and PE(38:4)), and 2 AA-phosphatidylinositols (PI(36:4) and PI(38:4)) in the negative ion mode.
Ethanol-Induced Alterations in AA- and DHA-Containing Phospholipids in the Liver: Comparative lipid analysis of the livers from control-vehicle (CV), control-myriocin (CM), ethanol-vehicle (EV), and ethanol-myriocin (EM) groups revealed relative effects of ethanol exposure and myriocin treatment on DHA- and AA-containing phospholipids detected in the negative ion mode. To evaluate ethanol and myriocin effects on hepatic lipid expression, the mean peak intensities (reflecting lipid ion abundance) were compared by two-way ANOVA with the Tukey post-hoc test. The percent change differences in mean phospholipid ion abundance between CV and CM, CV and EV, EV and EM, and CV and EM are depicted in data bar plots to visualize relative effects of alcohol and myriocin on hepatic lipid ion expression. Reductions in lipid ion expression are represented by the blue bars to the left and increases in lipid expression are represented by the red bars to the right (Figure 1). Significant (P < .05) or trend (0.05 < P < .1) effects obtained by two-way ANOVA followed by Tukey’s multiple comparison test results were shown next to the corresponding data bars. Ethanol exposure increased the mean expression levels of all AA-containing hepatic phospholipids relative to control. Tukey post-hoc analysis revealed that the percent differences in phospholipid ion abundance between control and ethanol were significantly higher in PE(36:4) (P = .005), PE(38:4) (P = .03), and PI(38:4) (P = .04) and showed a trend increase in PI(36:4) (P = .08). In contrast to AA-phospholipids, ethanol reduced expression of DHA-containing hepatic phospholipids including PS(40:6) (P = .03) and PE(40:6) (P = .04).

Data bar plots demonstrating effects of ethanol and myriocin effects on hepatic polyunsaturated fatty acid (PUFA)-containing phospholipid ion expression as detected by MALDI-IMS in the negative ion mode. A 4-way Long Evans rat model including control-vehicle (CV), control-myriocin (CM), ethanol-vehicle (EV), and ethanol-myriocin (EM) groups was used in this study. The percent change differences in mean phospholipid ion abundance between CV and CM, CV and EV, EV and EM, and CV and EM ranged from −60% to 60%. P values obtained by two-way ANOVA followed by Tukey’s multiple comparison test are shown to the right of each data bar plot. Ethanol or myriocin mediated reductions in phospholipid expression are represented by the blue bars to the left of the vertical axis, and increases by the red bars to the right. P-values reflect changes in mean lipid expression.
Myriocin mediated alterations in AA- and DHA-containing phospholipids in the liver
Myriocin treatment of control rats had no significant effect on hepatic expression of PUFA-containing phospholipids relative to vehicle treated control rats (CV) (Figure 1). However, myriocin treatment was able to reverse ethanol-induced effects on hepatic AA- and DHA-containing phospholipids. Tukey post-hoc test demonstrated that ethanol-fed plus myriocin treated rats (EM) exhibited significantly lower percent difference in hepatic expression of PE(36:4) (P = .004) and a trend decrease in PS(38:4) (P = .08) and PE(38:4) (P = .08) relative to ethanol-fed rats (EV). In contrast, EM exhibited higher percent differences in hepatic expression of DHA-containing phospholipids including PS(40:6) (P = .04) and PI(40:6) (P = .0003) relative to EV. Comparisons between CV and EM showed that EM significantly increased hepatic expression of PI(40:6) (P = .02).
Heatmap Depiction of Ethanol Exposure and Myriocin Treatment Effects on Relative AA- and DHA-Containing Phospholipid Ion Expression: Cluster 3.0/Java TreeView generated heatmap demonstrated distinct effects of ethanol exposure on AA- and DHA-phospholipids relative to control groups, and revealed partial normalization of phospholipid profiles by myriocin treatment in rat liver samples (Figure 2). Hierarchical dendrogram resulted in 2 major clusters. The upper cluster comprised only AA-containing phospholipids distinguished by low or moderate levels in control groups (CV and CM), striking increases with ethanol exposure (EV), and partial normalization after myriocin treatment (EM) in the liver. The lower cluster compromised DHA-containing phospholipids marked with moderate or high levels in controls (CV and CM), remarkable reductions in ethanol group (EV), and notable elevations following myriocin treatment (EM). Two-way ANOVA test demonstrated significant ethanol effects on the hepatic expression of PE(38:4) (P = .002), PE(36:4) (P = .03), PI(38:4) (P = .01), and PI(40:6) (P = .005); significant myriocin effects on the expression of PS(38:4) (P = .003), PE(38:4) (P = .006), and PE(36:4) (P = .04); and interactive effects on the expression of PE(36:4) (P = .003), PI(36:4) (P = .02), PS(40:6) (P = .01), and PI(40:6) (P = .0001) (Supplemental Table 2).
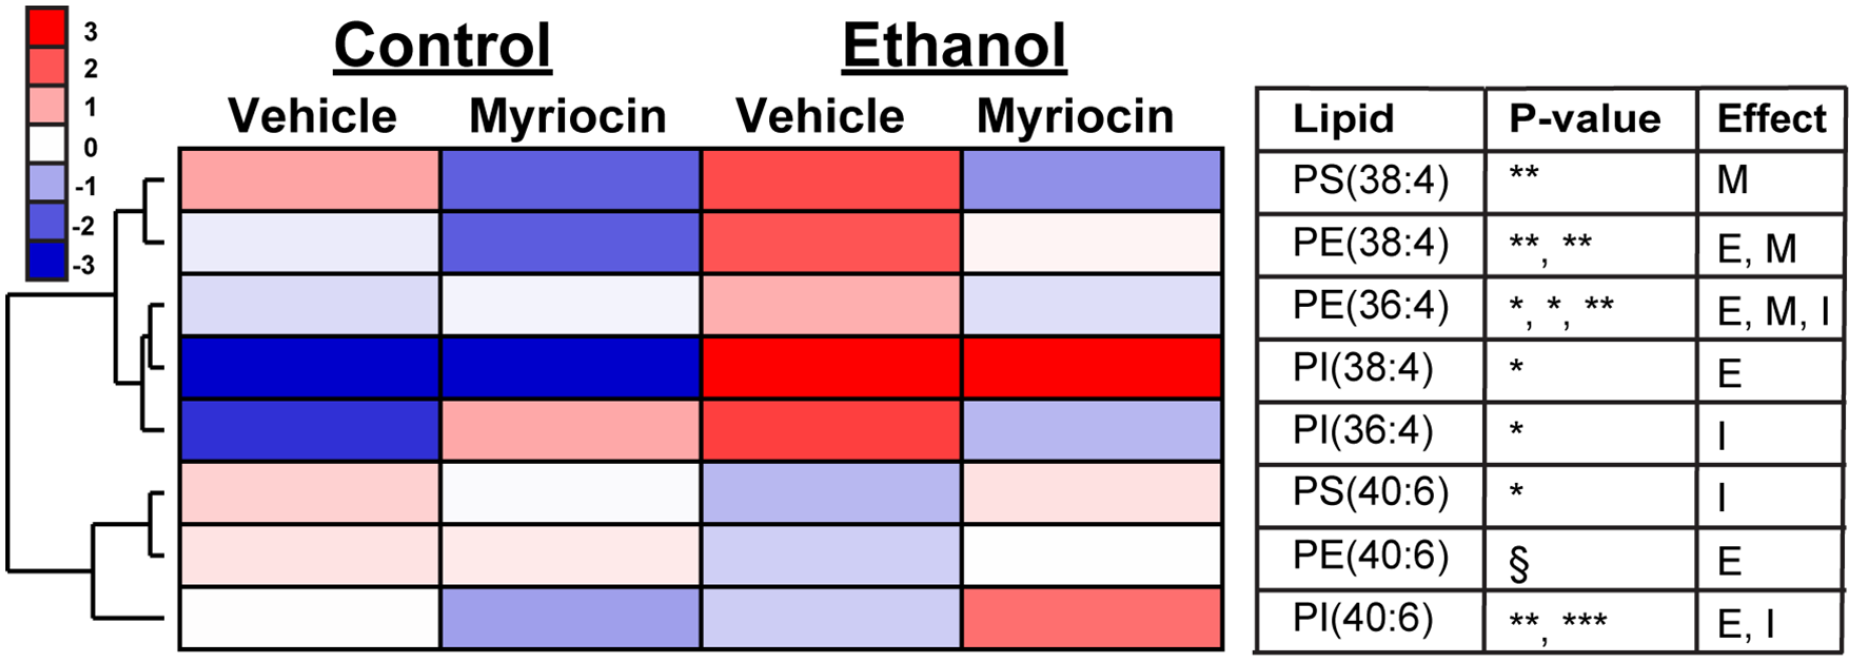
Heatmap illustrating myriocin and ethanol effects on hepatic expression levels of AA- and DHA-containing phospholipids. The mean levels of phospholipids detected in all groups were used to generate a heatmap with hierarchical clustering using Cluster 3.0 and visualized with Java TreeView. Ion intensities are displayed using a 7-color palette corresponding to z-scores scaled to have a mean of 0 and standard deviation of 3.0. Inter-group comparisons were made by two-way ANOVA with the Tukey post-test (*P < .05; **P < .01; ***P < .001; § (.05 < P < .10)).
Discussion
This study examined the effects of chronic plus binge alcohol exposures and intervention with myriocin on hepatic polyunsaturated fatty acid (PUFA)-containing phospholipid expression. The Lieber-DeCarli liquid diet containing ethanol is the most commonly used experimental animal model for ethanol-induced multi-organ pathology, including the liver. The chronic (24% ethanol, caloric content) plus binge (2 g/kg, gavage) alcohol exposure model resembles human drinking behavior, 33 produces robust alcoholic liver, 23 and is an accepted National Institutes of Health model. 34 Previous studies demonstrated that myriocin is an effective ceramide inhibitor that can restore liver structure and function in chronic ALD. 22 The goal of this study was to determine hepatic levels of DHA- and AA-containing phospholipids and test the hypothesis that myriocin treatment could reverse or reduce ethanol-mediated adverse effects on hepatic expression of PUFA-containing phospholipids.
A number of preclinical models of alcohol demonstrated that continuous ethanol exposure alters fatty acid levels in the liver resulting in a shift in the balance between ω-6 and ω-3 toward ω-6 PUFAs.12,20 Ethanol mediated increase in ω-6 PUFAs were mainly associated with pronounced arachidonic acid (AA, 20:4) and its precursor linoleic acid (LA, 18:2). 35 These findings are consistent with our observations. The higher amounts of AA-containing phospholipids display pro-inflammatory properties, enhancing the inflammation signaling cascade. 36
A growing body of evidence demonstrates the protective effects of dietary or endogenous ω-3 PUFAs on ethanol-induced liver injury in preclinical animal models of ALD.37-40 Wang et al 41 demonstrated that endogenous ω-3 PUFA enrichment by using transgenic fat-1 mice, which catalyze the endogenous conversion of ω-6 to ω-3 PUFAs, alleviated ethanol induced liver injury and inflammation. Clinical studies confirmed the importance of DHA by showing that patients with hepatic steatosis have lower concentrations of ω-3 PUFA in the blood and in liver tissue biopsies. 42 In addition, the cirrhotic liver lacks DHA and this change is associated with the progression of liver disease while DHA administration demonstrates an effective anti-fibrogenic effect. 17
Our findings demonstrate that myriocin treatment was able to reverse ethanol’s stimulatory effects on AA-containing phosphatidylserines and phosphatidylethanolamines suggesting that adverse effects of heavy alcohol consumption on hepatic ω-6 PUFA-containing phospholipid expression and associated liver injury can be ameliorated at least in part by myriocin. In addition, myriocin treatment reversed ethanol’s inhibitory effects on DHA-containing phospholipids (phosphatidylserine, phosphatidylethanolamine, and phosphatidylinositol) suggesting that myriocin mediated therapeutic effects are partially associated with elevated levels of hepatoprotective ω-3 PUFA-containing phospholipids.
In conclusion, this study is the first to demonstrate the effects of myriocin on hepatic PUFA-containing phospholipid expression in an experimental model of ALD. Despite continuous ethanol exposures, myriocin treatment was effective in reversing ethanol mediated adverse effects on DHA- and AA-containing phospholipids in the liver. Although DHA and AA have been demonstrated to function mainly via oxidative and inflammatory pathways and DHA exerts potent antifibrotic effects in the liver, further research is required to elucidate the exact mechanisms by which myriocin exert its effects on hepatic PUFAs in ALD pathogenesis.
Supplemental Material
sj-docx-1-nmi-10.1177_11786388221082012 – Supplemental material for Myriocin Treatment Reverses Alcohol-Induced Alterations in Polyunsaturated Fatty Acid-Containing Phospholipid Expression in the Liver
Supplemental material, sj-docx-1-nmi-10.1177_11786388221082012 for Myriocin Treatment Reverses Alcohol-Induced Alterations in Polyunsaturated Fatty Acid-Containing Phospholipid Expression in the Liver by Emine B Yalcin, Ming Tong, Camilla Homans and Suzanne M de la Monte in Nutrition and Metabolic Insights
Supplemental Material
sj-docx-2-nmi-10.1177_11786388221082012 – Supplemental material for Myriocin Treatment Reverses Alcohol-Induced Alterations in Polyunsaturated Fatty Acid-Containing Phospholipid Expression in the Liver
Supplemental material, sj-docx-2-nmi-10.1177_11786388221082012 for Myriocin Treatment Reverses Alcohol-Induced Alterations in Polyunsaturated Fatty Acid-Containing Phospholipid Expression in the Liver by Emine B Yalcin, Ming Tong, Camilla Homans and Suzanne M de la Monte in Nutrition and Metabolic Insights
Footnotes
Declaration of Conflicting Interests:
The author(s) declared no potential conflicts of interest with respect to the research, authorship, and/or publication of this article.
Funding:
The author(s) disclosed receipt of the following financial support for the research, authorship, and/or publication of this article: Supported by the VA Biomedical Laboratory Research and Development (BLRD) Career Development Award-2 1IK2BX004961 (EBY), R01- AA11431 (SMdlM), and R01-AA028408 (SMdlM).
Author Contributions
EBY and SMdlM designed the research; EBY, MT, and CH conducted the experiments and data analysis; EBY wrote and SMdlM revised the manuscript.
Supplemental Material
Supplemental material for this article is available online.
References
Supplementary Material
Please find the following supplemental material available below.
For Open Access articles published under a Creative Commons License, all supplemental material carries the same license as the article it is associated with.
For non-Open Access articles published, all supplemental material carries a non-exclusive license, and permission requests for re-use of supplemental material or any part of supplemental material shall be sent directly to the copyright owner as specified in the copyright notice associated with the article.