
Abstract
Background:
Globally and in Sub-Saharan Africa (SSA), the prevalence of overweight and obesity are on the rise. Data on overweight and obesity among men are scarce.
Objective
We aimed to determine the prevalence and factors associated with over-nutrition among men in Uganda.
Methods:
We used Uganda Demographic and Health Survey (UDHS) 2016 data of 5,408 men aged 15 to 45 years. Multistage stratified sampling was used to select study participants and data were collected using validated questionnaires. Multivariable logistic regression was used to determine factors associated with over-nutrition among 15 to 54-year-old men in Uganda.
Results:
The prevalence of over nutrition was 9.1%, where that of overweight was 7.9% (95% CI 7.2-8.7 and obesity was1.2% (95% CI 0.9-1.5). Men who were aged 25 to 34 (AOR = 3.28; 95% CI: 1.92-5.59), 35-44 (AOR = 4.51; 95% CI: 2.61-7.82) and 45 to 54 (AOR = 4.28; 95% CI: 2.37-7.74) were more likely to have over-nutrition compared to those aged 15 to 24 years. Married men (AOR=2.44; 95% CI: 1.49-3.99) were 2 times more likely to have over-nutrition than men who were not married. Men in the central region (AOR = 1.78; 95% CI: 1.22-2.60) were 1.78 times more likely to have over-nutrition than men in the northern region. Men who were in the richest wealth index quintiles were 10 times more likely to have over-nutrition compared to those in the poorest wealth index quintile (AOR = 9.38: 95 % CI 5.14-17.10).
Conclusion:
The factors associated with over-nutrition among Ugandan men in our study were increasing age, marital status, increasing wealth and region of origin. This shows the need for measures to abate the regional development inequalities, need to promote physical activity among older men and need to improve on the knowledge of nutrition and dietetic practices for married couples and men of different social classes.
Introduction
Obesity and overweight are a global public health problem affecting more than one-third of adults in the world. 1 Overnutrition is a form of malnutrition that arises from excessive intake of nutrients which lead to accumulation of body fat that impairs health for example, overweight or obesity. 2 For this study, over-nutrition was considered to be a combination of overweight and obesity. Over-nutrition is a well-known risk factor for non-communicable diseases like diabetes, cardiovascular disease (CVD) and certain cancers. 3 These diseases are increasing rapidly worldwide and are some of the leading causes of mortality accounting for 41 million deaths each year, equivalent to 71% of global deaths annually.4-6 The prevalence of over-nutrition has risen substantially in low, middle and high income countries with in the last decade.7,8 Globally, approximately 2.8 million deaths are attributed to the consequences of over-nutrition (overweight and obesity) annually. 9
In Africa, not a single country in the region is on course to meet the targets for over-nutrition among men with prevalence of obesity and overweight gradually on the rise currently at 7.8% and 27.7% respectively. 10 Africa still also has a high prevalence of undernutrition with over 16 countries in a protracted crisis including very low food security thus a double burden of disease. 11 The prevalence of over-nutrition in Sub Saharan Africa is on the rise and this co-exists with under-nutrition creating a double burden of malnutrition.7,12 The East African region also has a rising prevalence of over-nutrition among men from 14% in 2010 to 17% in 2016 10 this is also predicted to increase and still has a high prevalence of undernutrition. 11 The consequences of the increasing prevalence of over-nutrition include increased non-communicable diseases which will add more burden to the already struggling health systems of the EastAfrican countries of which Uganda is among. The lack of global commitment to nutrition of men with priority going to women and children has led to the increasing prevalence of over-nutrition in Men. Uganda also has a double burden of malnutrition which is represented by an increasing prevalence of overweight from 8% in 1995 to 19 % in 201613,14 while underweight prevalence stagnated at 10% in 1995 15 to 11 % in 2016. 16 Uganda is listed in the countries not on course to meet the targets for over-nutrition among men due to the increasing prevalence of overweight and obesity which is at 13.7% and 1.8%. 10
The majority of studies in relation to overweight and obesity carried out in Uganda have mainly focused on women, children and adolescents; hence, there is paucity of literature on the magnitude of over-nutrition and its associated factors among men which is on the rise. We aimed to determine the prevalence and associated factors of over-nutrition among men in Uganda.
Methods
Study design
A cross sectional study using secondary data analysis of the 2016 Uganda demographic health survey (UDHS) data set was conducted.
Data collection
The Uganda Demographic Health Survey 2016 data was provided by MEASURE DHS program. We initially had to request permission in order to access the data and this was granted. The UDHS 2016 data is the most recent and included many more variables on men as compared to the previous one and that is why we used the 2016 data set.
Men’s data on variables of interest to the study was collected from the general data set availed by the MEASURE DHS program thus creating a modified data set that was used for analysis.
According to the Uganda demographic health survey, data collection was from 20th June 2016 to 16th December 2016 by the Uganda Bureau of Statistics as part of the international measure Demographic Health Surveys (DHS) with support from ICF International and United States Agency for International Development (USAID). This survey is conducted every 5 years. In the UDHS, the Men’s Questionnaire was administered to all men aged 15-54 years in the sample of households selected for the male survey. The men’s questionnaire also collected men’s health indicators’ data while the biomarker questionnaire collected data on anthropometry. 17 In regards to anthropometry, weight was recorded in kilograms to the nearest 1 decimal point and was measured using a weighing scale (SECA). 17 Height was recorded in centimeters to 1 decimal point.
Study setting
Approximately, 40 853 749 million people live and work in Uganda and about 23.8% of these reside in urban areas. 18 Agriculture is one of the most carried out economic activity for Ugandans and it is responsible for about 24% of gross domestic product (GDP). 19
Study sampling and participants
According to the UDHS, stratified 2 stage cluster sampling design with census enumeration areas as the primary sampling units was used to collect sample. 20 From each stratum in the survey, the areas that were involved were chosen randomly using probability proportional to size. Sampling also involved selection of households through equal probability systematic sampling. A list containing all households and maps in the selected area were made available. 20 A total of 5408 men were sampled for anthropometry. Only data of 15-54-year-old-men was considered for secondary analysis.
Outcome variables
Over-nutrition (overweight and obesity combined) was the outcome variable and was defined as body mass index (BMI) ⩾ 25 kg/m2 inclusive of the obese (BMI ⩾ 30 kg/m2).17,21,22
Exposure variables
Determinants of over-nutrition included in this study were; age, marital status and education level, wealth index, household size and sex of household head, region and residence. Wealth index is a measure of household social economic status.20,23 Wealth index was categorized into 5 quintiles and these were; the poorest, the poorer, the middle, the richer and the richest quintiles.17,23 Place of Residence was divided in urban and rural. Region was categorized into; Northern, Central, Eastern and Western. 24 Level of Education was categorized into: no education, primary education, secondary and higher education. Age was categorized into 15-24, 25-34, 35-44, and 45-54 years. Household Size was categorized as less than 6 members and 6 and above members. Household Head was categorized as male or female. Marital Status was categorized into married and not married.
Statistical analysis
The SPSS analytic software version 25.0 Complex Samples package was used for this analysis.
Analyses were done by descriptive statistics and logistic regressions. Frequency tables and proportions/percentages were used to describe categorical variables while means and standard deviations for continuous variables. We, first of all, assessed each exposure separately for its association with the outcome variable (over-nutrition) using bivariate logistic regression and we present crude odds ratio (COR), 95% confidence interval (CI) and p-values. Exposure variables found significant at P-value < 0.225,26 were included in the multivariable model. Adjusted odds ratios (AOR), 95% Confidence Intervals (CI) and P-values were calculated with statistical significance level set at P-value < 0.05.
Results
A total of 5408 participants were included in this study. More than half of the men were married (61.2%), resided in urban areas (76.7%), had 7 or less years of education (55.9%) and lived in male-headed households (84.4%). Furthermore, majority (52.1%) of men belonged to households whose size was less than 6 people. (Table 1)
Background characteristics of Ugandan men aged 15 to 54 years as per the 2016 UDHS.
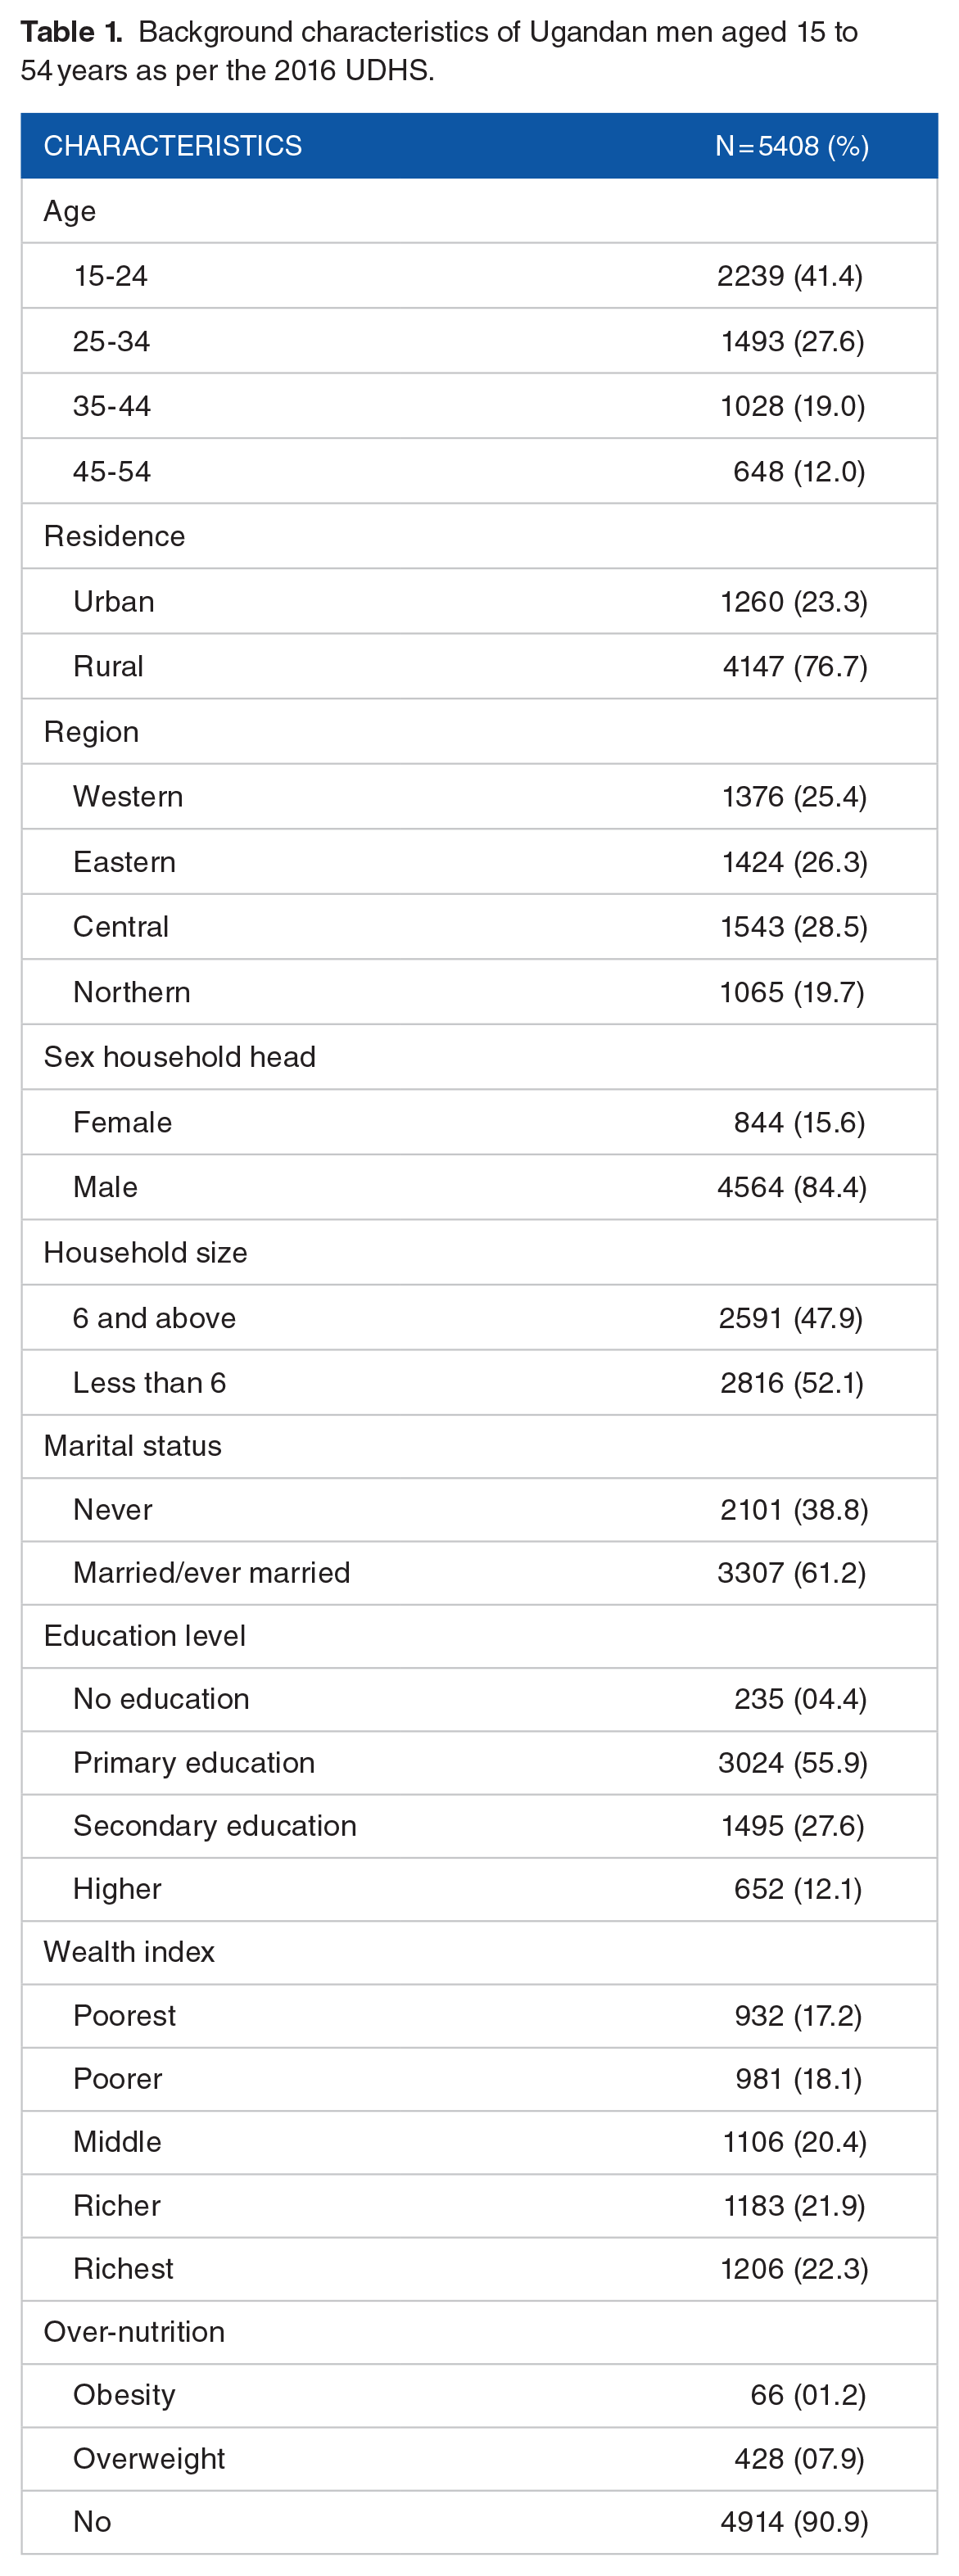
The prevalence of over-nutrition was 9.1% (95% CI: 8.3-9.9). The prevalence of overweight was 7.9% (95% CI 7.2-8.7 and obesity was 1.2% (95% CI 0.9-1.5).
Factors associated with over-nutrition
Household head, wealth index, education level, region, age, marital status, residence and household size were statistically significant factors associated with over-nutrition (P < .05) (Table 2).
Bivariable analysis of determinants of over-nutrition among Ugandan men.

At multivariable analysis, factors that were found to be associated with over-nutrition were: age, marital status, wealth index and region. Men aged 25-34 (AOR = 3.28; 95% CI: 1.92-5.59), 35 to 44 (AOR = 4.51; 95% CI: 2.61-7.82) and 45 to 54 (AOR = 4.28; 95% CI: 2.37-7.74) were more likely to be overweight compared to those aged 15 to 24 years. Married men (AOR = 2.44; 95% CI: 1.49-3.99) were two times more likely to be overweight/obese than men who were not married. Men in the central region (AOR = 1.78; 95% CI: 1.22-2.60) were 1.78 times more likely to have over-nutrition than men in the northern region. Participants who were in the middle (AOR = 2.45; 95 % CI 1.24-4.05), richer (AOR = 4.12; 95 % CI 2.27-7.51) and richest wealth-index quintiles (AOR = 9.38: 95 % CI 5.14-17.10) were more likely to have over-nutrition than those in the poorest wealth-index quintile (Table 3).
Predictors of over-nutrition among Ugandan men aged 15-54 years.
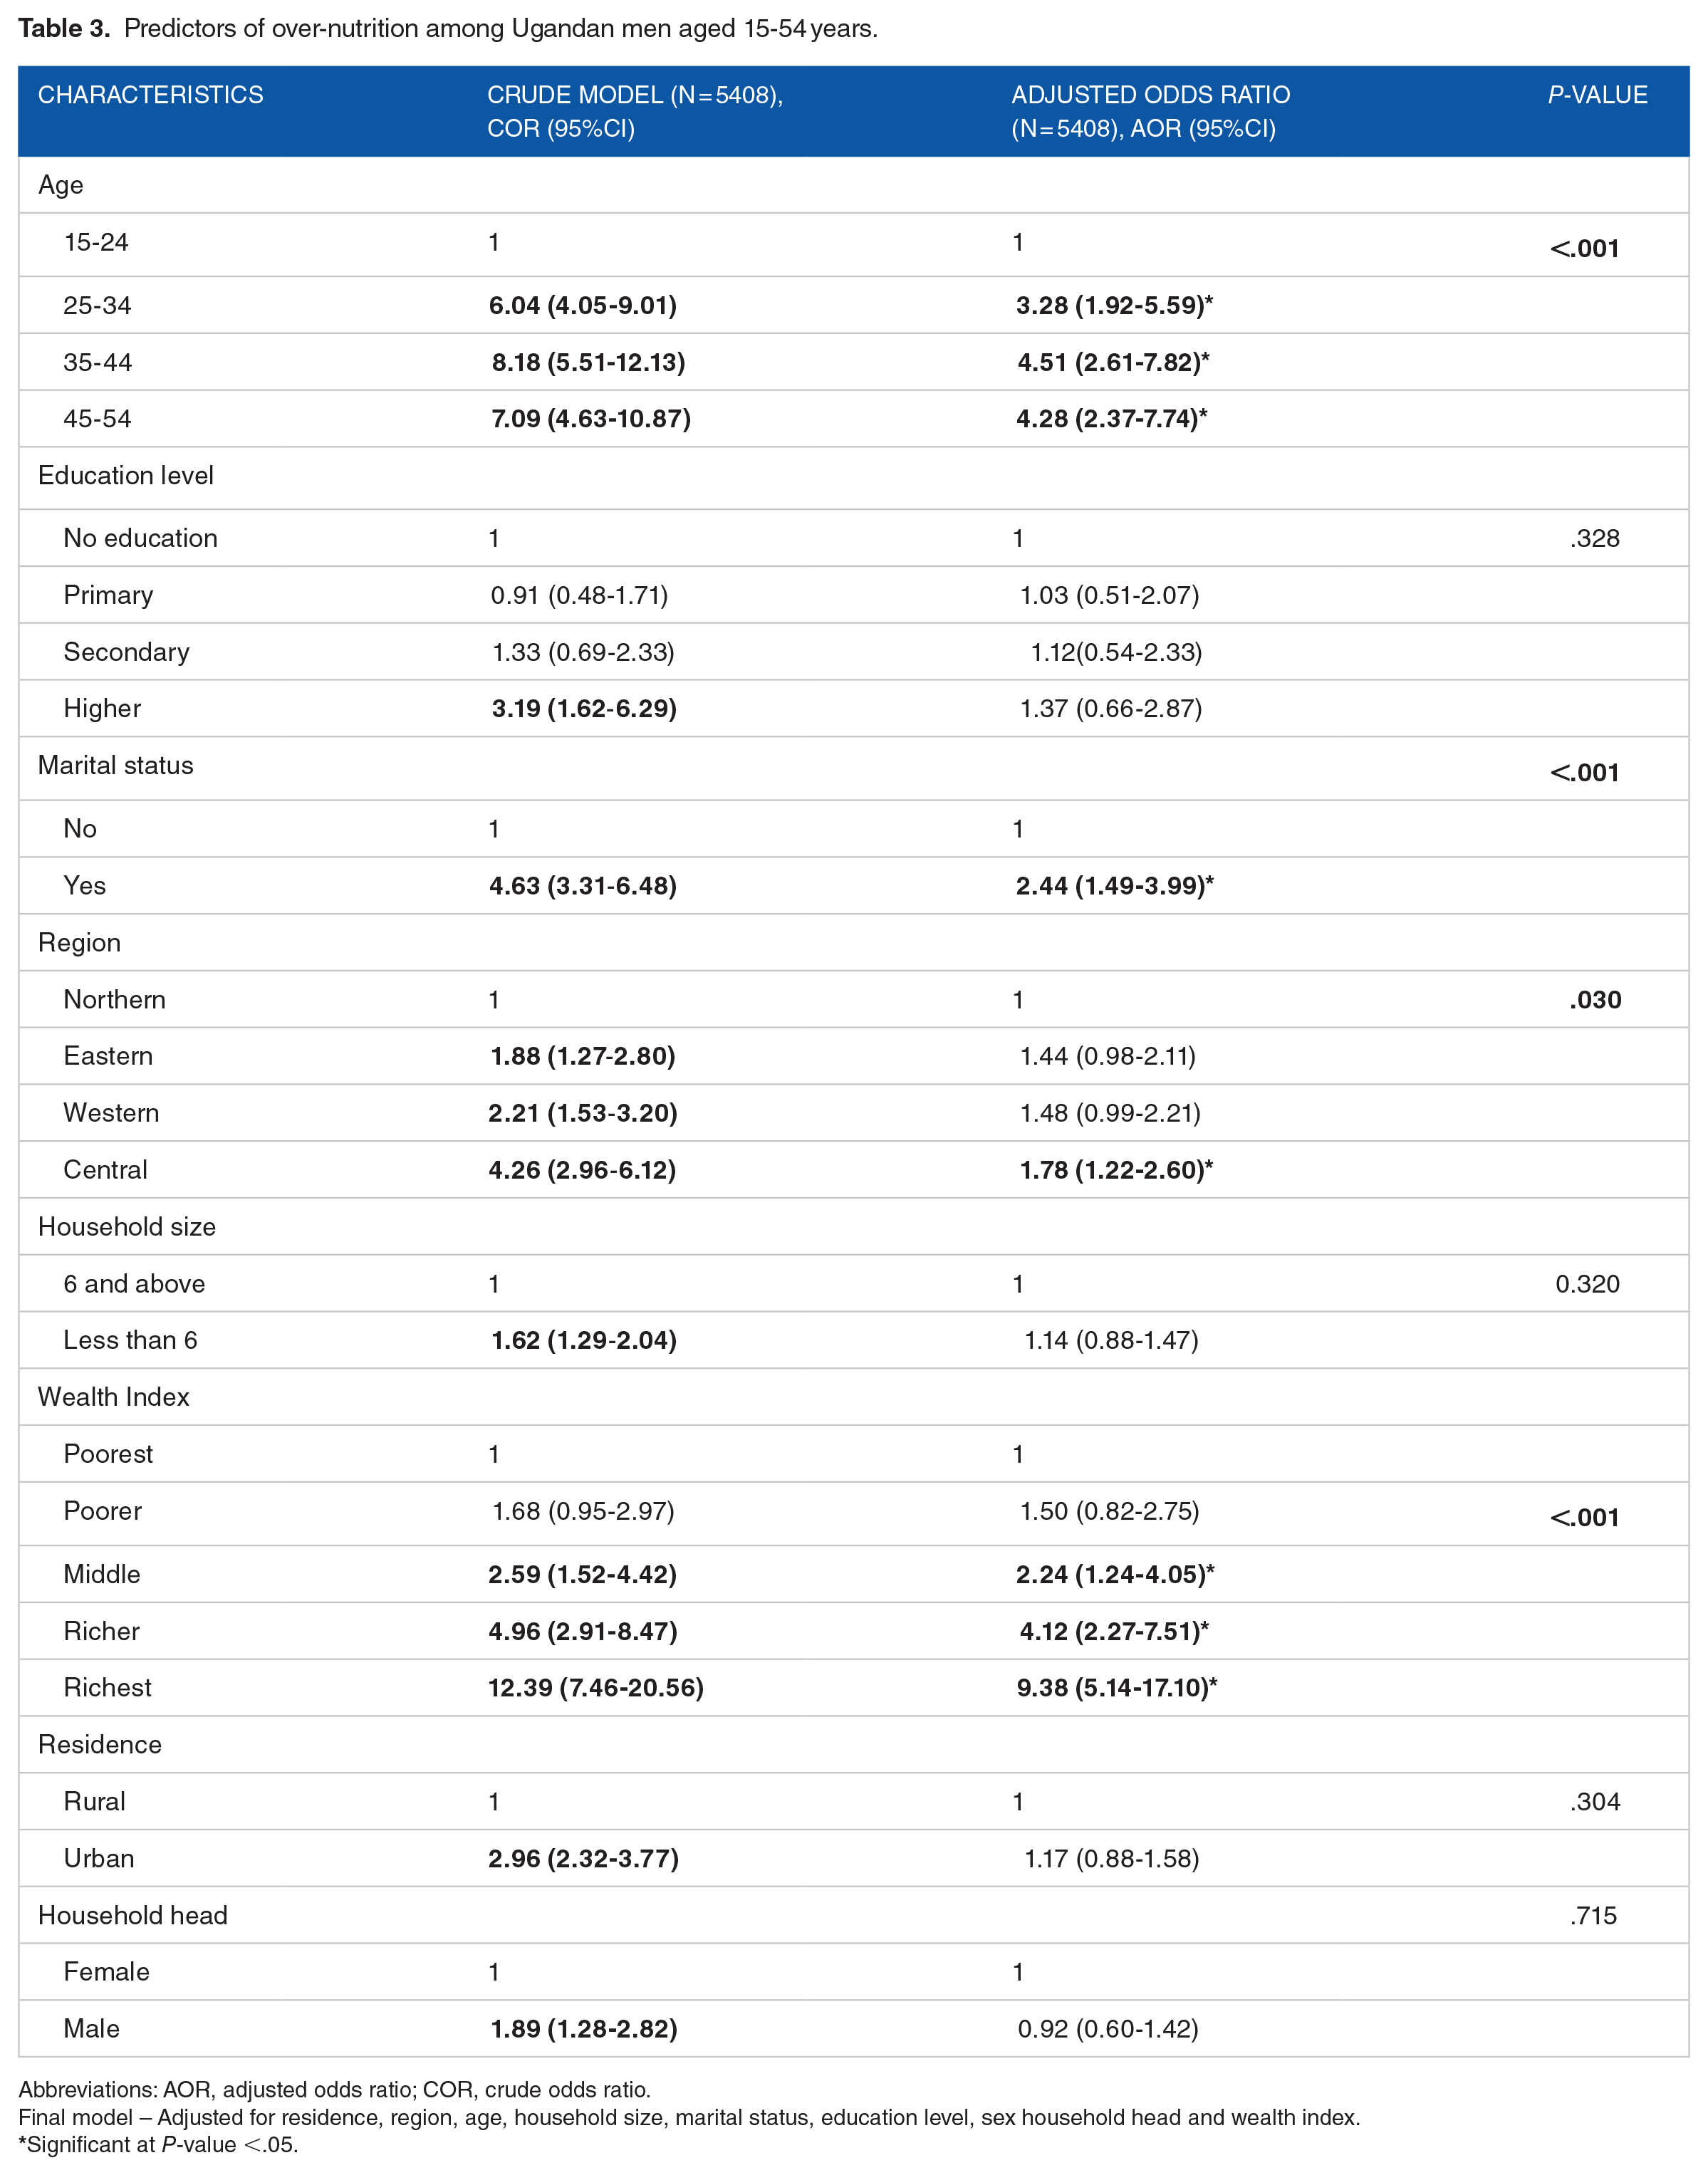
Abbreviations: AOR, adjusted odds ratio; COR, crude odds ratio.
Final model – Adjusted for residence, region, age, household size, marital status, education level, sex household head and wealth index.
Significant at P-value <.05.
Discussion
This study determined the prevalence and factors associated with over-nutrition among Ugandan men. Based on body mass index, 9.1% of the men had over-nutrition. Furthermore, 7.9% were overweight and 1.2% were obese. This could imply that about 9% of the men in Uganda maybe at risk of developing diseases and complications of having over-nutrition. This prevalence is similar to that of a study carried out in Eastern Uganda 7 where men had a prevalence of 12 % for over-nutrition. In studies carried out in Ethiopia, 27 Eastern Mediterranean Region, 28 china 3 and United states of America, 29 the prevalence of over-nutrition were higher than that in our study findings. This could be explained by the availability of affordable, high energy-dense foods due to urban sprawl, and reduced physical activity resulting into a sedentary lifestyle in these countries.
This study found an association between increasing age and having over-nutrition similar to other studies in Mozambique, 30 Uganda, 31 Eastern Uganda,7,32 Malawi, 33 Iran 21 and globally. 34 The men who were 35 to 44 years were 4.5 times more likely to have over-nutrition than those 15 to 24 years and this has been confirmed by a study in Malawi. 33 This maybe likely due to natural changes in body composition, drop in resting metabolic rate, increase in respiratory quotient and the reduction in physical activity which most likely act synergistically to create ideal conditions for the accumulation of body fat and the development of insulin resistance with age. 27
We also found that married men are more likely to have over-nutrition. The literature on the association between marital status and over-nutrition is not consistent. Some studies have reported similar positive associations between being married and gaining weight35-38 while others have reported other patterns among married participants. 39 The connection between marriage and over-nutrition in men maybe be related to changes in lifestyle practices such as reduction in time for physical exercises due to increased responsibilities and change in eating habits like more social occasions involving richer foods, or availability of more regular well prepared meals thus leading to increased intake in comparison to when one was single.40,41
Men in the central region of Uganda were 1.78 times more likely to have over-nutrition than those in the northern region. The Northern region is the poorest and most food insecure. 42 This could be due to the fact that this region witnessed a long civil war which gravely affected their food production and the economy compared to the other regions mainly central that was stable. This disruption in food production and economy led to inadequate food in both quality and quantity which predisposed them to underweight as evidenced by a most recent study by Sserwanja et al. 42
Central region has experienced a high rate of economic development and urbanization.43-45 Furthermore, evidence shows that the Central region has the highest GDP per capita while Northern region has some of the poorest districts.45,46 As a result of this development, men in the Central might have better access to improved modes of transport, employment in the formal sector with improved technologies hence sedentary lifestyles, enough household resources leading to diversification of diet by including high-calorie foods hence increased likelihood of having obesity and overweight. This is also in accordance with a study carried out in Ethiopia showing overweight and obesity being more likely in one region than another. 47
This study observed increase in over-nutrition with increase in wealth. This could due to the fact that these men could easily afford high energy-dense foods and cars as means of transport thus reduced physical activity resulting into a sedentary lifestyle as reported in a study by Newton and one in Eastern Uganda. Newton discovered most sedentary men were in the highest income countries with the ability to purchase energy foods 48 same as the study in Eastern Uganda. 7
These findings show that we need new or to improve the current nutrition policies mainly addressing over-nutrition (overweight and obesity) through introduction and encouraging use of modes of transport that favour physical exercise and education session for the rich, older men, and those in the Central region of Uganda on dangers of over-nutrition.
We also recommend further research that looks into physical activities of Ugandan men and also studies in the elderly since they were not included in our data set.
Strengths
We used a nationally representative sample and weighed the data for analysis, and thus our results are generalised to all Ugandan men aged 15 to 54 years. Standardised procedures are a requirement of DHS surveys in data collection and validated questionnaires are used, which ensures the internal and external validity of the results.
Limitations
The cross-sectional design is limited by lack of temporality; hence causality inferences cannot be made. Most data on the predictors were based on self-reporting and could not be verified through records and hence a possibility of information bias. Other significant predictors of over-nutrition such as physical activity and dietary intake, were not included in the analysis as they were not available.
Conclusion
The factors associated with overweight/obesity among Ugandan men in our study were increasing age, marital status, increasing wealth and region of origin. This shows the need for measures to abate the regional development inequalities, need to promote physical activity among older men and need to improve on the knowledge of nutrition and dietetic practices for married couples and men of different social classes.
Footnotes
Acknowledgements
We extend our gratitude to the MEASURE DHS program for providing us with the data
Funding:
The author received no financial support for the research, authorship, and/or publication of this article.
Declaration of conflicting interests:
The author declared no potential conflicts of interest with respect to the research, authorship, and/or publication of this article.
Author contributions
IKA- Came up with the idea and designed the study. Drafted the manuscript, participated in data analysis and interpretation of results.
QS – Carried out all of the statistical analysis and contributed to the writing of the paper. Also participated in designing the study.
SN- Reviewed the paper and contributed to the writing.
DM- Reviwed the paper, participated is designing the study and result interpretation.
PA- Contributed to the writing of the paper through extensive knowledge of overweight and Obesity. Reviewed the paper.
Ethics and consent
Acquired permission from the MEASURE DHS program to use the particular data set. Informed consent was N/A
Paper context
Overweight and obesity are known to affect people of all ages and backgrounds.
A group of different factors have been related to overweight and obesity; however, the data for the majority of these factors in relation to men in Uganda are still inconsistent.
Understanding these factors in relation to men in Uganda would improve the various specific interventions or responses to overweight and obesity and this knowledge benefits the Public health sector.