
Abstract
Background:
Anemia is a condition characterized by reduction in the number of red blood cells and/or hemoglobin concentration. It affects 24.8% of the world population. There is little evidence on burden of anemia among adolescents in low income countries like Ethiopia. Thus, this study aimed to assess the magnitude of anemia and factors associated with anemia among school adolescents in eastern Ethiopia.
Methods:
School based cross-sectional study was conducted among 493 school adolescents in Haramaya town during February 1 to 28, 2017. Multi stage cluster sampling technique was used. We collected anthropometric data (weight and height) and hemoglobin level of all study participants. The hemoglobin level was adjusted for altitude. Data were entered into EpiData and exported to SPSS version 20 for analysis. Logistic regression model was fitted to identify factors associated with anemia. Level of statistical significance was declared at P < .05.
Results:
In this study, the prevalence of anemia was 29.4% [95% CI: (25.6, 33.5)]. Being female adolescent (AOR = 2.31, 95 % CI: [1.51, 3.54]), adolescents attending grades 9th to 10th (AOR = 1.66, 95% CI: [1.004, 2.77]), adolescents born to illiterate mothers [AOR = 2.23, 95% CI: (1.02, 4.89)], and low dietary diversity score (AOR = 2.33, 95% CI: [1.12, 4.86]) were factors that increased the likelihood of getting anemia.
Conclusion:
Anemia among school adolescents was a moderate public health problem in the study area. Being female, lower grade levels (9th to 10th), low dietary diversity score and illiterate maternal educational status increased the likelihood of getting anemia. School based Iron/Folic acid supplementation, nutrition education and promotion of diversified foods consumption should be given attention with particular focus on female adolescents.
Introduction
Anemia is the reduction of red blood cells and/or hemoglobin (Hb) concentration.1,2 Approximately, 50% of cases of anemia are due to iron deficiency, 3 which occurs due to lack of available iron to support normal red cell production.1,3,4 World health organization (WHO), defined adolescence as the period between the ages of 10 to 19 years. 3 Requirements for all nutrients increase in adolescence while 20% of final adult height, 50% of adult weight and 45% increase in bone mass are attained in this period. 5 Adolescents makeup 20% of the total world population of which 84% are in low-income countries.3,6 About 48% of the Ethiopian population are adolescents. 7
Adolescents are at high risk of anemia due to rapid pubertal growth with a sharp increase in lean body mass, blood volume, and red cell mass. It is exacerbated by the onset of menstruation in girls.4,8 Anemia has significant adverse consequences on health, social and economic development.1,4,9
Knowledge of the degree and causes of anemia in adolescence is important, as this is a good opportunity for school-based interventions.4,10 WHO stated that adolescents are highly neglected, and hard to reach the population and thus, their need is often ignored.3,11 There was the highest prevalence of anemia in the WHO African regions reflecting the presence of high-risk factors for anemia such as malnutrition, malaria, parasitic infection, sickle cell and thalassemia.1,12 -14
Initiatives for prevention of anemia commonly target infants, young children, pregnant and lactating women, but not adolescents, so that the consequences of anemia in adolescents continued.4,15,16 There is little evidence on the burden of anemia among adolescents in low-income countries. There are few studies documented on anemia among school adolescents in Ethiopia and none is found in the study area. Thus, this study aimed to determine the magnitude of anemia and factors associated with anemia among school adolescents in Haramaya town, eastern Ethiopia.
Methods
Study design and sampling
A school-based cross-sectional study was conducted in Haramaya town from February 1 to 28, 2017. Haramaya town is located at 506 km to the east of the capital, Addis Ababa. According to the town’s administration office report, the town has a total population of 46 473 of which 23 928 were male. There were 11 947 (6017 males and 5930 females) adolescents aged 10 to 19 years in Haramaya town. 7
All adolescents (10-19 years) attending secondary (grades 9th and 10th) and preparatory (grades 11th and 12th) schools were the source population, whereas all randomly selected adolescents in the selected classes or sections of the selected secondary and preparatory schools were study population.
The sample size was calculated by using single population proportion formula, with the assumptions of; 95% confidence level, proportion (P = 15.2%) of anemia among school adolescents from a previous study, 4 a margin of error, d = 4%, design effect 1.5 and 10% non-response rate yielding the final sample size of 510.
Multi-stage cluster sampling technique was used. In the first-stage, 2 secondary schools (Haramaya & Bate) and 1 preparatory school (Haramaya) were selected by lottery method from a total of 4 secondary and 2 preparatory schools found in the town. The sample size was proportionally allocated for the 3 selected schools (215, 131 and 164 adolescents from Haramaya secondary, Haramaya preparatory and Bate secondary schools respectively. In the second-stage, the sections were selected randomly from each school and all adolescents found in the selected sections were included in the study.
Data collection and quality control
The data collection tool was developed by reviewing literatures.4,12,14,15,17 -19 It was initially prepared in English and translated into Afaan Oromoo and translated back to English by language experts to check for consistency. We collected the data on socio-demographic, dietary diversity, food frequency, health and female’s menstruation.
Five diploma nurses and 3 medical laboratory technicians collected the data while 2 BSc health officers and the investigators supervised the fieldwork. The training was given to the data collectors and field supervisors. The pre-test was conducted among 5% of the sample size (26 adolescents) and necessary modifications were done. The filed supervisors and the investigators continuously monitored the data collection process. To assure accuracy and consistency of Hemocue Hb 301, we used only the factory specified micro cuvette, and each time the machine is turned on, we checked if it passes the internal quality control (shows symbol of the machine on the display), no error message is shown and reads 0 g/dL before we put blood sample in the cuvette holder.
To minimize the intra and inter-observer’s variability of the data collector’s relative technical errors of measurement were calculated during training among 10 adolescents. The accepted relative technical measurement error for intra-observers was less than 1.5% while for inter-observers it was less than 2%. Data collectors measured twice and we took the average of the measurements for every height and weight of an adolescent. Proper function of digital weight scales was checked each time before weight measurement begins. The data collectors should assure the reading scale is exactly at zero.
Measurements
To determine the Hemoglobin (Hb) level, 10 mL of blood were taken by finger prick. The first 2 drops of blood was wiped and the second drop was used. Hemoglobin analysis was carried out using Hemocue Hb 301 analyzer.
The hemoglobin level was adjusted for altitude of the town before defining anemia by the using the formula: Hb = −0.32 × (altitude in meters × 0.0033) + 0.22 × (altitude in meters × 0.0033) 2 . Based on WHO cut off points 2 for Hb level, we defined anemia and it’s severity for adolescents sex, age group. Accordingly, for both males and females aged 12 to 14 years and females aged ⩾15 years, Hb levels of ⩾12 g/dL, 11 to 11.9 g/dL, 8 to 10.9 g/dL and <8 g/dL was defined as no anemia, mild anemia, moderate anemia and severe anemia respectively. For males aged ⩾15 years, Hb levels of ⩾13 g/dL, 11 to 12.9 g/dL, 8 to 10.9 g/dL, <8 g/dL was defined as no anemia, mild anemia, moderate anemia and severe anemia respectively. Adolescents’ dietary diversity score was calculated based on FAO guidelines 20 and classified into 3 levels as low (1-3 food groups),medium (4-5 food groups) and high (6 or more food groups). Height and weight were measured by using a portable wooden height-measuring board with a sliding head bar and portable electronic digital scales respectively. For height measurement, subjects were asked to stand erect with their shoulders level, hands at their sides, no bending at knees, the buttocks, scapulae, and head are positioned in contact with the vertical backboard with a sliding head bar. Then height was measured to the nearest 0.1 cm. Weight was measured when adolescents wear light cloths and no shoe and were recorded to the nearest 0.1 kg. Each measurement was calibrated by placing standard calibration weights on the scale to ascertain accuracy. To determine the nutritional status (wasting) of adolescents, the anthropometric data were converted into Body mass index for age (BAZ) by WHO AnthroPlus version 3.1. Accordingly, adolescents with BAZ of ⩽ –2 SD and BAZ of > –2 SD were considered to be thin (wasted) and normal respectively.
Analysis
STROBE checklist was used to analyze and report the data. Data were entered into EpiData version 3.1 and exported to SPSS version 20 for analysis. Bi-variable logistic regression was fitted to check for presence or absence of association between each independent variable and anemia. The results were reported in COR along with the corresponding 95% confidence interval (CI). Variables with a P < .25 in bi-variable logistic regression were moved to the final multivariable logistic regression model (using enter method) to control for potential confounders and to identify true predictors of anemia. The results were reported in AOR along with the corresponding 95% CI. The level of statistical significance was declared at a P < .05. Multi-collinearity was checked by using the standard error and there was no multi-collinearity.
Ethical approval was obtained from the Institutional Health Research Ethics Review Committee (IHRERC) of Haramaya University, College of Health and Medical Sciences (Ref. No. IHRERC/029/2017). Permission was obtained from the Haramaya town education office and the selected schools' directors. For adolescents <18 years, informed written consent was taken from the parents/guardians and verbal assent was asked from participants aged 15 to 19 years. Forty-seven adolescents who were severely anemic were referred and/or linked to the nearby health facilities for further diagnosis and treatment.
Results
Socio-demographic characteristics
A total of 493 school adolescents participated in this study making a response rate of 96.6%. Overall 321 (65.1%) respondents were males. The age of adolescents ranged from 14 to 19 years with mean ± SD of 16.99 ± 1.33 years. The majority, 376 (76.3%) were Oromo, 471 (95.5%) were single, 364 (73.8%) were attending grades 9th or 10th, and 480 (87.2%) live with their parents (Table 1).
Socio-demographic characteristics of school adolescents and their family in Haramaya town, eastern Ethiopia, 2017 (n = 493).

Gurage, Hadiya and Somali.
Prevalence of anemia
The prevalence of anemia was 29.4% (95% CI: [25.6, 33.5]) of which 38 (7.7%), 60 (12.1%) and 47 (9.6%) study participants had mild, moderate and severe anemia respectively. Among anemic school adolescents, 142 (97.9%) were in the age group of 15 to 19 years and only 6 (4.1%) were wasted or thin (Table 2).
Prevalence of anemia among school adolescents in Haramaya town, eastern Ethiopia, 2017 (n = 493).

Factors associated with anemia
Multi variable logistic regression revealed that being female adolescent (AOR = 2.31, 95% CI: [1.51, 3.54]), adolescents attending grades 9th to 10th (AOR = 1.66, 95% CI: [1.004, 2.77]), adolescents born to illiterate mothers (AOR = 2.23, 95% CI: [1.02, 4.89]) and low dietary diversity score (AOR = 2.33, 95% CI: [1.12, 4.86]) increased the adolescents likelihood of getting anemia (Table 3).
Factors associated with anemia among school adolescents in Haramaya town, eastern Ethiopia, 2017 (n = 493).
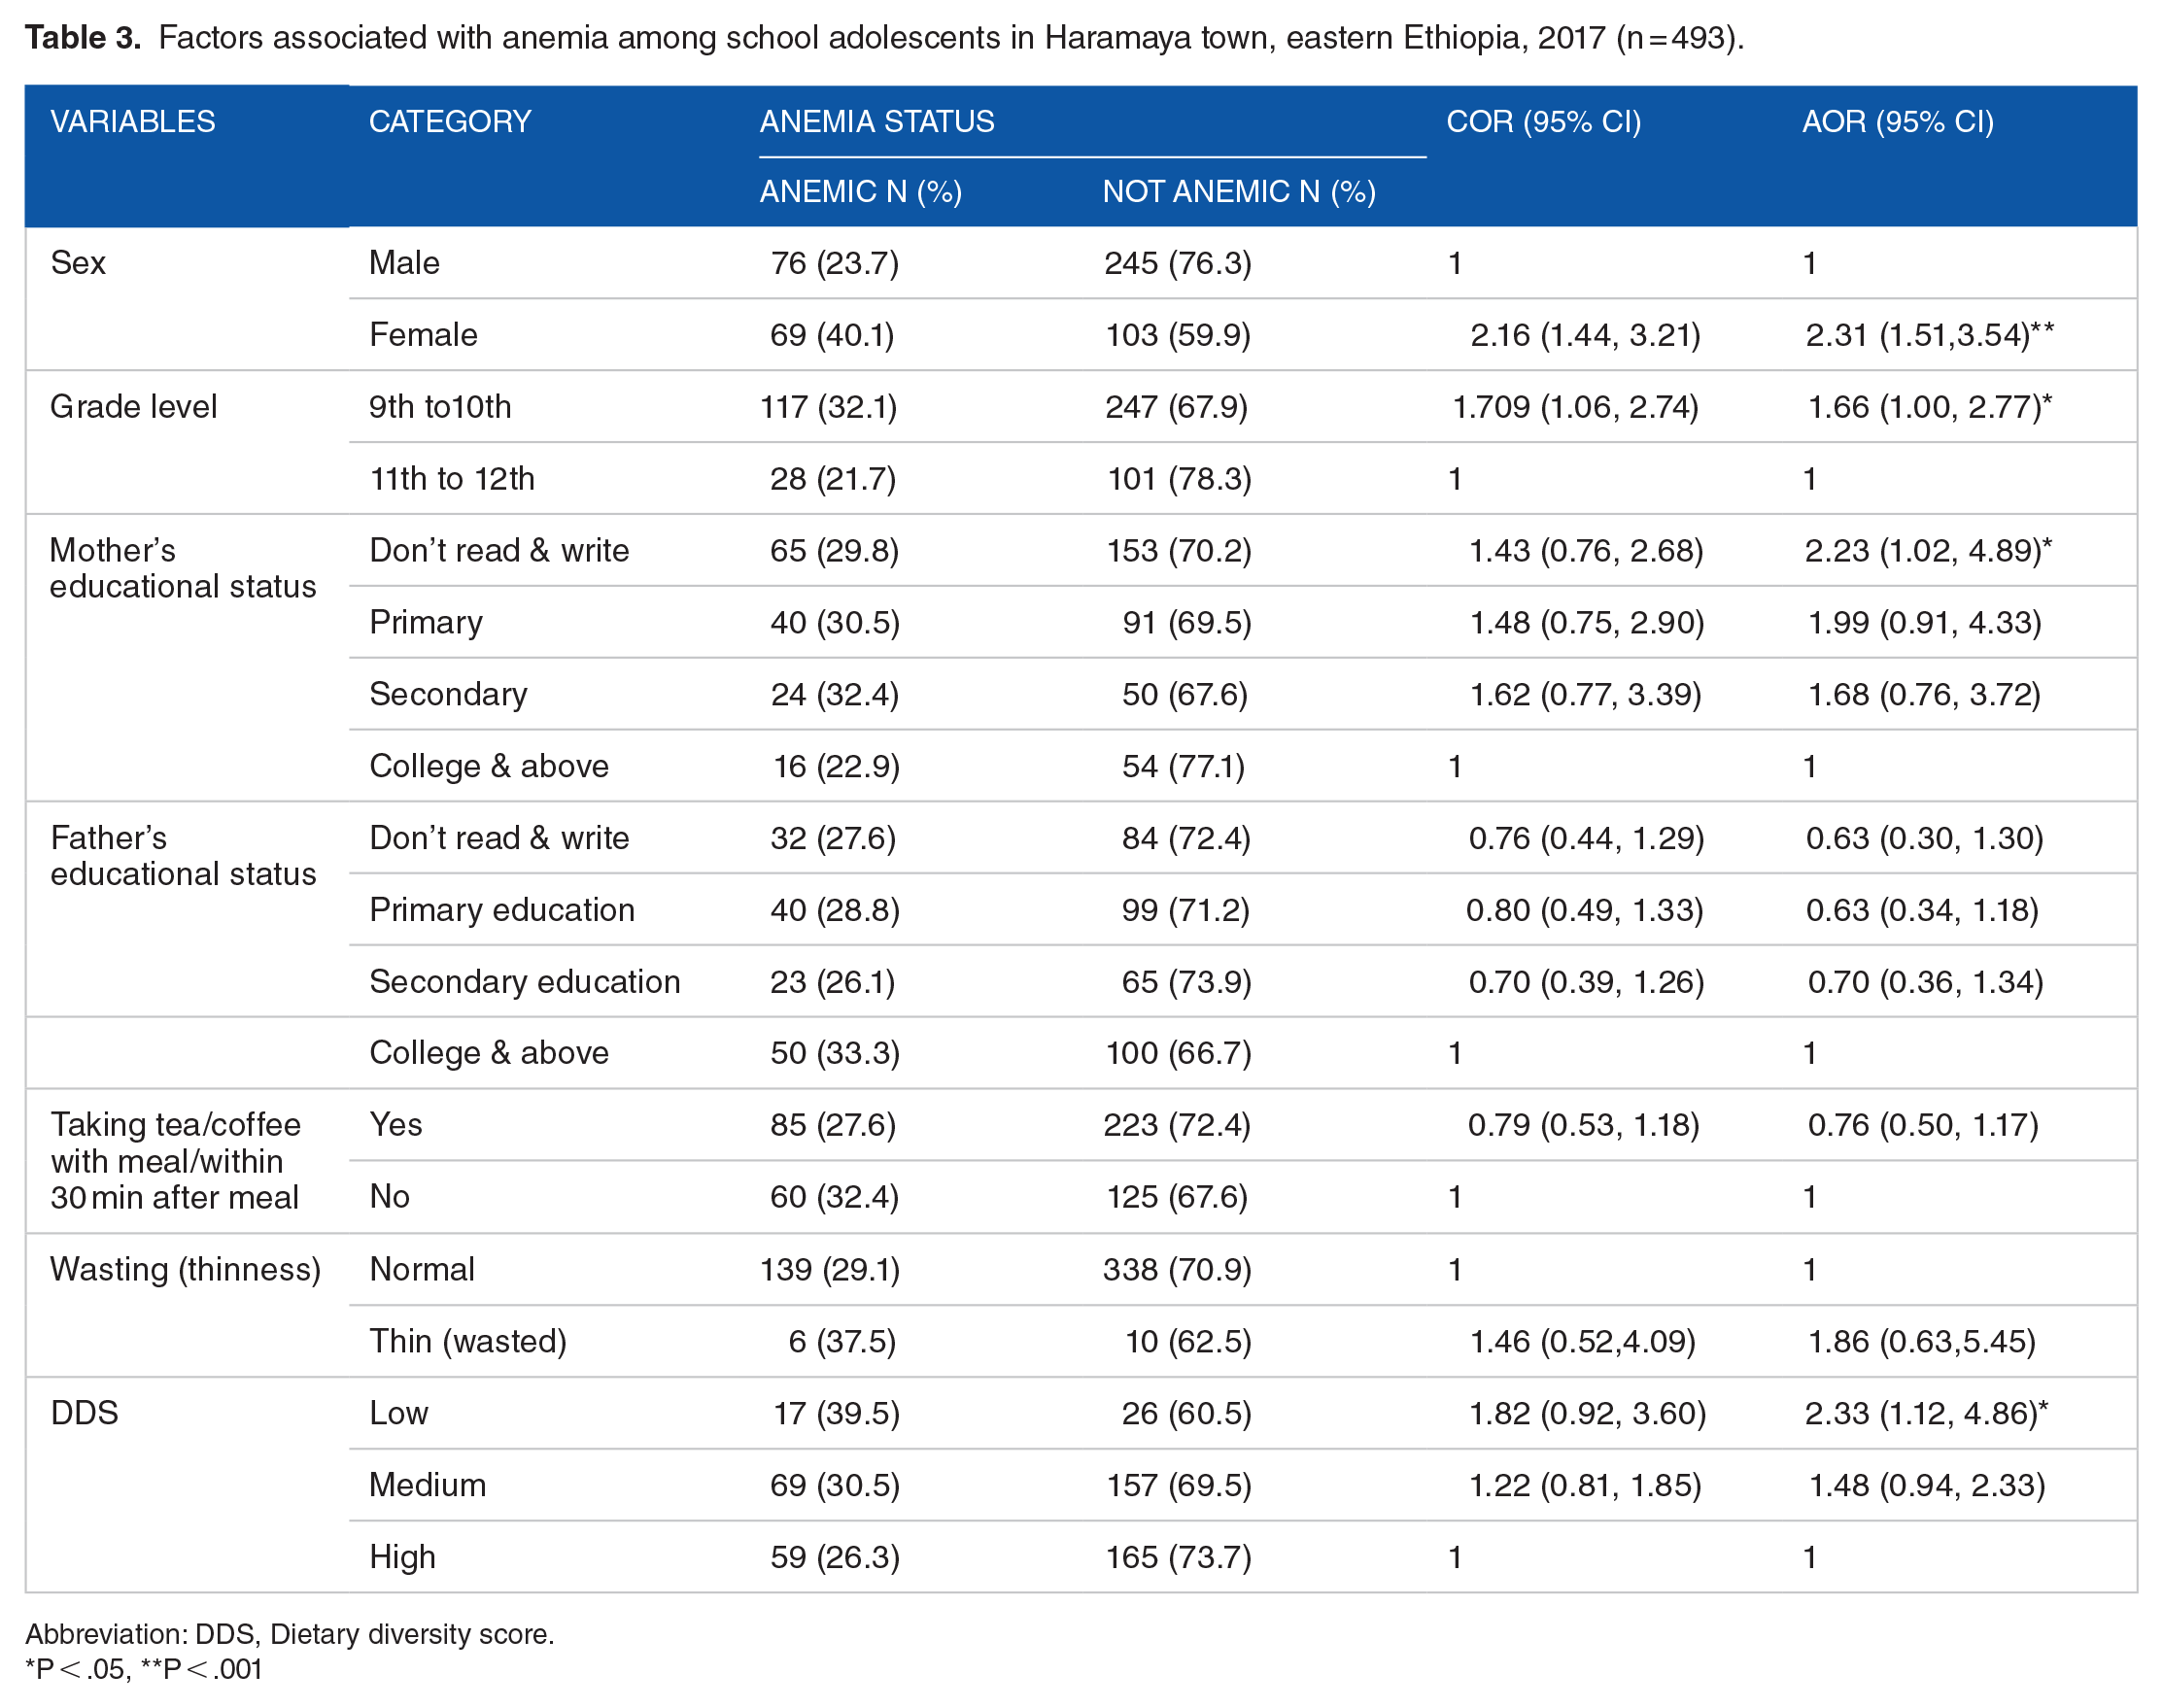
Abbreviation: DDS, Dietary diversity score.
P < .05, **P < .001
Discussion
The prevalence of anemia among school adolescents was found to be a moderate public health problem according to WHO criteria. Being female, maternal educational status, attending lower grade levels (9th to 10th) and having lower dietary diversity scores were factors that increased the likelihood of getting anemia among school adolescents.
The prevalence of anemia among school adolescents in Haramaya town was 29.4%. This finding is higher than the findings of a study in Bonga town (15.2%), 4 Barahle district of Afar region (22.8%) 15 and Ethiopian national survey (13.4% for females and 17.9% for males). 18 This variation might be due to the differences in geographical location, adolescents’ dietary habits and the difference in the study population.
The finding of this study is almost comparable to the reports from Babile district, Ethiopia (32%), 16 Kersa district, Ethiopia (27.1%), 21 and study in Siaya district, Kenya (26.5%). 14 The prevalence of anemia in the current study is lower than findings from the Haryana district of India in which 73% 22 of adolescent girls were anemic. The difference could be attributed to differences in sampling techniques, study area and subjects or variation of cultural, socio-economic and demographic factors. This could be because Ethiopia is known to have teff, and cereals rich in Iron 23 that contains relatively higher Iron (>150 mg Fe/100g of teff) 24 than other developing African and Asian countries.
In this study, female school adolescents were 2.3 times more likely to have anemia than their male counterparts. This is in line with the study conducted in Bonga town. 4 This might be related to blood loss during their menstrual cycle in females and such heavy menstrual blood loss might put them at greater risk of anemia than males.
Adolescents attending grades 9th to 10th were 1.6 times more likely to have anemia as compared to those attending grades 11th to 12th. This finding is similar to the finding from the urban Slums of India. 25 This could be due to the fact that the more adolescents are educated, the more likely they get and understand information about anemia its prevention methods and practice it.
School adolescents whose mothers were unable to read and write were 2.2 times more likely to be anemic than those whose mother’s educational status was college and above. It gives more sense that when mothers are more educated they better know about and provide a balanced diet to their family.
In this study, school adolescents with low dietary diversity scores were 2.3 times more likely to get anemia as compared to those with high DDS. This finding was supported by a study done in Tigray, north Ethiopia. 26 This is to mean that adolescents who consumed less quality and undiversified diet are more likely to be anemic since the nutrient quality increases as diet variety increases.
The strengths of this study include the use standardized FAO guideline to assess dietary diversity, WHO cut off for Hb determination, and standard procedures in anthropometric measurement among others. But, this study has got some limitations. Since this was a cross sectional study, the temporality could not be assured. Some explanatory variables such as worm infestation and malaria were assessed by history and not laboratory based. In addition, for Hb measurement, we used Hemocue Hb 301 which could increase Hb level by 0.5 to 6 g/L 27 and this might have resulted in under estimation of anemia in this study.
Conclusion
This study revealed that anemia among school adolescents in Haramaya town was a moderate public health problem. Being female adolescent, lower grade levels (9th to 10th), low dietary diversity score and illiterate maternal education increased the likelihood of getting anemia among school adolescents. Therefore, school-based Iron/Folic acid supplementation, nutrition education, promotion of Iron-rich and diversified foods should be for female adolescents and improve adolescents' nutritional status.
Footnotes
Acknowledgements
The authors are thankful to Haramaya University, Haramaya town administrative and education offices, selected schools’ principals and teachers, study participants, data collectors and field supervisors for their inputs into this study.
Authors’ contributions
SGF, GE and YD conceived the study idea, developed the tools, collected and analyzed the data, and wrote the manuscript. FAK and BAM also participated in the design of the study and tool development, analyzed the data and drafted the manuscript.
Declaration of conflicting interests:
The author(s) declared no potential conflicts of interest with respect to the research, authorship, and/or publication of this article.
Funding:
The author(s) disclosed receipt of the following financial support for the research, authorship, and/or publication of this article: Haramaya University has funded this research. We declare that the funding body has no role in the designing of the study, in the collection, analysis, and interpretation of the data, in the writing of this manuscript.