
Abstract
Background:
Improving cancer screening participation is increasingly important. However, insufficient medical and financial resources have been reported to hinder program implementation; therefore, enhancing program efficiency is crucial. Although demographic factors have been reported to correlate with public health program efficiency, it remains unclear whether this applies to cancer screening.
Objectives:
To evaluate the efficiency of cancer screening programs conducted in Japanese municipalities and analyze their relationship with demographic characteristics, including population size and aging rates.
Design:
A cross-sectional study using national open-source data from 2019.
Methods:
We collected data from all 1741 Japanese municipalities in 2019 using a national open-source database. After applying inclusion criteria, 1593 municipalities were analyzed. Program efficiency was measured using Data Envelopment Analysis (DEA), with inputs including the number of public health nurses, medical institutions, and healthcare expenditure per target population. Outputs were cancer screening participation rates. Logistic regression was used to examine the relationships between efficiency, population size, aging rates, and their interaction.
Results:
Of the 1593 municipalities analyzed, 414 (26.0%) were deemed efficient. A statistically significant interaction between aging rates and population size was observed in the model predicting screening efficiency. In municipalities with aging rates above 31.4% (95% confidence interval [CI]: 29.2-37.1), larger target populations were associated with lower efficiency. Conversely, in municipalities with over 1075 screening targets (95% CI: 552-1381), higher aging rates were linked to lower efficiency.
Conclusion:
This study suggests that aging rates and population size may be associated with municipal-level differences in the efficiency of cancer screening programs. Understanding the mechanism underlying this relationship could help inform resource allocation and program design. Further research is warranted to explore these relationships more deeply and to support the development of more efficient screening strategies, particularly in the context of ongoing demographic shifts.
Keywords
Introduction
Background
Evidence demonstrates that cancer screening plays a crucial role in detecting early-stage cancer and reducing cancer-related mortality. 1 To maximize the benefits of screening, achieving and maintaining high participation rates is essential. However, financial and medical resource constraints have been shown to negatively affect participation rates in cancer screening programs.2,3 It is also reported that limited resources at the level of screening administrative units can hinder their capacity to promote and implement screening programs effectively, resulting in reduced screening participation rates. 4 This issue concerning healthcare programs and resource availability could pose a global challenge, as projections highlight significant and enduring shortages in healthcare personnel and resources worldwide. For example, many OECD countries are projected to face severe shortages in their medical workforce by 2030, with an average insufficiency of 8.5% for doctors and 22.7% for nurses. 5 These challenges would highlight the need to evaluate cancer screening programs through the lens of their resource utilization.
Reports indicate that resource shortages may restrict the capacity of screening programs by limiting the number of participants. In Greece, for example, severe financial constraints led the government to impose restrictions on cancer screenings to control healthcare costs. These restrictions included setting upper limits on prescribed screenings for cancers such as breast, prostate, and uterine, as well as budget caps on screenings based on medical specialty and location. 6 A similar limitation was reported at the municipal level in Japan, where 235 out of 607 surveyed municipalities imposed upper limits on screening participants due to insufficient medical capacity and budget constraints. 7 These examples underscore the broader challenge of resource limitations in cancer screening programs. In resource-constrained environments, improving participation rates efficiently within the limits of available resources is crucial. Despite growing recognition of the need to optimize healthcare resource allocation, research on the efficiency of cancer screening programs remains limited, particularly at the level of individual administrative units. Examining program efficiency at this level could provide valuable insights, as these units play a critical role in decision-making, promotion, and management of cancer screenings.
To calculate program efficiency, Data Envelopment Analysis (DEA) is one of the most widely used methods in economic research. 8 It has also seen growing applications in healthcare settings, where it is increasingly utilized to evaluate performance. 9 DEA calculates efficiency as a score by comparing the relative performance of decision-making units (DMUs), such as municipalities or healthcare providers, based on the resources they use (inputs) and the outcomes they achieve (outputs). One of the key advantages of DEA is its ability to accommodate multiple inputs and outputs simultaneously, making it particularly suitable for analyzing complex systems with diverse resource requirements and outcomes, such as cancer screening programs. These unique features position DEA as a valuable tool for understanding healthcare resource utilization and guiding strategies to improve program efficiency in a variety of settings.
Previous studies have suggested a potential positive relationship between program efficiency and target population size in administrative services, such as vaccination and maternal health programs.10,11 This relationship is often attributed to economies of scale, which refers to the concept that increasing the scale of a program leads to a more efficient utilization of resources. For example, larger programs can distribute fixed costs, like infrastructure and administration, over a greater number of participants, reducing the cost per service. They may also benefit from streamlined workflows and better resource allocation as scale increases. While it remains unclear whether this relationship applies to cancer screening programs, exploring this possibility could yield valuable insights into improving their efficiency and developing strategies to effectively increase participation rates.
When analyzing the relationship between program efficiency and population size, it is crucial to consider aging rates. Previous studies have demonstrated that rural municipalities with smaller populations often have higher aging rates. 12 Additionally, 2019 data from Japan showed that municipalities with populations below 50 000 had an average aging rate of 35%, compared to 25% in those with populations exceeding 200 000. 13 Furthermore, municipalities with higher aging rates might face unique challenges, such as reduced resident mobility and increased healthcare demands, which could further impact the efficiency of screening programs. Thus, aging rates may influence both population size and program efficiency and may ultimately serve as a confounding factor in their relationship. However, how aging rates interact with program efficiency and population size remains underexplored, and there is a lack of previous studies addressing the relationship between program efficiency and aging rates. Therefore, by incorporating aging rates into this analysis, the study seeks to account for these variations and provide deeper insights into their influence on screening efficiency. Such insights could serve as a foundation for future research aimed at optimizing cancer screening programs across diverse and changing demographic contexts.
Objectives
The study’s objective was to calculate the efficiency of cancer screening programs and examine their relationship with municipal characteristics, such as population size and aging rate, using data from Japanese municipalities. This study aims to contribute to the understanding of challenges in improving cancer screening efficiency in resource-constrained or aging communities.
Methods
Study Design and Subjects
This ecological study utilized open data from local governments in Japan. The study subjects were the 1741 basic local governments (cities, wards, towns, and villages) in Japan as of 2019. Cities, towns, and villages were primarily classified by population size, while wards refer to the 23 special wards in central Tokyo, the capital of Japan. Of the 1741 local governments included in this study, five towns and villages jointly conducted cancer screening programs as a municipal coalition. 14 Thus, their data were combined and treated as a single local government. In addition, DEA cannot directly handle data with a value of zero, and it is recommended to exclude such data. 15 Consequently, the samples containing data with a value of zero were excluded. As this study was based on a nationwide ecological analysis including all 1741 municipalities in Japan, no a priori sample size or power analysis was conducted. Although this may be perceived as a limitation in terms of formal study design, it is acknowledged and discussed accordingly in the Discussion section.
Cancer Screening Programs
In Japan, population-based cancer screening programs are primarily planned and implemented by municipalities. These programs are provided through both public and private clinics commissioned by the municipalities. While cancer screening is also provided in workplace settings by employment-based insurers, these screenings are not standardized or mandated by national policy and are offered voluntarily as part of employee welfare initiatives. 16 As a result, not all insurers provide such services, and the target populations and modalities vary across employers. Moreover, data on employment-based screenings are not systematically collected or aggregated at the national level, and therefore could not be included in the present study. In addition, many private health check-up services are available outside of the public healthcare system. These services often include cancer screening but vary widely in content, frequency, and cost. 16 Importantly, they are not subject to any national quality assurance standards or regulations, and data on their utilization are fragmented and not publicly available. Given the lack of standardization and transparency, such services were also excluded from this analysis.
This study focused on stomach, lung, colorectal, breast, and cervical cancer screening programs, which are recommended for population-based screening in Japanese guidelines.16-19 For gastric cancer screening, the number of participants undergoing gastric X-ray and endoscopic examinations was combined and analyzed as the total number of participants in this study. For lung cancer screening, both chest X-ray and sputum cytology are recommended in the national guidelines; however, sputum cytology was excluded from this study due to variations among screening providers in their definition of heavy smokers, the target population for this examination, making consistent population-level estimation difficult. An overview of each screening program is provided below in Table 1.
Overview of Cancer Screening Programs in Japan.

Only for heavy smokers. The definition of a heavy smoker is based on the Brinkmann index of the examinee. The thresholds are not fixed and may vary by provider, and therefore this variable was excluded from the analysis.
Data Collection
In this study, we collected data from each local government through e-Stat, a public database operated by the Statistics Bureau of Japan. 20
(1) Variables related to local government resources: The number of public health nurses in each local government as of 2019 (from the Survey on Public Health Nursing Activities 21 ), health service expenditure (from the Survey on Local Government Finance 22 ), and the number of medical institutions (from the Survey of Medical Institutions 23 ). Health service expenditure includes costs related to health promotion and hygiene services, such as cancer screening programs provided by local governments. The number of medical institutions was calculated as the total number of hospitals and clinics in each municipality, excluding psychiatric institutions, which typically do not handle cancer screenings.
(2) Age-stratified number of participants and target populations for cancer screenings in 2019: For stomach, breast, and cervical cancer screenings, which are recommended to be undertaken once every 2 years, the number of participants is generally calculated in Japan using the following formula:

This approach reflects the biennial screening interval recommended in national guidelines and prevents double-counting individuals who were screened in both years. Accordingly, we adopted this method to calculate the number of participants for these cancer types in this study. In contrast, for lung and colorectal cancer screenings, which are recommended annually, the number of participants was simply based on the number of participants recorded in the current year. The participation rate was calculated by dividing the number of participants by the target population for each cancer screening program, in accordance with national guidelines. 16
In this study, we defined the total screening target population as the number of residents eligible to receive at least one type of cancer screening offered by municipalities. To calculate this population, we applied the following formula:

In Japan, lung cancer screening targets all eligible individuals aged 40 and above; breast cancer screening targets only women in this age group; and cervical cancer screening targets women aged 20 and above. Therefore, the formula above yields the total number of screening-eligible men aged ⩾40 and women aged ⩾20, which corresponds to the population eligible for at least one type of municipal cancer screening in Japan.
In addition, for the sensitivity analysis restricted to populations aged 75 years or younger, we aggregated the number of participants and the target population by age group, and calculated participation rates and the total screening target population using only the age strata under 75 years.
Data Envelopment Analysis
We evaluated the efficiency of cancer screening programs for each local government using DEA.26,27 DEA calculates efficiency by dividing the weighted sum of the output variables by the weighted sum of the input variables. Input variables represent the resources invested in the program by each DMU, and output variables represent the program outcomes. DEA can handle multiple input and output variables simultaneously, allowing for the evaluation of overall program efficiency by comparing the resources used (inputs) to the outcomes achieved (outputs).
This study employed an output-oriented DEA model, which evaluates how effectively each DMU can maximize outcomes given the available resources. 28 The input variables were the number of public health nurses, the health service expenditure, and the number of medical institutions per target population for screening. Health service expenditure, which includes the costs of cancer screening programs, reflects the size of the budget that can be allocated to these programs. These variables were selected based on prior studies reporting that screening participation is influenced by the number of public health nurses and the financial resources of local governments.2,3 The number of medical institutions was used as an indicator of medical access, which has been reported to positively impact screening participation rates.29,30
Although these variables are not exclusively used for cancer screening, they represent essential public health resources that support the delivery of screening programs. This aligns with one of the fundamental premises of DEA, which does not require a prespecified functional form or direct causal relationship between inputs and outputs, but instead evaluates how efficiently available resources are converted into outputs.31,32 This flexibility makes DEA particularly suitable for evaluating public health programs, where inputs and outputs may be related through complex mechanisms rather than direct causality. Thus, these variables were considered acceptable as inputs in DEA and appropriate for capturing the broader resource environment that influences program implementation.
The output variables in this study were the participation rates in five cancer screening programs (stomach, lung, colorectal, breast, and cervical cancer), which were used as direct indicators of program reach and uptake. These rates reflect the ability of municipalities to deliver screening services to their target populations and are commonly used as performance indicators in national and international evaluations of screening programs. Mortality or morbidity outcomes were not included, as they are affected by factors beyond the scope of screening implementation—such as disease prevalence and treatment quality—and would not appropriately reflect the operational efficiency of the screening programs themselves.
Efficiency scores were calculated using the Free Disposal Hull (FDH) model. 33 Unlike conventional DEA models, the FDH model does not assume convexity of the production possibility set, making it more suitable for evaluating efficiency when the output variables are expressed as ratios. This is particularly relevant in our study, as the screening participation rate is a ratio-scale variable bounded between 0 and 1.
To assess the potential influence of age structure on efficiency scores, we also conducted a sensitivity analysis restricted to the population aged 75 years or younger. A separate DEA model was run using the same input and output variables but recalculated the participation rates based only on the younger population segment. This additional analysis was intended to address concerns that including older individuals—who may have a lower propensity to participate due to comorbidities or limited expected benefit—could bias efficiency estimates and obscure inter-municipality differences in screening implementation.
Statistical Analysis
We evaluated the relationship between the aging rate and the total target population for cancer screening using Pearson’s product-moment correlation analysis. The target population was log-transformed before analysis because it followed a power distribution. Logistic regression analysis was conducted with the efficiency score as the dependent variable and the aging rate and log-transformed target population as explanatory variables to examine the relationship between these variables. Interactions between explanatory variables were also considered in the analysis. The explanatory variables were centered before being used in the analysis to address multicollinearity. The variance inflation factor (VIF) was calculated using the car package in R, 34 which provides diagnostic tools for regression models. Since the maximum VIF was <1.7, multicollinearity was considered acceptable. To assess the robustness of the results, a sensitivity analysis was also performed using age-restricted data (⩽75 years), applying the same regression model structure. Statistical significance was set at P < .05. Analyses were performed using R version 4.2.2 (R Core Team, Vienna, Austria) 35 and the Benchmarking package version 0.32. 36
Results
Characteristics of the Variables
A total of 1741 municipalities were initially collected. After merging coalition-based providers, 1737 unique screening providers were identified. As shown in Figure 1, 71 providers were excluded due to missing data on screening participation, 72 were excluded due to zero values in key variables, and one was excluded due to a participation rate exceeding 100% in a specific age group. After this sequence of exclusions, 1593 municipalities remained eligible for analysis. Table 2 summarizes the characteristics of the target municipalities, categorized by population size using thresholds of 200 000, 50 000, and 10 000. The screening participation rates shown in Table 2 refer to the proportion of individuals who participated in each cancer screening program out of the target population for that specific program. The overall median aging rate was approximately 33%, with small municipalities reaching 39% and large municipalities at 26%. The number of public health nurses and health service expenditures were highest in small municipalities (151.6 per 105 screening-eligible people and 2403.5 JPY per capita, respectively). In contrast, the number of medical institutions 105 screening-eligible people was highest in large municipalities. Screening participation rates tended to be higher in municipalities with smaller populations. In large municipalities, screening rates ranged from 5.8% for gastric cancer to 13.1% for cervical cancer, whereas in small municipalities, rates ranged from 13.3% for gastric cancer to 20.2% for breast cancer. Additionally, a negative correlation (r = −.63, 95% CI: −0.66 to −0.60, P < .001) was observed between the log-transformed number of screening targets and the aging rate.

Data were collected from all 1741 basic local governments in Japan in 2019. Five towns and villages that jointly conducted cancer screening as a municipal coalition were treated as a single unit. Samples with zero values were excluded, as Data Envelopment Analysis (DEA) requires positive input and output values. The final analysis included 1593 local governments.
Characteristics of Municipalities by Population Level.

Abbreviations: IQR, interquartile range; JPY, Japanese Yen.
Values are presented as median [IQR]. 1 USD = 109.67 JPY (as of January 1, 2019).
Large: population >50 000; Medium-large: population between 50 000 and 200 000; Medium-small: population between 10 000 and 50 000; Small: population <10 000.
Refers to the number of people eligible for at least one type of cancer screening, which was calculated using the screening target populations for lung, breast, and cervical cancer screenings.
To assess the potential influence of age structure on efficiency scores, we also constructed an alternative dataset limited to individuals aged 75 years or younger for sensitivity analysis. The characteristics for this subgroup are shown in Supplemental Table 1.
Data Envelopment Analysis
Table 3 presents the characteristics of the municipalities classified by their efficiency scores calculated using DEA. The analysis revealed that 26.0% of the municipalities achieved an efficiency score of 1, indicating that these municipalities implemented their screening programs with optimal resource utilization. These municipalities had lower aging rates, with a standardized mean difference (SMD) of 0.64, and relatively higher numbers of screening targets and total populations, both with an SMD of 0.33, compared to municipalities with lower efficiency scores. Additionally, these efficient municipalities had fewer public health nurses, lower health service expenditures, and fewer medical institutions per screening target (SMD = 0.28, 0.17, and 0.33, respectively), though the observed differences were small. Notably, municipalities classified as efficient exhibited higher cancer screening participation rates across all cancer types compared to inefficient municipalities. In efficient municipalities, screening rates ranged from 13.3% for gastric cancer to 19.3% for breast cancer, while in inefficient municipalities, the rates ranged from 9.2% to 11.8%. The SMDs for these rates ranged from 0.54 to 0.68, indicating notable disparities between the two groups. To examine the robustness of these findings, we conducted a sensitivity analysis using a dataset restricted to populations aged under 75 years. The results of this analysis are presented in Supplemental Table 2.
Results of Data Envelopment Analysis, Comparing Efficient and Not Efficient Municipalities.
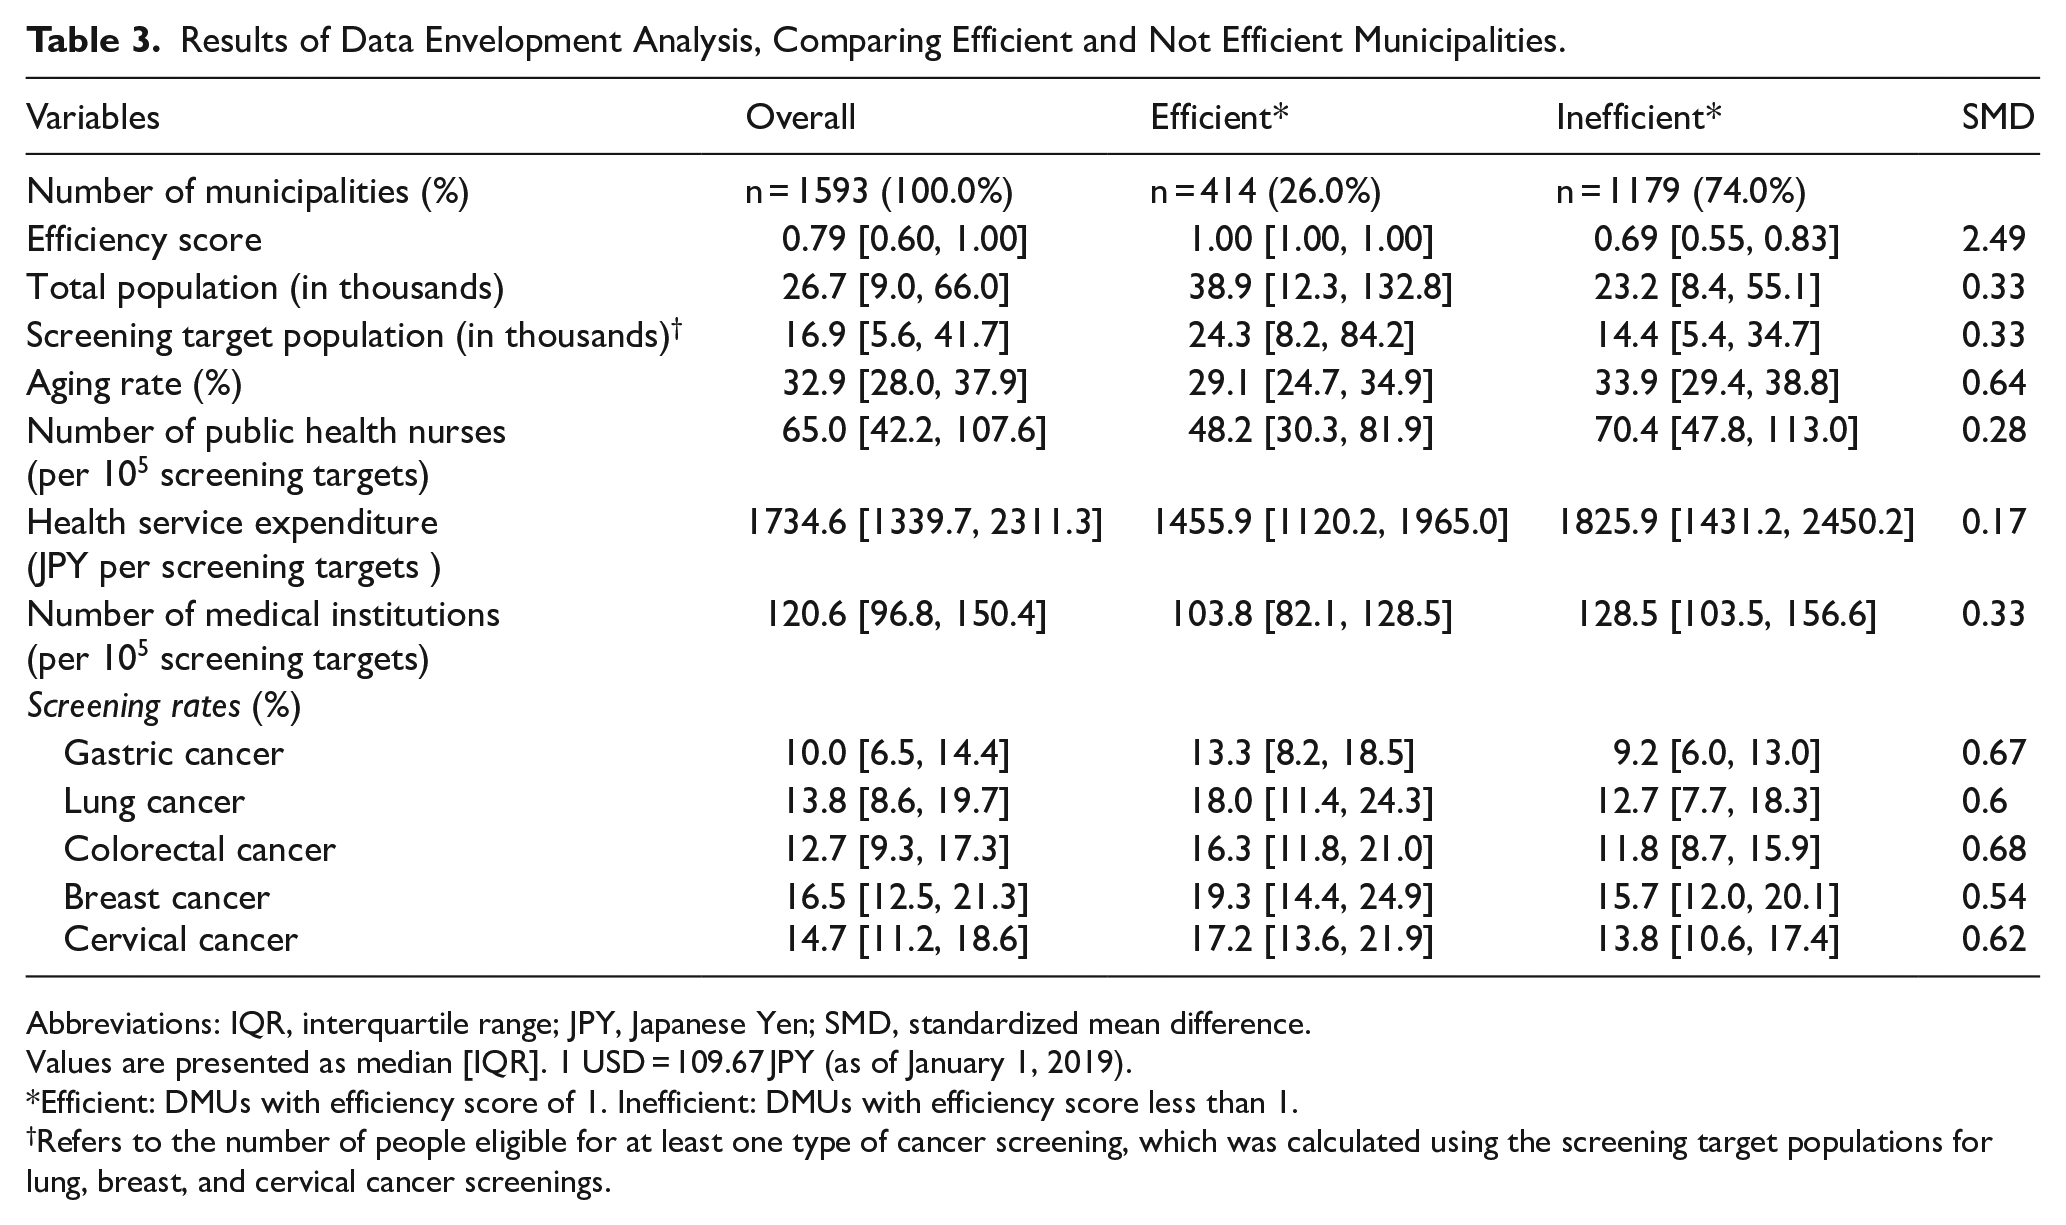
Abbreviations: IQR, interquartile range; JPY, Japanese Yen; SMD, standardized mean difference.
Values are presented as median [IQR]. 1 USD = 109.67 JPY (as of January 1, 2019).
Efficient: DMUs with efficiency score of 1. Inefficient: DMUs with efficiency score less than 1.
Refers to the number of people eligible for at least one type of cancer screening, which was calculated using the screening target populations for lung, breast, and cervical cancer screenings.
Regression Analysis of Efficiency
Table 4 presents the results of the logistic regression analysis examining the relationships between efficiency scores, number of screening targets, and aging rate, including an interaction term. The analysis showed that both the aging rate and the interaction term were significantly associated with lower efficiency scores (P < .001). To further interpret these findings, including the interaction term, the impact of each variable on efficiency was analyzed by partially differentiating the regression equation. The results indicated that in municipalities with aging rates higher than the threshold of 31.4% (95% CI: 29.2-37.1), a larger number of screening targets was associated with a lower probability of being classified as efficient. Similarly, in municipalities with more than 1075 screening targets (95% CI: 552-1381), higher aging rates were associated with a lower likelihood of being categorized as efficient. Among the municipalities, 933 (58.6%) had an aging rate above this threshold, and 1544 (96.9%) had more than 1075 screening targets (Figure 2).
Logistic Regression Analysis of DEA Efficiency Scores Based on Population Size and Aging Rate.
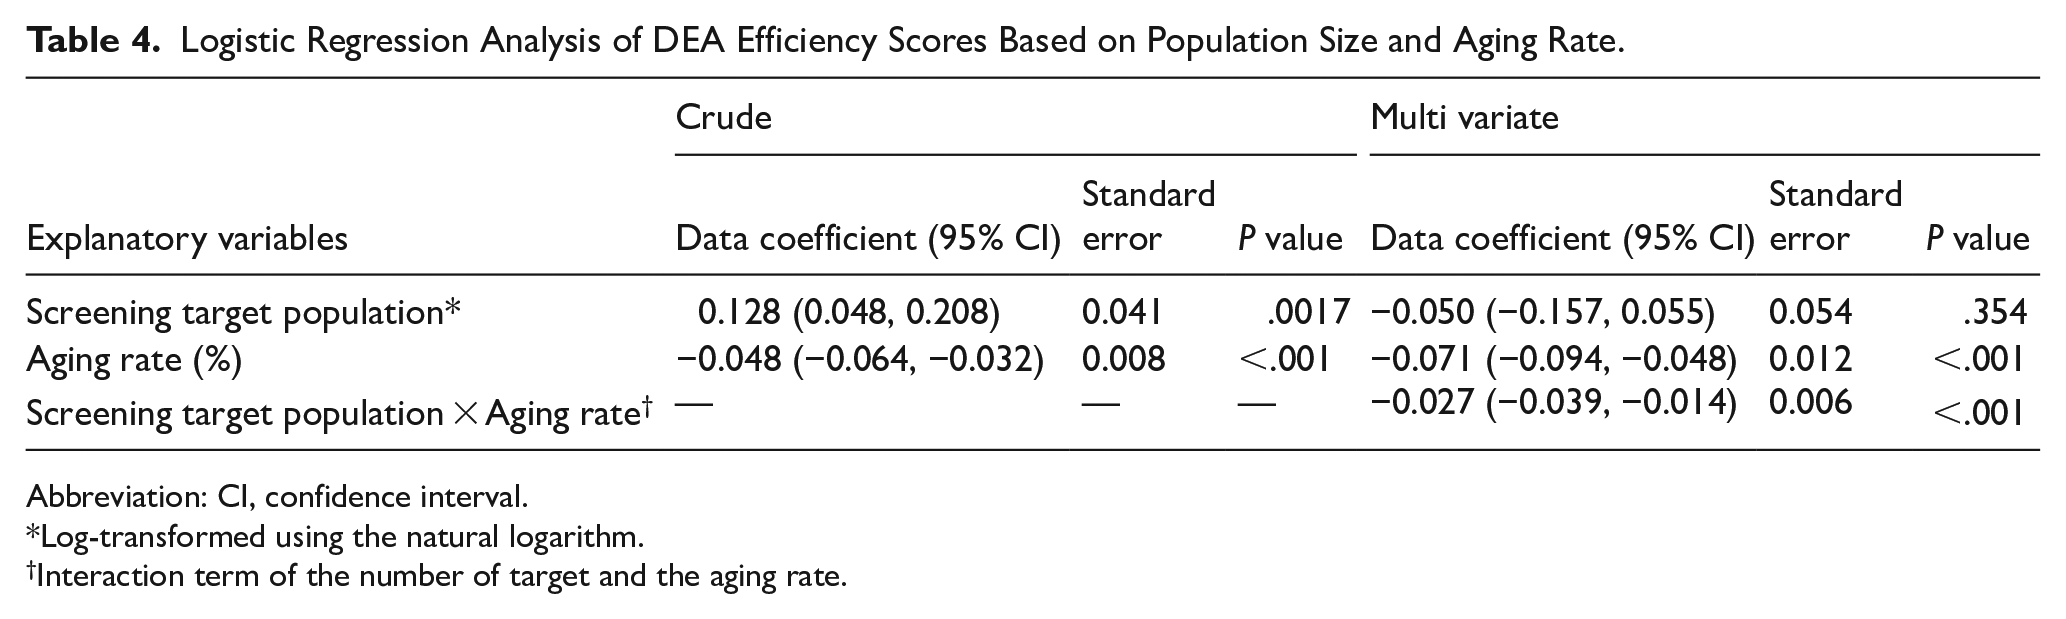
Abbreviation: CI, confidence interval.
Log-transformed using the natural logarithm.
Interaction term of the number of target and the aging rate.

Efficiency scores represent the ratio of the weighted sum of inputs to outputs, ranging from 0 to 1. Municipalities with an efficiency score of 1 were evaluated as efficiently providing screening programs. Black dashed lines indicate variable thresholds: 31.4% for aging rate and 6.98 for the log-transformed number of screening targets (corresponding to 1075 in actual values). Gray dashed lines represent the 95% confidence intervals for these thresholds: 29.2% to 37.1% for aging rate and 552 to 1381 for screening targets.
To assess the robustness of these results, we conducted a sensitivity analysis using a dataset restricted to populations aged under 75 years (Supplemental Table 3). The analysis yielded similar patterns: thresholds were also estimated for the explanatory variables, and in municipalities where one variable exceeded its threshold, a higher value of the other variable was associated with a lower probability of being classified as efficient. The thresholds in this analysis were estimated at 31.4% (95% CI: 29.1-38.2) for aging rates and 784 individuals (95% CI: 328-1061) for screening targets. The number of municipalities that exceeded these thresholds was 1555 (97.6%) for screening targets and 925 (58.1%) for aging rates (Supplemental Figure 1).
To further illustrate these findings, municipalities were visualized based on the analysis results. Figure 3 presents a plot of the prefectures adjacent to Tokyo, highlighting the observed patterns. Upon visual inspection, municipalities with high efficiency scores appeared to cluster together (left pane), while municipalities where population size positively related to efficiency also tended to be adjacent to each other (right pane). Some of these municipalities appeared to be distributed along railway networks, although no formal spatial statistical analysis was conducted to confirm this pattern.

Left panel: Efficiency scores by municipality. Municipalities with unavailable data are shown in white. Pale grid lines indicate latitude and longitude. Right panel: Efficiency characteristics of each municipality. “Efficient” municipalities had an efficiency score of 1. In municipalities where “Population had a positive/negative impact,” the number of screening targets was positively/negatively associated with efficiency scores.
A corresponding map was also created using the dataset restricted to populations aged under 75 years, as part of the sensitivity analysis (Supplemental Figure 2). The distribution patterns observed in this map appeared visually similar to those seen in the main analysis, although no spatial analysis was conducted.
Discussions
This study investigated the relationship between cancer screening efficiency, population size, and aging rates in Japanese municipalities. Regression analysis revealed that in municipalities with lower aging rates, there was a positive association between the screening target population and program efficiency. Furthermore, municipalities with higher efficiency scores, as well as those where population size positively related to efficiency, appeared to be distributed along established public transportation networks (Figure 3). A sensitivity analysis restricted to populations aged under 75 years yielded similar patterns, suggesting that the observed relationships are not solely driven by the inclusion of older populations. One possible explanation for these findings relates to differences in how screening services are delivered. Municipalities with lower aging rates may be more likely to maintain public transportation infrastructure and centralized screening facilities capable of accommodating large numbers of individuals, which in turn support the implementation of population-based screening approaches. As a result, less-aged municipalities may be able to deliver screenings more effectively to larger populations, leading to higher program efficiency.
Previous studies have reported that program efficiency tends to increase with the size of the target population in fields such as vaccinations and maternal care.10,11 Our findings are partially consistent with these observations, showing a positive relationship between population size and screening efficiency in municipalities with lower aging rates. However, because our analysis was based on the FDH model, which does not allow for the evaluation of scale efficiency, we were unable to assess whether the observed patterns reflect economies of scale. This is one of the limitations of our study. Therefore, the findings should be interpreted as descriptive patterns rather than definitive evidence of scale-related efficiency. Recent developments in DEA modeling have introduced methods capable of analyzing ratio variables while also addressing scale efficiency.37-39 Future studies using such models may help deepen our understanding of how population size influences program efficiency in this field.
If this relationship is further substantiated, municipalities with smaller target populations could explore options such as merging their screening programs with neighboring municipalities or adopting collaborative resource-sharing models. These strategies may help optimize resource utilization and improve program efficiency. In Japan, five small municipalities have already implemented a collaborative model for public health initiatives, including cancer screening programs. 14 Such models may offer practical solutions for small administrative units struggling to implement screening programs due to resource constraints.
Additionally, a negative relationship between screening efficiency and aging rates was observed in most municipalities. In municipalities with advanced aging, screening efficiency was also negatively correlated with population size. One plausible explanation for this pattern is the shift in resource allocation that may occur in aging municipalities. Previous studies have shown that there is an increased demand for medical resources among older adults.40-42 This demand may shift the focus of medical institutions and decision-makers toward prioritizing services for older adults, thereby placing pressure on cancer screening programs by limiting available resources and hindering efforts to improve participation. In the framework of DEA, this situation can be interpreted as an increase in input (total resources) without a corresponding rise in output (screening rates), resulting in lower calculated efficiency. This dynamic may explain the lower efficiency observed in aging municipalities in this study.
These findings may have broader implications for countries experiencing advancing population aging, where balancing limited healthcare resources presents growing challenges. As previous studies have projected a continued global rise in aging populations, 25 pressure on healthcare resources is likely to increase. In this context, evaluating the efficiency of screening programs could provide valuable insights for resource planning and public health policy, particularly in aging societies. It is important to note that the generalizability of our findings may be limited, as this study was conducted exclusively in Japan. The Japanese cancer screening system has several distinctive features: for example, there is no nationwide organized screening program, and the out-of-pocket costs for cancer screenings vary across municipalities depending on their fiscal capacity. 16 Meanwhile, individuals have broad freedom in choosing where to get screened, with generally prompt access. These institutional characteristics may influence screening uptake and program efficiency in ways that differ from those in other countries. Accordingly, future research in different healthcare settings may offer additional insights and help determine whether similar patterns hold in other systems.
One potential approach to managing resource allocation challenges involves addressing overscreening. Overscreening refers to providing screenings to individuals outside the recommended age range or to those with severe comorbidities or limited life expectancy, where potential benefits may be outweighed by harms. 43 To explore whether overscreening contributed to lower efficiency in our sample, we conducted an additional analysis using the ratio of the screening rate among individuals aged 75 and older to the overall screening rate. This indicator was intended to reflect the extent to which cancer screening services were disproportionately provided to older populations, thereby serving as a proxy for overscreening beyond the typical target age group. The analysis did not reveal a clear relationship with efficiency scores (Supplemental Figure 3), suggesting that overscreening was not a primary factor contributing to reduced efficiency in our dataset. Nonetheless, refining inclusion criteria based on individual status remains an important consideration for future screening program design, particularly in resource-constrained settings.
The observed interaction between population size and aging rates suggests that these factors jointly influence the efficiency of screening programs. This finding highlights the importance of tailored strategies based on the demographic characteristics of each municipality. For example, City A—the largest municipality in our dataset—exhibited high program efficiency despite facing resource limitations and low participation rates. In such settings, efforts to enhance participation through additional resource input may be justified. In contrast, Village B—one of the smallest municipalities—had relatively ample resources and high participation rates but exhibited low efficiency, suggesting that interventions should focus on improving how resources are utilized (Supplemental Table 4). These contrasting examples illustrate how efficiency assessments can inform more nuanced and context-specific approaches to program management. These findings are especially relevant in light of ongoing demographic shifts. Urban areas are experiencing increasing population density, 44 while rural areas face declining populations.45,46 As these trends continue, some municipalities may face severe population decline accompanied by accelerated aging, which may present challenges in maintaining screening efficiency. Efficiency assessments may help tailor program implementation to the demographic characteristics and constraints of each municipality.
In addition to the limitations discussed above, this study has several other methodological constraints that warrant consideration. First, because the analysis was based on aggregate data at the municipality level, individual-level determinants of screening behavior—such as socioeconomic status (SES), personal health beliefs, or perceived need for screening—were not captured. Consequently, the observed associations between demographic characteristics (eg, aging rate) and efficiency may be confounded by unmeasured individual-level factors. For example, municipalities with higher aging rates may also have a larger proportion of residents with limited income, reduced mobility, or lower motivation to undergo screening, all of which could affect screening participation. 47 These individuals may also tend to live in remote or less-commutable areas, making access to screening services more difficult. Taken together, these factors may partially explain the observed association between aging and efficiency. This limitation could lead to ecological fallacy, where group-level associations are incorrectly interpreted as reflecting individual-level causal relationships. Future studies incorporating individual-level data might help address these limitations and better clarify the relationship between efficiency and demographic composition.
Second, there are limitations regarding the selection of input and output variables. The input variables used in this study—namely the number of clinics and hospitals, public health nurses, and healthcare expenditures—were not solely dedicated to cancer screening. As a result, there may be cases where the level of resources allocated to cancer screening is appropriate for achieving the observed participation rates, yet the municipality is classified as inefficient due to high overall input levels driven by broader health service demands. In such cases, the efficiency scores may partially reflect differences in strategic prioritization, rather than technical inefficiency alone. This suggests that our efficiency measure, while grounded in a methodological framework, may incorporate broader policy decisions made at the municipal level. However, this inclusion is justified by the theoretical flexibility of DEA, which does not require a prespecified functional form or a direct causal relationship between inputs and outputs.31,32 Its primary objective is to assess the relative performance of decision-making units within a given dataset, rather than to predict outputs from inputs. Our objective in using DEA was to evaluate the relative efficiency of municipalities in translating available public health resources into cancer screening participation. Accordingly, we considered the use of input variables that are not exclusively screening-specific to be methodologically acceptable. Moreover, these variables represent the basic public health infrastructure that supports the operational delivery of screening services. For instance, public health nurses are typically responsible for invitation and recall activities which are well-documented strategies for increasing screening uptake.48-50 Therefore, although this limitation should be acknowledged, we believe that the input variables selected in this study function as reasonable proxies for the resource environment supporting cancer screening implementation. If screening-specific resource data were available, such variables might allow for more precise efficiency estimation.
On the output side, we used participation rates for five cancer screening programs as the output variables. Therefore, it is important to note that this does not assess the ultimate effectiveness of cancer screening, which refers to the reduction in cancer-related mortality. However, we chose to focus on participation because it reflects the program’s operational performance, which was the main objective of this study. Including outputs such as mortality or morbidity would have incorporated factors beyond the scope of screening implementation, such as treatment effectiveness, which could complicate the interpretation of efficiency. By limiting outputs to participation rates, we aimed to evaluate the efficiency of program delivery itself. As a result, our analysis captures operational efficiency rather than the clinical effectiveness of cancer screening programs.
Finally, we did not conduct a formal sample size or power calculation, which is acknowledged as a limitation. However, we included all municipalities for which valid data were available at the time of analysis. As such, our dataset represents the full population of eligible units rather than a sample, minimizing concerns about selection bias. While this approach limits our ability to assess statistical power in the conventional sense, it enables a comprehensive analysis of demographic patterns and program efficiency across diverse administrative settings.
Despite these methodological limitations, the study offers valuable insights into how demographic characteristics relate to the efficiency of cancer screening programs. To our knowledge, this is the first empirical study to examine this relationship at the municipal level, providing a basis for future research in this field.
Conclusions
This study demonstrated that cancer screening efficiency may be influenced by the interplay of aging rates and the population sizes of screening targets. As healthcare systems face increasing pressure to use limited resources effectively, it is important to incorporate efficiency considerations into the planning and management of screening programs. Further research may help clarify the factors influencing screening efficiency, particularly in relation to demographic shifts and resource-related characteristics.
Supplemental Material
sj-jpg-1-his-10.1177_11786329251362381 – Supplemental material for Impact of Population Size and Aging on the Efficiency of Cancer Screening in Japanese Municipalities: Insights from Data Envelopment Analysis
Supplemental material, sj-jpg-1-his-10.1177_11786329251362381 for Impact of Population Size and Aging on the Efficiency of Cancer Screening in Japanese Municipalities: Insights from Data Envelopment Analysis by Koshi Takahashi, Sho Nakamura, Yu Ogasawara, Masahiko Sakaguchi, Kaname Watanabe and Hiroto Narimatsu in Health Services Insights
Supplemental Material
sj-jpg-2-his-10.1177_11786329251362381 – Supplemental material for Impact of Population Size and Aging on the Efficiency of Cancer Screening in Japanese Municipalities: Insights from Data Envelopment Analysis
Supplemental material, sj-jpg-2-his-10.1177_11786329251362381 for Impact of Population Size and Aging on the Efficiency of Cancer Screening in Japanese Municipalities: Insights from Data Envelopment Analysis by Koshi Takahashi, Sho Nakamura, Yu Ogasawara, Masahiko Sakaguchi, Kaname Watanabe and Hiroto Narimatsu in Health Services Insights
Supplemental Material
sj-jpg-3-his-10.1177_11786329251362381 – Supplemental material for Impact of Population Size and Aging on the Efficiency of Cancer Screening in Japanese Municipalities: Insights from Data Envelopment Analysis
Supplemental material, sj-jpg-3-his-10.1177_11786329251362381 for Impact of Population Size and Aging on the Efficiency of Cancer Screening in Japanese Municipalities: Insights from Data Envelopment Analysis by Koshi Takahashi, Sho Nakamura, Yu Ogasawara, Masahiko Sakaguchi, Kaname Watanabe and Hiroto Narimatsu in Health Services Insights
Supplemental Material
sj-xlsx-4-his-10.1177_11786329251362381 – Supplemental material for Impact of Population Size and Aging on the Efficiency of Cancer Screening in Japanese Municipalities: Insights from Data Envelopment Analysis
Supplemental material, sj-xlsx-4-his-10.1177_11786329251362381 for Impact of Population Size and Aging on the Efficiency of Cancer Screening in Japanese Municipalities: Insights from Data Envelopment Analysis by Koshi Takahashi, Sho Nakamura, Yu Ogasawara, Masahiko Sakaguchi, Kaname Watanabe and Hiroto Narimatsu in Health Services Insights
Supplemental Material
sj-xlsx-5-his-10.1177_11786329251362381 – Supplemental material for Impact of Population Size and Aging on the Efficiency of Cancer Screening in Japanese Municipalities: Insights from Data Envelopment Analysis
Supplemental material, sj-xlsx-5-his-10.1177_11786329251362381 for Impact of Population Size and Aging on the Efficiency of Cancer Screening in Japanese Municipalities: Insights from Data Envelopment Analysis by Koshi Takahashi, Sho Nakamura, Yu Ogasawara, Masahiko Sakaguchi, Kaname Watanabe and Hiroto Narimatsu in Health Services Insights
Supplemental Material
sj-xlsx-6-his-10.1177_11786329251362381 – Supplemental material for Impact of Population Size and Aging on the Efficiency of Cancer Screening in Japanese Municipalities: Insights from Data Envelopment Analysis
Supplemental material, sj-xlsx-6-his-10.1177_11786329251362381 for Impact of Population Size and Aging on the Efficiency of Cancer Screening in Japanese Municipalities: Insights from Data Envelopment Analysis by Koshi Takahashi, Sho Nakamura, Yu Ogasawara, Masahiko Sakaguchi, Kaname Watanabe and Hiroto Narimatsu in Health Services Insights
Supplemental Material
sj-xlsx-7-his-10.1177_11786329251362381 – Supplemental material for Impact of Population Size and Aging on the Efficiency of Cancer Screening in Japanese Municipalities: Insights from Data Envelopment Analysis
Supplemental material, sj-xlsx-7-his-10.1177_11786329251362381 for Impact of Population Size and Aging on the Efficiency of Cancer Screening in Japanese Municipalities: Insights from Data Envelopment Analysis by Koshi Takahashi, Sho Nakamura, Yu Ogasawara, Masahiko Sakaguchi, Kaname Watanabe and Hiroto Narimatsu in Health Services Insights
Footnotes
Abbreviations
DEA: data envelopment analysis
CI: confidence interval
DMU: decision making unit
FDH: free disposal hull
Author Contributions
Koshi Takahashi: Conceptualization, Investigation, Formal analysis, Visualization, Writing – Original draft preparation. Sho Nakamura: Conceptualization, Writing – Reviewing and Editing. Yu Ogasawara: Conceptualization, Methodology, Writing – Reviewing. Masahiko Sakaguchi: Conceptualization, Methodology, Investigation. Kaname Watanabe: Writing – Reviewing and Editing. Hiroto Narimatsu: Writing – Reviewing and Editing, Supervision.
Ethical Considerations
Not applicable. This study used publicly available municipal data and did not involve human participants, human data, or human tissue.
Funding
The author(s) received no financial support for the research, authorship, and/or publication of this article.
Declaration of Conflicting Interests
The author(s) declared no potential conflicts of interest with respect to the research, authorship, and/or publication of this article.
Data Availability
Supplemental Material
Supplemental material for this article is available online.
References
Supplementary Material
Please find the following supplemental material available below.
For Open Access articles published under a Creative Commons License, all supplemental material carries the same license as the article it is associated with.
For non-Open Access articles published, all supplemental material carries a non-exclusive license, and permission requests for re-use of supplemental material or any part of supplemental material shall be sent directly to the copyright owner as specified in the copyright notice associated with the article.