
Abstract
In case of crisis, the salvation of injuries depends on the timely provision of medical goods, relief supplies, and equipment. The aim of this study is to present a mathematical model for the supply chain network of perishable medical goods in crisis situation considering the uncertain environment. In this paper, a three-level supply chain including suppliers, intermediate warehouses, and final customers is developed for perishable medical items. The uncertainty of customer demand for service and the spent time in the intermediate warehouses are considered using the exponential distribution functions. Also, it is assumed that the life-cycle of perishable medical goods follow the Weibull distribution function. The model attempts to minimize the total costs of the supply chain and total presence time of perishable items in the whole chain. The LP-Metric method is employed for solving small-sized problems. Due to the NP-Hardness of the problem, the modified Multi-objective Particle Swarm Optimization (MOPSO) and Non-dominated Sorting Genetic Algorithm (NSGA-II) are utilized as 2 well-known and efficient meta-heuristic algorithms for solving large-sized problems. The findings indicate that the meta-heuristic algorithms are efficient in achieving close to the optimal solution for large-size problems in a reasonable time. Also, the results demonstrate that NSGA-II outperforms MOPSO in terms of the high quality solution. Finally, the applicability of the model to real-world problems is demonstrated using a real case study. This paper can assist the planners and decision-makers of perishable drugs supply chain networks in crisis conditions with on-time supplying and distributing the required emergency items.
Introduction
A disaster may occur at any time and place and this is often without prior warning. Several natural disasters, which cause mass casualties, occur in the world every year. Crisis is a natural or synthetic event that occurs suddenly or over the time and imposes hardship on society, and urgent and emergency actions are needed to overcome these hardships. 1 Events and disasters can be categorized as follows:
Natural and sudden disasters such as avalanches, earthquakes, floods, dam destruction, storms, tornadoes, droughts and so on.
Man-made and sudden events such as building collapse, chemical explosions, nuclear explosions, fires and chemical pollution.
Man-made and long lasting events, including internal conflicts, international wars, and so on.
To deal with natural disasters and crises, there is a need for crisis management that is a set of specific operations and processes that are designed to prevent and mitigate the effects of the crisis in the 3 stages of pre-crisis, during the crisis and post-crisis. 2 There are different approaches to dividing the phases of disaster management operations. 3 One of these approaches divides the phases of disaster management operations into 4 phases: prevention, preparation, response, and recovery. 4 Figure 1 shows the order of these phases starting from disasters. The duration of each phase is different depending on the type and severity of disasters. It should be noted that the above steps are repeated in a cycle. 5

Four phases of crisis management cycle.
In the event of a crisis, the need for medical goods and relief products is well felt due to injuries and damage caused by it and rescue of many injuries and victims is dependent on the timely provision of relief supplies and equipment. Therefore, there should be a valid and reasonable planning for such critical situation which by timely supplying and distributing the required items, to create the opportunities to be used in urgent and emergency situation. Providing health and medical items that are needed by healthcare centers such as hospitals and health centers and managing them in normal and critical situation is a challenge that the health systems are faced with it. There is always a demand for medical items, but the demand for these products is somewhat erratic. In other words, the demand for these items is often random and is not the same in different conditions. 2 Several studies have considered uncertainty in the supply chain (SC) problems. In addition, due to the nature of crisis, which often ocuurs all of a sudden, crisis is associated with some uncertainty parameters. Parameters such as demand and travel time are usually non-deterministic that should be dealt with an appropriate approach.
In a classification, relief items are divided into 2 main categories of consumable and non-consumable. Figure 2 shows the classification of relief items.

Classification of relief items.
Consumable relief items are delivered to the affected people several times, while non-consumable relief items are delivered one time. Non-consumable operational relief items are required to set up an operation, while non-operational ones are required to meet the essential needs of the affected population. 6 The equilibrium of supply and demand for these products is difficult in an efficient way because most of the medical products are perishable and this makes it harder to manage such strategic products. If the perishable medical products are not delivered properly and timely to the demand centers, they are exposed to corruption and are no longer usable and this makes it difficult to plan for medical items, and it is necessary to consider the special sensitivity to supply and distribute these goods. In addition, unlike some other goods in the supply chain, that the shortage of them is allowed with a penalty, the shortage of medical and relief supplies is not acceptable at all since it leads to death and crisis. For all of the above reasons, designing an appropriate SC for supplying and distributing the medical products for crisis situation is a matter to take special care and consider all its components. One of the necessary and urgent actions in crisis management is the provision of adequate blood for the victims. As a result, in this study, a fuzzy bi-objective mixed-integer programing (MIP) model is proposed for the appropriate planning of transportation of perishable goods in crisis situation. The main goals of the currect study are mentioned as follows:
Investigating the impact of demand uncertainty in the supply chain network,
Planning facility locations and assigning demand points to these locations,
Detailed planning for transportation of perishable goods,
Considering the perishability threshold of perishable medical goods,
Presenting different approaches to solve problems in different dimensions
One of the significant contributions of the current research is to consider the uncertainty in the demand of service recipients (customers) and also the duration of the presence of medical goods in intermediate warehouses with an exponential probability distribution function to make the presented model close to real-world conditions. In addition, the important characteristics of medical goods and relief items that are usually perishable and have a certain life span are taken into account.
The rest of the paper is organized as follows: In Section 2, the relevant literature is reviewed. The problem description, model formulation, and solution methods are described in Section 3. In Section 4, numerical experiments, interpretation of results of the 3 methods and sensitivity analysis of the model’s main parameters are presented. In addition, the application of the proposed model to an actual case study is provided. Eventually, the conclusions and suggestions for future research are presented in Section 5.
Literature Review
Fahimnia et al 7 presented a comprehensive literature review of transportation problems and classified integrated production and distribution planning models into 7 general chapters. Since these models have a lot of abundance, all of them are not mentioned here, and only a variety of these models are mentioned. The general models for designing the production and transportation network include the following categories. An article is presented as an example for each of the following categories.
Transportation model for a product, 8
Multi-product transportation model with a production unit, 9
Multi-product with several units, with or without a warehouse, 10
Multi-product with several units, with several warehouses, with or without a final consumer,11,12
Multi-product with several units, with several warehouses, with several final consumers, with a single transportation route,13,14
Multi-product with several production units, with several warehouses, with several final consumers, with several transportation routes, and single-period,15,16
Multi-product with several production units, with several warehouses, with several final consumers, with several transportation routes, and multi-period. 17
The category above is the classification of the models presented in the field of goods transportation based on the type of model used. Another approach that often exists in research classification is classification based on the model solution method. The solution models include 4 general categories: mathematical methods, 18 heuristic algorithms, 19 simulation methods, 20 and meta-heuristic algorithm. 17
On the other hand, various approaches have been used in dealing with uncertainty. 21 In some papers, the researchers presented a robust optimization model with regard to uncertainty in demand. This model integrates the entire supply, production, and distribution processes of a company, and all of these were identified in a comprehensive model by considering demand uncertainty in different parts.22,23 In these papers, a probabilistic and scenario-based approaches were used to address these uncertainties. In addition to the probabilistic and scenario-based approaches, the fuzzy approach has also been used by researchers to address the uncertainty. For example, Torabi and Hassini 24 provided an integrated fuzzy goal programing model for supplying, distributing and transporting the goods.
Rezaei-Malek et al. 25 designed a robust SC model for transportation of perishable commodities in crisis situation. The authors could bring the proposed model closer to the real-world conditions by considering the time windows and various scenarios for the severity of disasters. Cheraghi et al. 26 modeled the blood SC in crisis situation. The proposed model is a multi-objective mixed integer programing. Tavana et al. 27 presented a hybrid location, inventory, and routing model for the relief and rescue SC in pre and post-crisis situation. They provided 2 models for planning before and after a crisis. Noham and Tzur 28 explored a model for a humanitarian SC to determine the post-crisis decisions. In this research, they provided a hybrid location, inventory, and routing model for a rescue and relief supply chain. Zahraee et al. 29 aimed at improving the efficiency of the blood SC system using the Taguchi method and dynamic simulation. They also implemented their model on the Iranian Blood Transfusion Organization. Habibi-Kouchaksaraei et al. 30 presented a bi-objective, multi-echelon robust model for the blood SC in crisis situation. In this chain, three levels include the supplier, processing, and distribution. The problem objectives include minimizing total cost, as well as satisfying blood needs. Table 1 shows a summary of the literature review of the research. Also, Zahiri et al. 31 developed a bi-objective mathematical programing model to design the pharmaceutical SCN. Goodarzian et al. 32 proposed a fuzzy mixed-integer non-linear programing (MINLP) model for the pharmaceutical SC problem and solved it using the meta-heuristic algorithms. Sinha and Anand 33 employed a meta-heuristic algorithm to solve the SCN of perishable products. Zandkarimkhani et al. 34 introduced a bi-objective optimization model for the perishable pharmaceutical SCN design considering the uncertainty of demand. Franco and Alfonso-Lizarazo 35 proposed a MIP model for the pharmaceutical SCN problem and solved it with the epsilon-constraint method. Goodarzian et al. 36 introduced a MIP model for the medicine SCN problem considering uncertainty and applied the meta-heuristic algorithms to solve the problem. In addition, Goodarzian et al. 37 addressed multiple objectives, multiple periods, multiple levels, and multiple products for a sustainable medical supply chain network. Fatemi et al. 38 developed a multi-objective mathematical programing model for the pharmaceutical SCN and solved it using the GAMS optimization software. Khalili-Damghani et al. 39 developed a mathematical model considering 2 levels and 2 echelons for minimizing the costs of pre-disaster and maximizing the coverage areas of post-disaster relief. They employed a geographic information system (GIS) to categorize the disaster areas and identify the location and optimal number of distribution centers provided keeping the inventory costs of relief supplies’ as minimum as possible. They also exploited a simulation model for estimating the demands of relief supplies. Lotfi et al. 40 suggested a multi-objective nonlinear model for designing the pharmaceutical SCN and solved it using the LP-metric method with the GAMS software. Kochakkashani et al. 41 proposed a MIP model for the pharmaceutical SCN clustering with K-means. Goodarzian et al. 42 introduced a Fuzzy Inference System for forecasting medical wastes related to the COVID-19. They also proposed a fuzzy sustainable model for minimizing supply chain costs and the environmental consequences of medical waste while establishing detoxification centers ensuring effective management of social responsibility initiatives during the COVID-19 epidemic.
A summary of the related studies.

According to the literature review, few studies have considered the SCN problem of perishable medical goods in crisis situation. In other words, the particular characteristics and conditions of crisis have been neglected. For example, in the event of a crisis, some parameters such as time and demand are uncertain. Moreover, the features of medical goods and relief items that are often perishable and have a certain lifespan have been overlooked in numerous research works. In addition, the relevant studies have focused solely on locating or routing problems. To this end, in the current study, a fuzzy bi-objective MIP model is presented for the SCN of perishable medical goods in crisis situation taking the uncertainty into account. In this model, the practical and real-world conditions such as the uncertainties associated with the customer demand and the presence duration of medical goods and relief items in intermediate warehouses are considered using the exponential probability distribution. In addition, it is assumed that the perishable medical goods follow the Weibull distribution function to improve the accuracy of the model.49-54 The perishable medical goods SC is accompanied by high uncertainty. This uncertainty in demand can be in terms of the place and time of demand as well as the amount and type of demand. Since facilities and distribution networks might be partially or completely interrupted by disaster, access to the transportation network, required time to pass through each route of the network, and transportation costs are associated with uncertainty. In addition, it should be noted that the generosity of donors cannot be predicted. Also, in case of a disaster occurrence, the capacity of suppliers and the stock stored in permanent medical goods distribution centers may be partially or completely disrupted. Hence, there is a high degree of uncertainty in the supply of medical goods and relief items.
Modeling
Problem description
In this paper, a fuzzy bi-ojective mathematical programing model is developed for the three-level SCN problem of the perishable medical goods assuming that the corruption of medical products follows the Weibull probability distribution.
The Weibull random variable is a random variable with continuous values based on non-negative real numbers. As a result, in cases where the random variable is related to life span, this distribution can be used. 50 The Weibull distribution is a continuous probability distribution used to model lifetime and failure time. This distribution has high flexibility and can model a wide range of failure behaviors, including premature failures, wear-out, and random failures. The Weibull distribution parameters include the shape and scaling parameters. The shape parameter determines the shape of the distribution and the scaling parameter determines the scale of the distribution.52,53 The Weibull distribution can model a wide range of failure behaviors. Weibel distribution is easy to understand and use, which makes it useful in various fields. Weibel distribution is used in various sciences and in many fields, including medical sciences. Weibel distribution can be used in survival time modeling to check the life of patients, check the life of medical parts and analyze errors. 54 In engineering sciences, the Weibull distribution is used as a useful tool in modeling the lifetime of pipelines, electrical and mechanical systems, electronic components, and manufacturing and assembly systems. This distribution can help to analyze the behavior of parts reduction and predict their life. Weibel distribution can be used in buyer behavior modeling, product and project performance analysis, delivery time modeling and supply chain management. In general, the Weibel distribution with its diverse properties is a powerful tool for modeling complex behaviors and analyzing data that simultaneously has the property of reducing the exponential distribution function and the shape of the Weibel distribution. It should be noted that this distribution has been used in many articles related to the life of the product and the results presented are acceptable and close to reality. 51 In addition, Chołodowicz and Orłowski and Orłowski 49 demonstrated that the accuracy of modeling can be increased by the application of the Weibull distribution function to perishability. That is, the higher the presence of each relief item in the SC, the higher the probability of its corruption.The SC levels include: (1) suppliers of items, (2) intermediate warehouses, and (3) final customers.
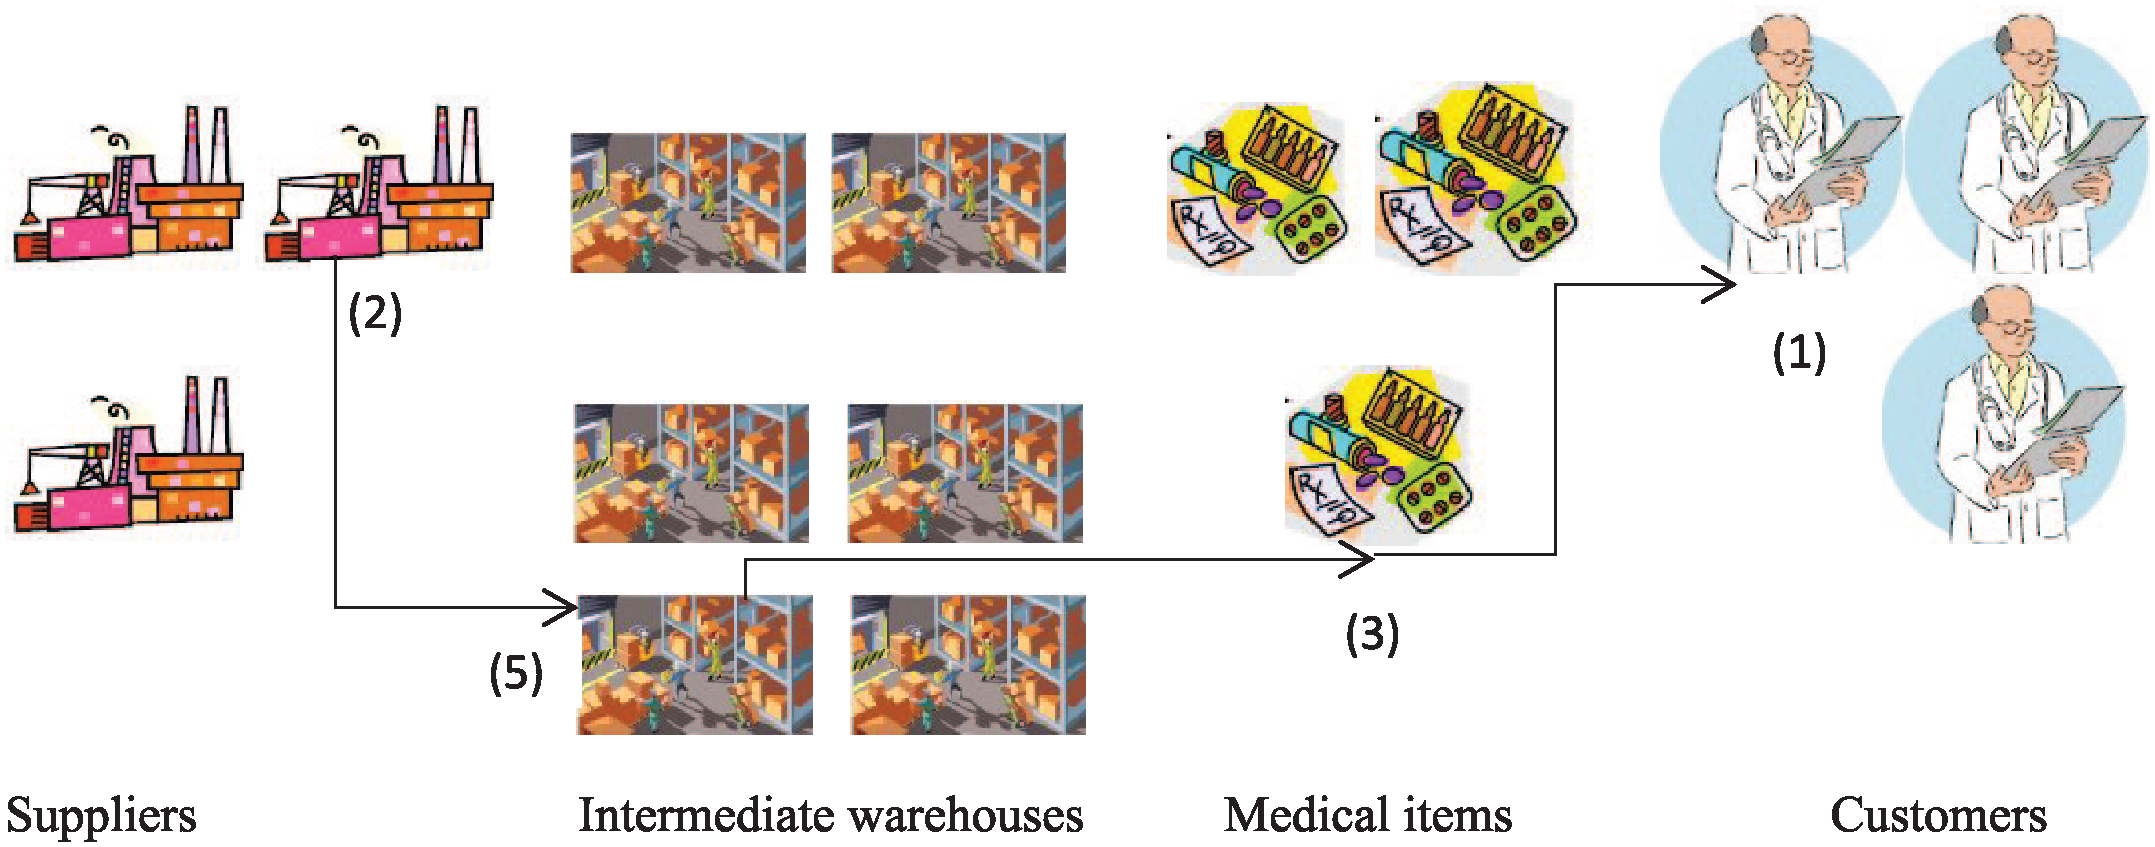
The present supply includes three main levels, the customers for medical goods and relief items are at the first level of chain that are denoted by set I: {i = 1, 2, 3, . . ., |I|}, and the amount of each customer’s demand (
(a) Fuzzy sets theory can be exploited when there is no historical data for the parameter and no probability distribution function can be attributed to that parameter. (b) Unlike the probabilistic method, in which the dimensions of the problem increase significantly with transforming the non-deterministic model into its deterministic equivalent, the crisp equivalent of a fuzzy model, which is the same as the deterministic equivalent, does not change the dimensions of the problem.
At the second level, there are potential intermediate warehouses displayed by set J: { j = 1, 2, 3, . . ., |J|}) that receive, store, and transfer relief items from suppliers at the third level, and play the role of interface between 2 levels. The proposed model seeks to select the optimal intermediate warehouses as well as the optimal amount of flow from suppliers to intermediate warehouses, and from intermediate warehouses to each of the customers, with the minimum total costs and shortest possible time for the items to be received by the customers. Finally, at the third level, there are suppliers denoted by set K: {k = 1, 2, 3, . . ., |K|}. The medical items are displayed with set M: {m = 1, 2, 3, . . ., |M|}. Figure 3 shows the structure of the problem network. It should be noted that the capacity of the intermediate warehouses is limited and is shown with parameter


Supply chain network (SCN).
In order to make the proposed model closer to real-world conditions, uncertainty in the parameters of customer demand for service and spent time in the intermediate warehouses is taken into account using the exponential distribution function.57,58
Parameters

Variables

Mathematical model


Constraint (2) expresses the first objective function of the model
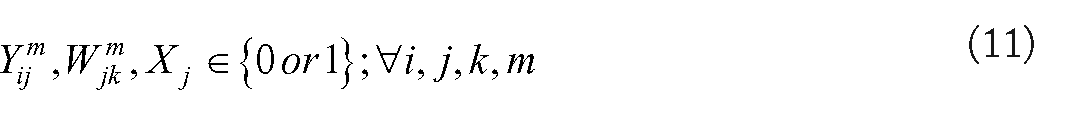
Constraint (6) ensures providing the demand of each customer, taking into account the initial amount of demand and the amount of corrupted medical items along the supply chain. Constraint (7) shows that the input of each intermediate warehouse is at least equal to its output (since the first objective function is to minimize the flow of input and output of intermediate warehouse, the left side value of the constraint cannot be greater than its right side value). Constraint (8) indicates that each medical item required by each customer is supplied by exactly 1 intermediate warehouse. Constraint (9) states that any medical item can be entered into an intermediate warehouse from only 1 supplier. Constraint (10) mandates the capacity of intermediate warehouses. Constraint (11) exhibits the binary variables. Constraint (12) specifies the nonnegative variables, and constraint (13) shows that the objective functions are free variables.
Defuzzification method
In order to defuzzify the fuzzy parameters of the proposed model, a well-known defuzzification method introduced by Jiménez et al. 59 is employed to transform the triangular fuzzy numbers into the crisp numbers. It should be noted that the selction of the appropriate defuzzification method pertains to the context and type of the decision-making. 60
The steps of this approach are as follows:
Step 1: Determine a minimum constraint feasibility degree: This is, in fact, determination of the minimum possibility of fuzzy numbers in the constraints, which, constraint feasibility is met.
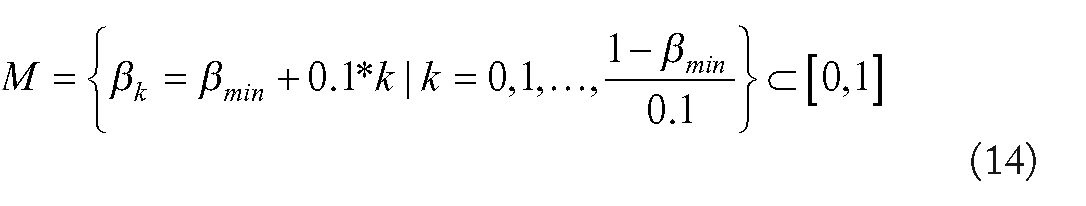
Step 2: Determine the values for feasibility of constraints based on the minimum specified parameter in the first step: Based on the methodology proposed by Kaufman and Gupta, 61 which states that for every 0.1 changes in the value of the possibility of a fuzzy number, the value of the number also changes, so the values for feasibility of constraints are started from the minimum value and 0.1, 0.1 is added to reach 1.
If
Step 3: Solving the model with the objective function equals to the middle value of the fuzzy number of the objective function and feasibility of constraints for each feasibility value: We start from the minimum feasibility value and, make the constraints crisp for the different feasibility values, and solve the model, for all constraints and with the objective function equals to the middle value (probable value) of the fuzzy number and determine the values of decision variables and objective functions. Note that after determining the value of decision variables for the probable value of the fuzzy objective, we set the values of the variables in the fuzzy objective and determine the fuzzy value of the fuzzy objective.
Define a fuzzy goal number for the fuzzy objective: In fact, at this stage, 1 goal is defined as a fuzzy number for a given fuzzy objective value. In other words, the minimum and the maximum satisfactory value for the fuzzy objective are respectively
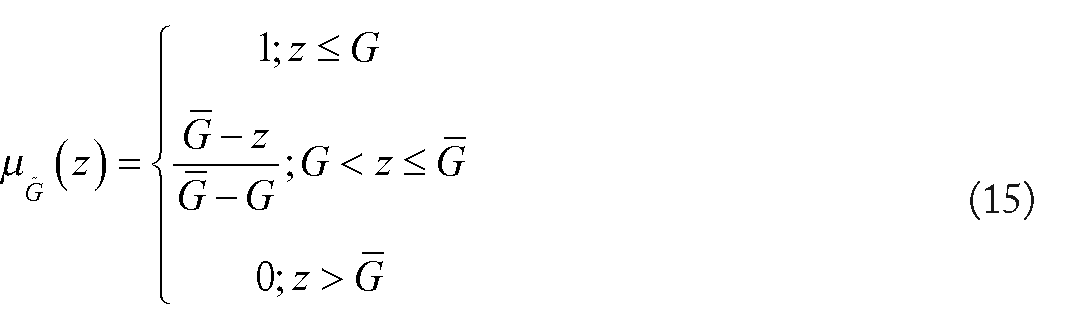
Step 5: Determine the degree of satisfaction of the fuzzy goal by each obtained value for the fuzzy objective: If the value of the fuzzy objective for the feasibility value of

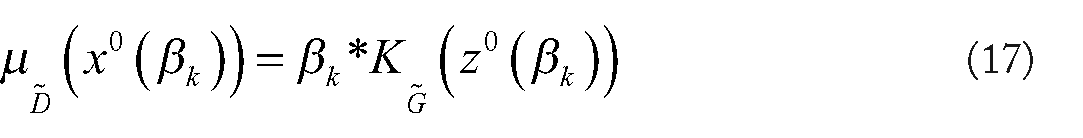
Determine the fuzzy decision set: The members of the mentioned set are the vector of
Determine the decision vector and the crisp objective value for the problem: Among the decision vectors, the vector that has the highest membership in the set is chosen as the final vector of the decision and its associated objective value as the final value of the fuzzy objective. In simpler terms:

Consider the following example to better understand the defuzzification method of Jimenez et al. 59 :
Min (19, 20, 21)
S.t.
(4.5, 5, 5.5)
(3, 4, 5)

Now we have to calculate the acceptable solutions of the following ordinary α-parametric linear program:
Min 20
S.t.
((1-α) 5.25 + α 4.75)
((1-α) 4. 5 + α 3. 5)

Different values of the coefficient α from 0 to 1 can be considered depending on the level of conservatism or the risk appetite of the decision maker. Then solve the model based on this assigned coefficients. Assume that the value of α is considered to be 0.5 according to the manager’s view. According to this coefficient, the value of
The crisp equivalent of the sixth constraint according to the defuzzification method of Jimenez is in the form of relation (21):

Solution methods
Since the SC problems are NP-hard, the solution time increases exponentially by increasing the dimensions of the problem. Hence, it is not possible to apply the exact methods to find the optimal solutions for large-sized real-world problems within a reasonable computational time. Hence, the need arises to use meta-heuristic algorithms to solve large-size problems. As the proposed optimization model is NP-hard, it is necessary to solve large-size problems with heuristic and meta-heuristic algorithms. In the present study, the LP-Metric exact method is employed to solve the proposed model for small-sized problems. In addition, due to the NP-Hardness of the problem in hand, the modified multi-objective particle swarm optimization (MOPSO) and Non-dominated Sorting Genetic Algorithm (NSGA-II) are utilized as the 2 of the most efficient and frequently used meta-heuristic algorithms to solve the large-size problems since the LP-Metric exact method is not capable in finding the optimal solutions in a reasonable computational time.
In the last decade, many multi-objective evolutionary algorithms have been proposed. Among these algorithms, the MOPSO, MOSA, MOGWO, and NSGA algorithms can be mentioned. 62 The NSGA-II algorithm has characteristics that make its use in multi-objective problems easier compared to other algorithms. 63 NSGA-II uses binary codes for coding the decision variables and also uses the probability cycle to select the parents and this itself causes getting close to the optimal solution. 64 On the other hand, the speed of reaching the optimal solution is lower than the MOPSO algorithm, also, it reaches convergence later. 65 The NSGA-II algorithm is one of the most powerful algorithms that has been widely used in the literature and has shown several times that it works well for solving various multi-objective optimization problems, for this reason, this algorithm is considered as the basic and accepted algorithm in this research.66,67
The MOPSO algorithm is one of the frequently-used efficient population-based and multi-objective algorithms that was chosen for comparison with the NSGA-II algorithm. 68 The MOPSO algorithm has a memory in such a way that the knowledge of good solutions is kept by all particles. 69 In other words, in MOPSO, each particle benefits from its past information, while there is no such behavior and feature in other evolutionary algorithms, for example, there is no such memory in GA. The previous knowledge of the problem is lost once the population changes. The PSO algorithm shows more flexibility compared to other optimization strategies by using a large number of crowding particles against the local optimal problem. The main problem of MOPSO is premature convergence. In this algorithm, the particles gradually travel in the search space near the best global optimal solution and do not explore the rest of the space, and in other words, the particles converge and during the search process, some particles in the population may get caught in the local optimum and do not participate in the next discoveries. The MOPSO algorithm has several advantages and disadvantages. The use of memory, high convergence speed, better dealing with the local optimal solutions, and ease of implementation can be mentioned as some its main advantages. Some of its disadvantages are premature convergence, getting stuck in the local optimum, and reducing the diversity of the population. 70
The results indicate that the proposed meta-heuristic algorithms are efficient in achieving the optimal solution for small-size problems and and close to the optimal solution for the large-size problems in a quite short computational time.
LP-metric method
The goal of this approach is to arrive at a response that minimizes the deviation between the values of objective functions and ideal value derived from the individual optimization of them in problems with more than one goal.
71
At first, each of goals is considered separately in the problem and the optimal value of each of them is obtained, regardless of the other goals, and this is considered as the ideal value of the objective. In the next step, the objective function of the deviation, equation (22), is considered as the new objective of the problem and the optimization of the problem is performed with that goal. It should be noted that in the first step, the goals should be maximized in order to individual optimization, that is, minimization functions should be converted to maximization with a multiplication in a negative. For a better understanding, assume that the objective functions of the problem and their individual optimal values in maximization case are respectively

In this research, the value of the parameter
Multi-objective particle swarm optimization (MOPSO)
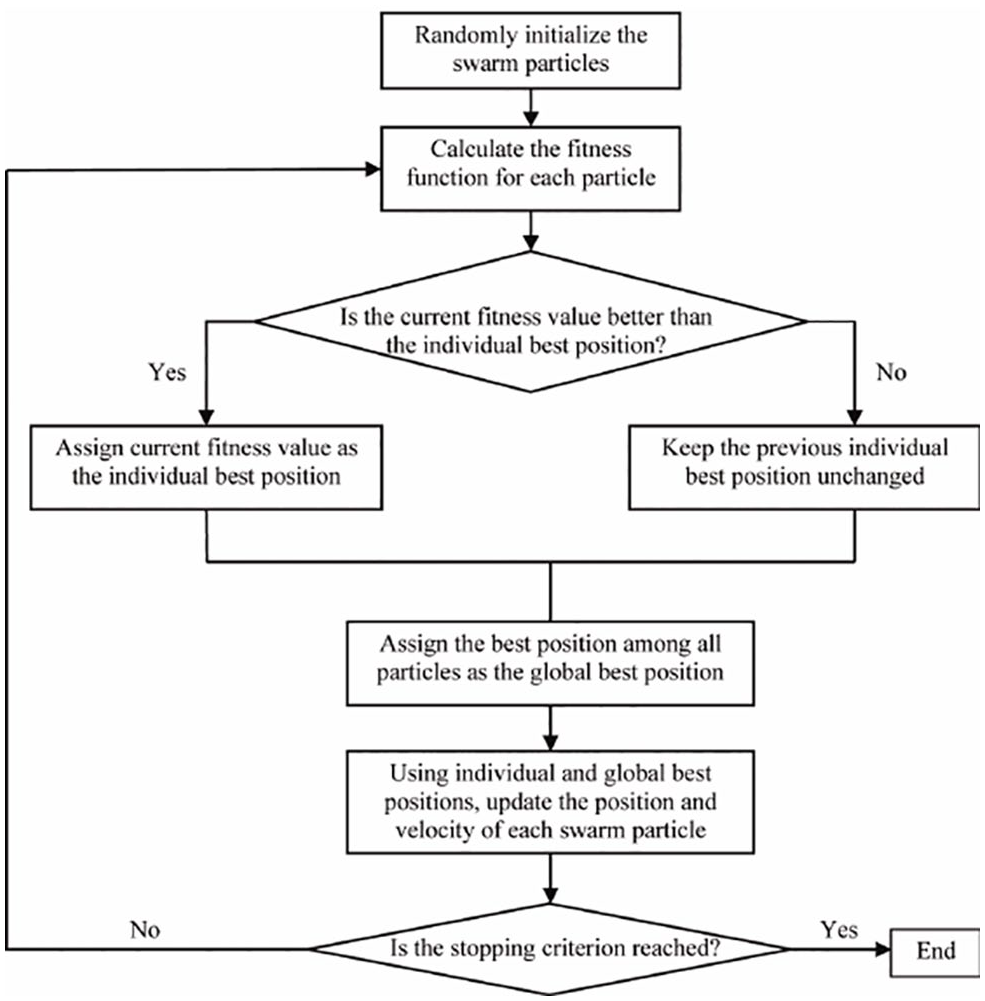
Particle swarm optimization was first introduced by Eberhart and Kennedy in 1955 as a stochastic optimization technique for functional optimization. This algorithm is a social search algorithm inspired by social behavior of bird flocking or fish schooling. The PSO algorithm is based on an initial population (swarm) containing the candidate solutions (particles) which move around the search space. The particles’ movements are directed by their best position so far in the search space together with the entire swarm’s best position so far. 72 Each particle has a fitness value calculated by a fitness function. If a particle is closer to the food-goal in the search space (in the model of the movement of birds), its fitness value is greater. Each particle also has a velocity that controls the movement of the particle. The agent moves in the problem space by continuing to pursue the optimal particles in the present state. PSO initialzes with a group of random particles (solutions) and tries to find an optimal solution by updating the generations. At each step, each particle is updated using 2 best values. The first one (pbest) has been the best situation ever achieved by the particle. 73 The flowchart of this algorithm is shown in Figure 4. In this algorithm, the convergence test is updating the best position found by each particle and best position found by the best particle of the particle group. The execution of the algorithm continues, until the stop condition (execution of the algorithm’s iterations, reaching the predetermined time for the algorithm execution, reaching the predetermined tolerance in the best value of the particle target, etc.) is met.
Flowchart of PSO.
As shown in Figure 5, the red node

Particle motion view in PSO.
Non-dominated sorting genetic algorithm (NSGA-II)
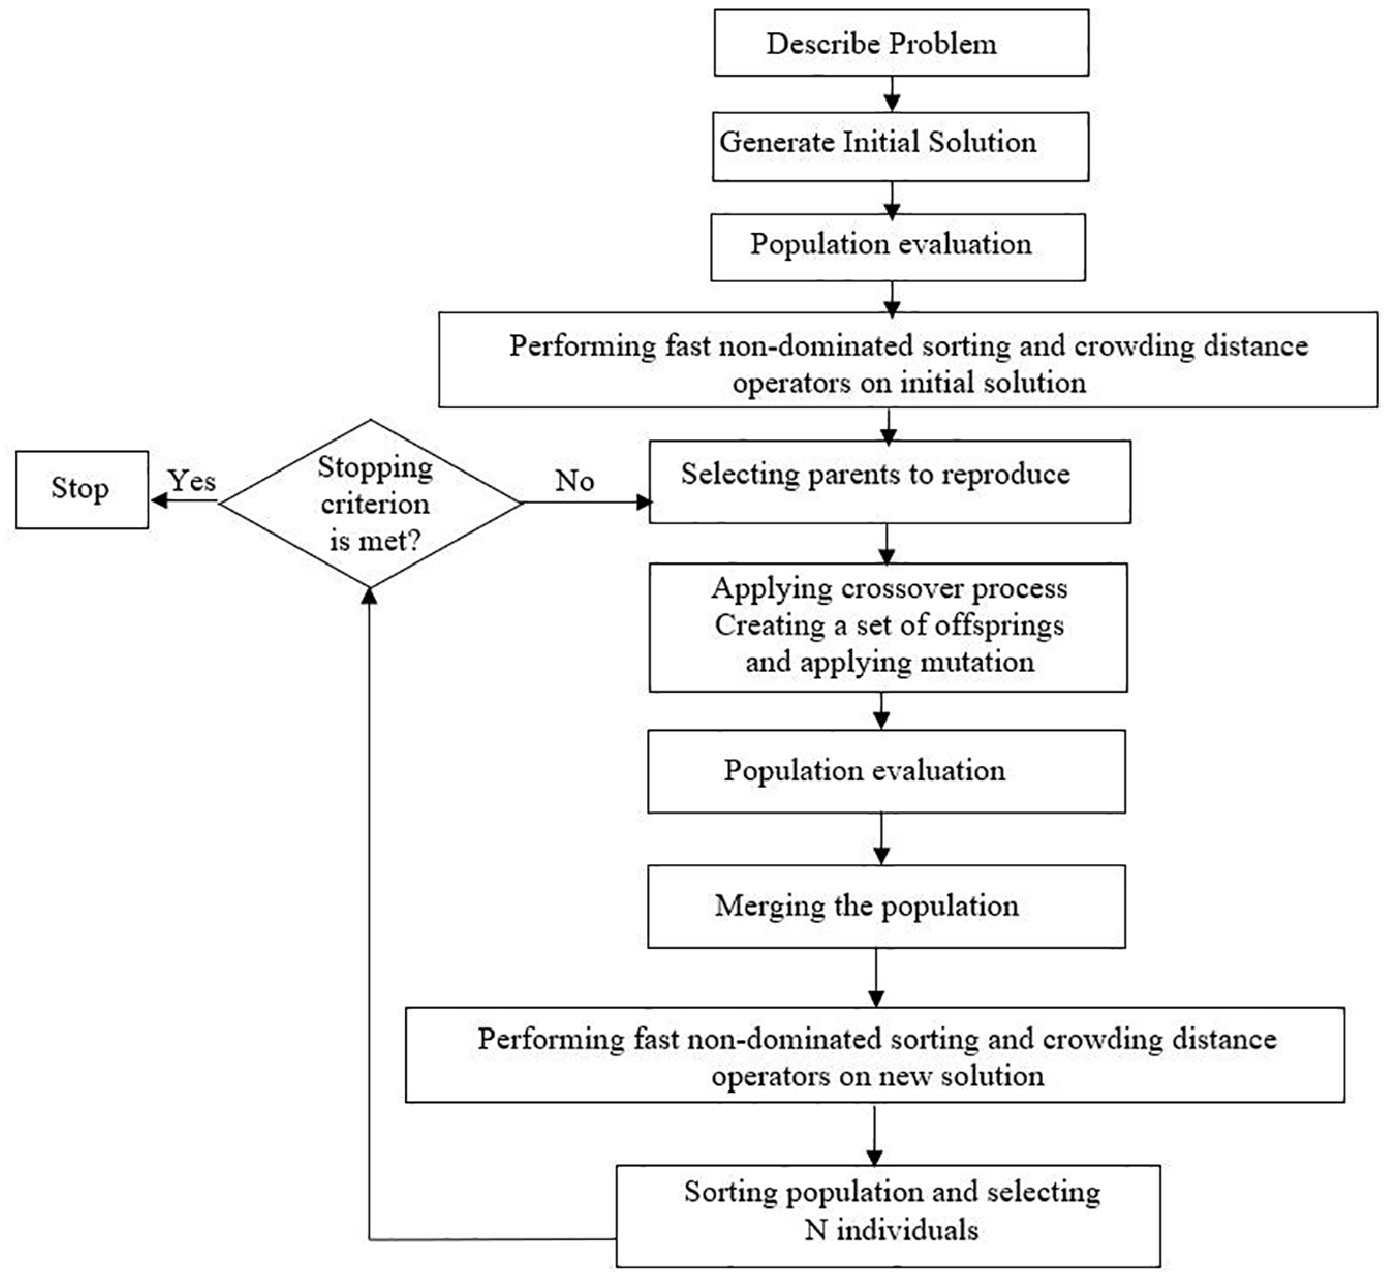
The non-dominated sorting genetic algorithm (NSGA-II) has been broadly employed to solve numerous multi-objective optimization problems.74-78 In the NSGA-II algorithm, the fast non-dominated-sorting operator is exploited to insert the dominance concept via searching the first goal known as convergence. The schematic representation of the NSGA-II procedure and flow diagram are displayed in Figures 6 and 7.

Schematic of the NSGA-II procedure.
Flowchart of NSGA-II.
Structure of the solution in the algorithms
The proposed problem is a complete delivery, so that all demand for each medical item required by each customer must be provided by a supplier and an intermediate warehouse. For validation of the model as well as the solution approach, a SC is considered that includes 3 suppliers, 6 intermediate warehouses and 3 customers, each of them requires a specified amount of 3 medical items with the assumption of complete delivery. Since this algorithm works only with numbers in the interval 0 and 1, then consider the structure of the solution as a matrix with 3 rows and 9 columns. (The number of rows equals to the number of drug items and each of the first to third lines of each row represents the number of intermediate warehouses supplying that drug item to the first to third customers, and the fourth-ninth lines of each row determine that an intermediate warehouse providing the medical item for each customer is served by which supplier, but if the intermediate warehouse is not used to supply the medical item, the value of the number associated with the supplier is considered to be zero). First, fill all matrix strings with the random numbers in the interval 0 and 1, which we call it the position of the solution. The position designed for this problem is shown in Table 2. Figure 8 shows the schematic presentation of the designed solution for r = .74.
An initial position designed for the problem.

Schematic presentation of the designed solution for r = .74.
As described above, the first 3 lines of all rows indicate that the corresponding demand node (first, second, or third) is provided by which of the first, second, third, . . ., sixth warehouses. Suppose that a random number in one of those strings is equal to r. The intermediate warehouse is calculated by the following equation:

In equation (23), sign 5? means the rounding of the inner phrase is downward and number 6 indicates the number of intermediate warehouses. Same relationship is also used for the second part of the solution structure, since the second part of each row indicates the intermediate warehouse supplier number and in this example, the number of suppliers is equal to 3, so, number 6 in the above relationship changes to 3. The positions of solutions are used in all stages of the algorithm, except for calculating the objective functions.
Parameter tuning
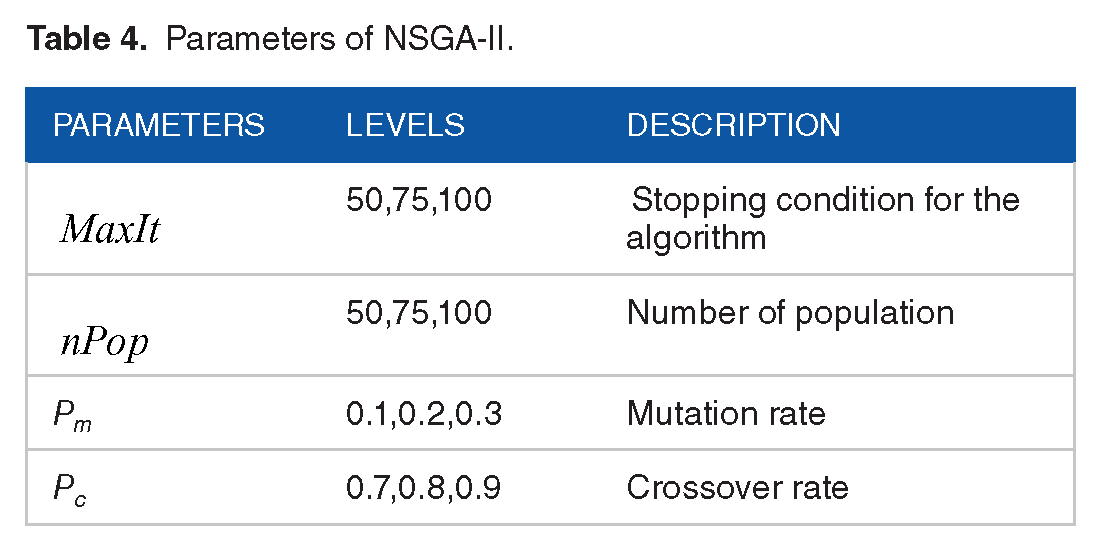
The efficiency of metaheuristic algorithms significantly depends on the values of structural factors of the algorithm. Hence, there are many approaches to tune the control parameters of the metaheuristic algorithms in order to create a powerful solving method. Here the Taguchi approach is used because of its positive features. 79 Hajipour et al. 80 states that the Taguchi method leads to the proper and effective adjustment of the parameters of the algorithm based on statistical evaluations and sensitivity analysis. In this technique, the S/N ratio implies the amount of variation present in the response variable. 81 Some of these parameters values are presented in Tables 3 and 4. The optimal levels of parameters are displayed in Tables 5 and 6.
Parameters of MOPSO.

Parameters of NSGA-II.
The best factor level combination for MOPSO.

The best factor level combination for NSGA-II.

Numerical Experiments and Results
Sample generation
To generate the sample problems, assume that customers, intermediate warehouses, and suppliers are distributed uniformly on a 2-dimensional page, respectively, with dimensions [10,100], [0,100], and [20,120]. Also, their distance is considered as Euclidean intervals (rounded to the nearest integer) and the delivery times are calculated by dividing these intervals into 80 (with one decimal). The values of the parameters
The function of generating the random numbers.

Numerical examples
In this section, various test problems with different sizes (small, medium, and large) are considered and solved to evaluate the efficiency and performance of the proposed solution methods. The computational experiments are performed on a personal PC with Intel, Core i5 CPU, 1 GHz Processor and 4 GB of RAM. Achieving the optimal solution is possible for a problem with 4 customers, 3 medical items, 6 intermediate warehouses and 3 suppliers at a time less than 3600 seconds (small size problems) due to the length of the solution time in the LP-Metric method. Because the GAMS Software is incapable of solving large size problems and needs long time runs for large size problems. Therefore, meta-heuristic algorithms were used in large-size problems. The results indicate that the algorithms are efficient in achieving the optimal solution for small-sized problems and close to the optimal solutions for large-sized problems within a very short time. In the LP-Metric method, it is only possible to obtain a solution that has the minimum difference of the individual optimal value of each objective, while MOPSO and NSGA-II find a set of non-dominated members in the population (Pareto front solutions).
Numerical results for the small-sized test problems
Five test problems in small size were generated and solved with 3 approaches. The results are shown in Table 8.
Comparison of the results of LP-Metric method, MOPSO, and NSGA-II.

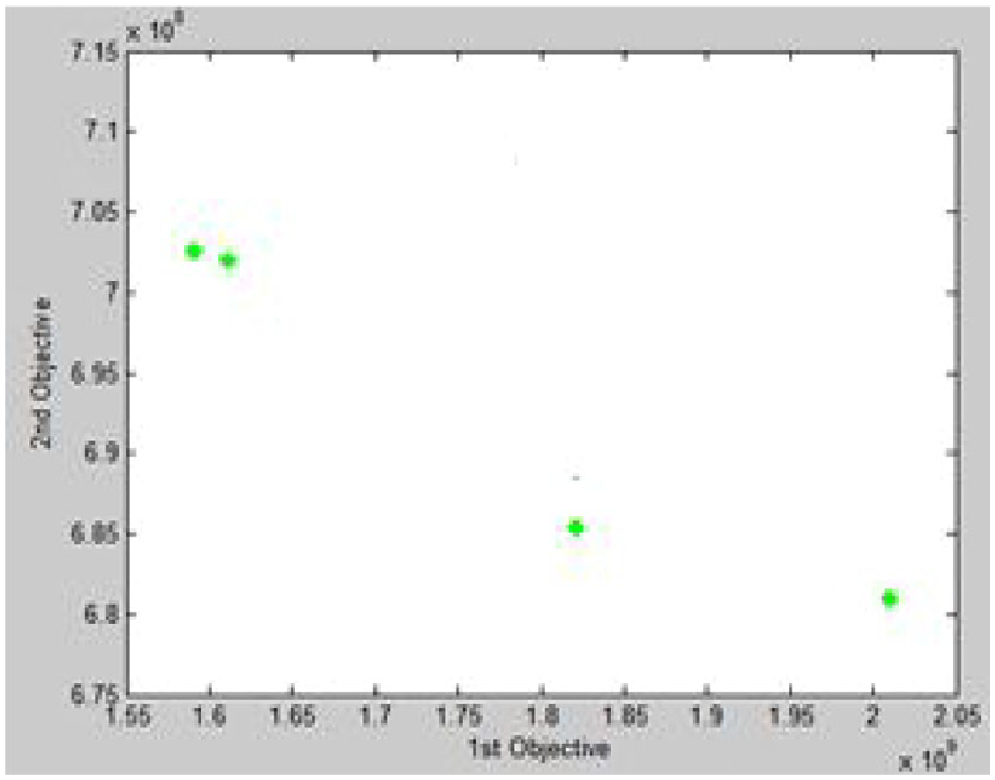
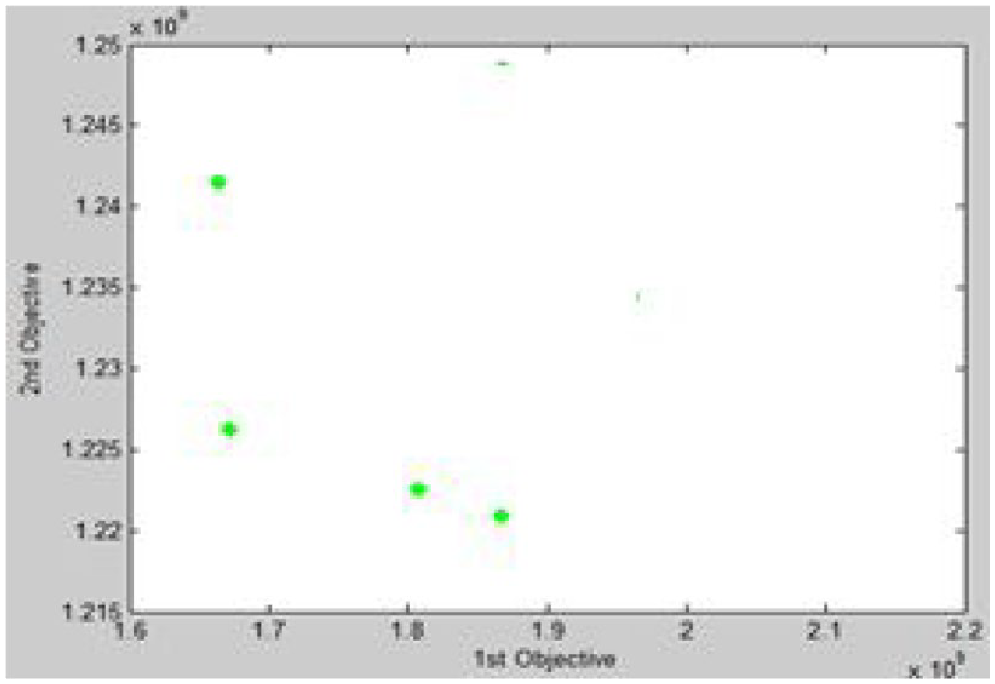
It should be noted that, as a sample, the expression 3 × 6 × 2 × 3 in the specification column of Table 8 means 3 customers, 6 intermediate warehouses, 2 suppliers and 3 items. Error percentage of first and second objective function of mentioned algorithms was calculated for the comparison of each algorithm’s results with the results of GAMS software. According to Table 8, the results of proposed algorithms are similar to the results of LP-Metric method for small-sized problems. Figures 9 to 11 show the Pareto front for problems 1 to 3.

Pareto front for problem S1.

Pareto front for problem S2.

Pareto front for the problem S3.
According to Figures 9 to 11, it can be said that while the value of the first objective function (economic goal) decreases, the value of the second objective function, which seeks to minimize the total time of the presence of the medical goods in the supply chain, increases gradually. On the contrary, if the decision of the managers is to reduce the total time of the presence of the medical goods in the supply chain, more costs should be incurred.
In order to analyze the sensitivity on the parameters that follow the Weibel distribution, the problem
The values of the objective functions corresponding with decreasing and increasing of the values of the Weibel distribution parameters.
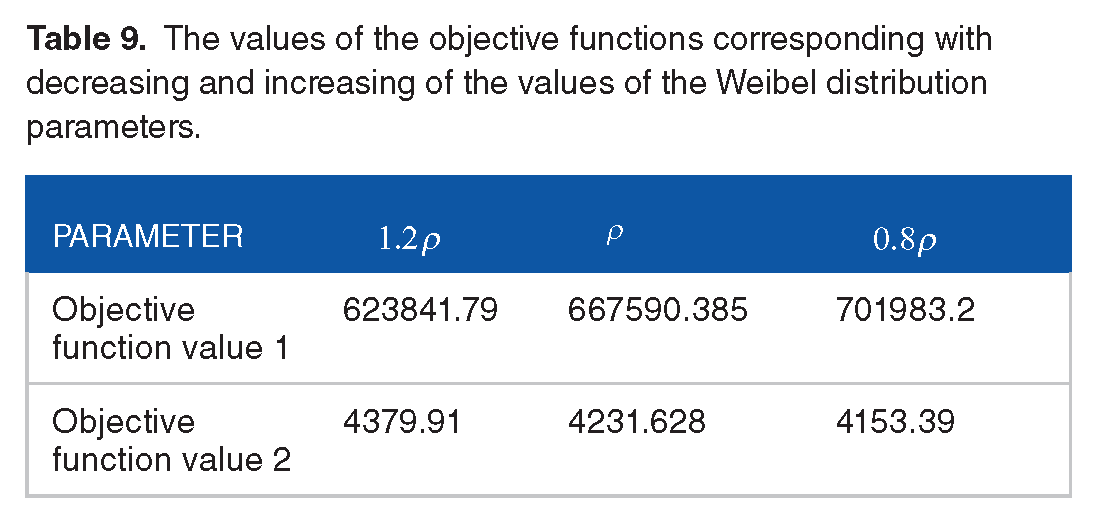
As can be seen in Table 9, the increase in the parameter ρ significantly reduces the value of the first objective function. Also, the decrease in this parameter increases the value of the first objective function significantly. The effect of these changes on the value of the second objective function is completely opposite, so that the increase of this parameter in the Weibel distribution causes an increase in the value of the second objective function, and its decrease causes a decrease in the value of the second objective function.
Numerical results for the medium and large-sized test problems
In this section, several test problems with different sizes (medium and large) are solved to evaluate the performance of 2 presented meta-heuristic algorithms. Totally, ten test problems were randomly generated and solved with the algorithms. The results are shown in Table 10. Figures 12 and 13 are shown to evaluate and compare the performance, objective function values (OFVs) and CPU times of the mentioned parameter tuned algorithms. As shown in Figures 12 and 13, NSGA-II achieves the more suitable solutions for the first and second objective functions than the MOPSO. Also, as shown in Table 10, meta-heuristic algorithms achieve the best quality solutions for medium and large-size problems at a very good time that the LP-Metric did not achieve them at a time less than 1 hour. Also, these algorithms, despite the LP-Metric method, which was only able to achieve an appropriate response, was able to obtain a set of good responses. Figures 14 to 16 show the Pareto front for problems 1 to 3.
Numerical results in medium and large dimensions.

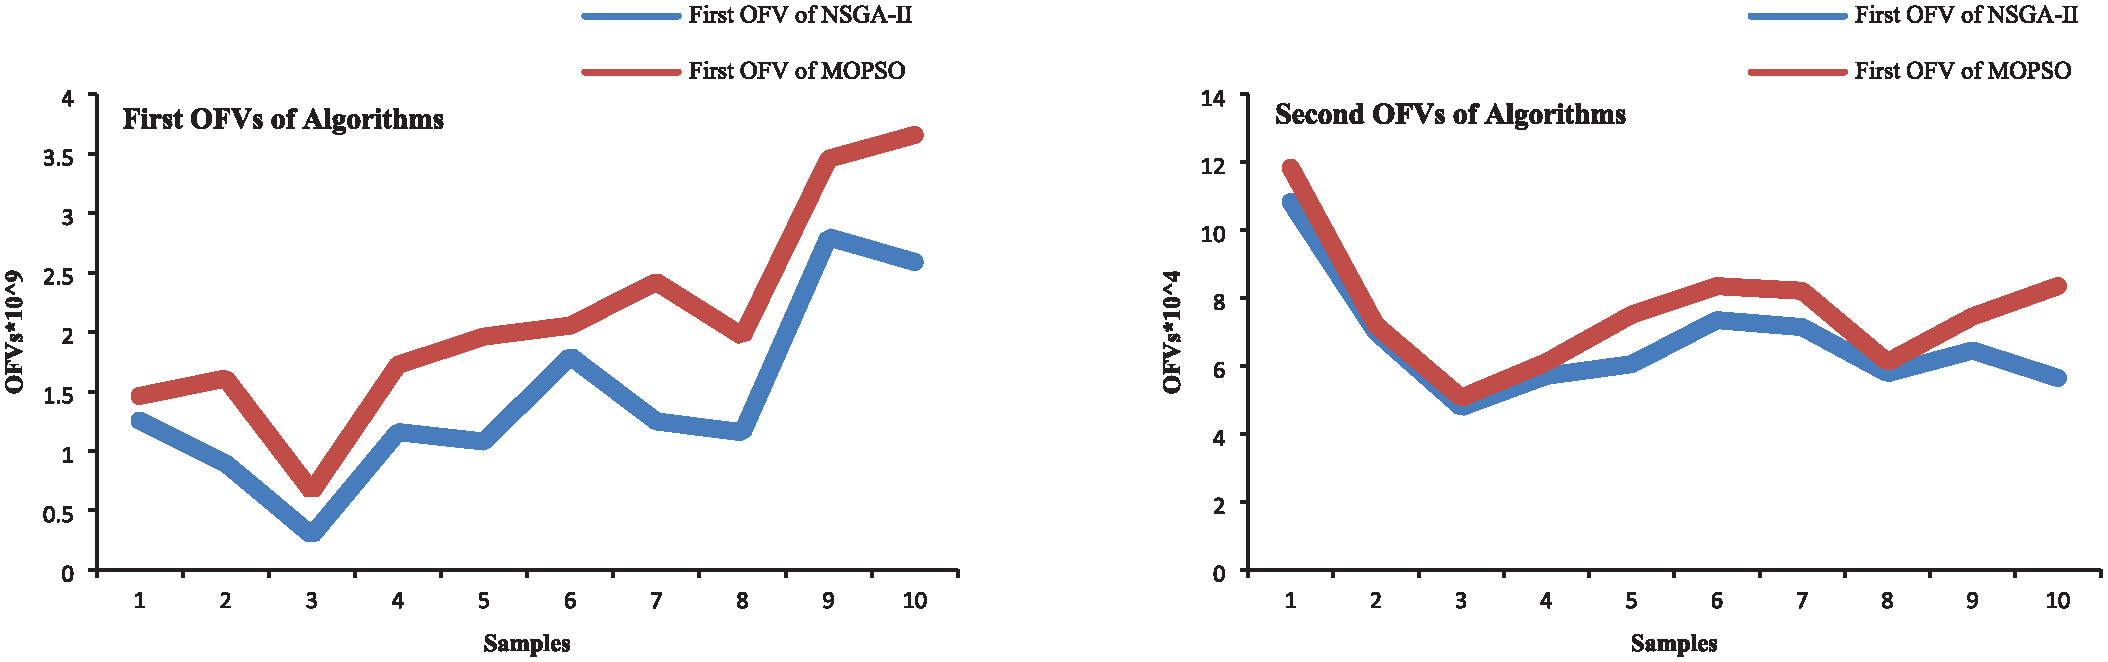
Comparison of the OFVs of the proposed algorithms.
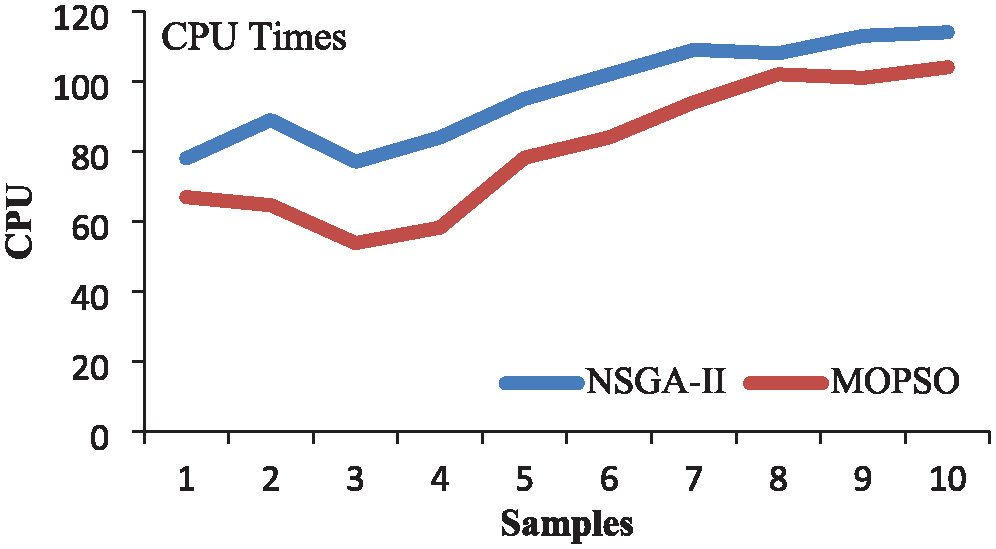
Comparison of the CPU times of the proposed algorithms.
Pareto front for the problem M1.

Pareto front for the problem M2.
Pareto front for the problem M3.
Sensitivity analysis
Sensitivity analysis is performed on several important parameters to assess the impact of various factors on the objective function values.
Sensitivity analysis on
(the cost of transferring the items from the warehouses to the customers)
Problem
The effect of reducing and increasing of

As can be seen, the increase in the parameter
Sensitivity analysis on
(the cost of transferring a medical item from the supplier to the intermediate warehouse)
Problem
The effect of reducing and increasing of

As can be seen, the increase in the parameter
The case study
In this section, the usefulness and practicality of the proposed model as well as the solution method are evaluated based on a real case study. The model was applied to design an effective and efficient perishable medical product SCN in Tehran (the capital city of Iran). The Tehran metropolitan city contains 22 geographically dispersed districts. The customers are allocated based on these districts. Figure 17 shows the location of the pharmacies (customers) in 22 geographical districts of Tehran. This SC involves ten pharmaceutical companies as suppliers, 5 pharmaceutical distribution companies as intermediate warehouses, and pharmacies in 22 districts of Tehran as the final customers for the pharmaceutical products. Six types of widely used drugs in Iran were taken into account as the medical items in this study. A brief description of these drugs and their applications are given below:
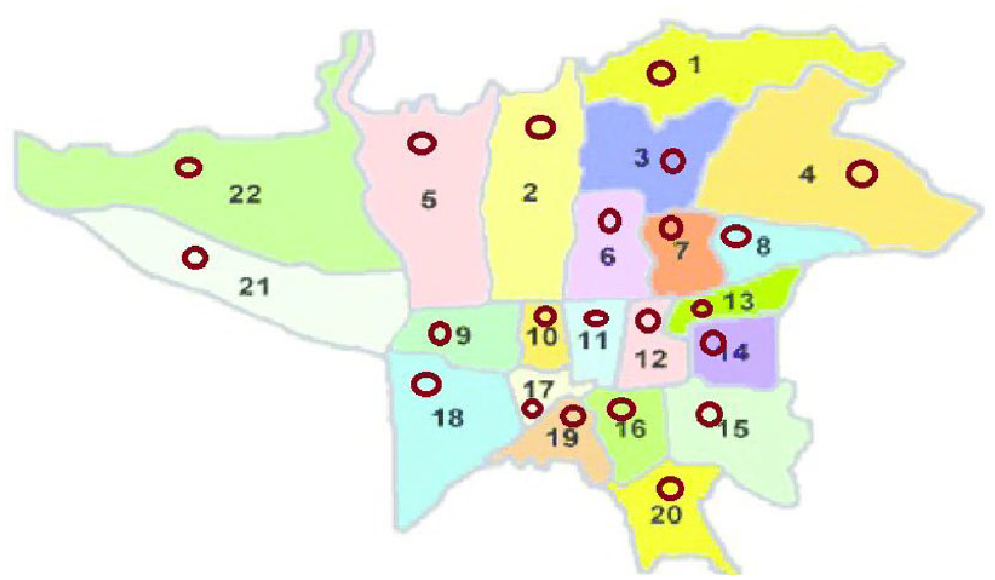
Location of the pharmacies in the geographical districts of Tehran.
Aspirin (acetylsalicylic acid (ASA)) is used to relieve pain, fever, and inflammation in various conditions such as lower back and neck pain, the flu, common cold, and so on. Metformin is an oral diabetes medicine that helps control blood sugar levels. Metformin works by helping to restore your body’s proper response to the insulin you naturally produce. Atorvastatin is used along with a proper diet to help lower bad cholesterol and fats (such as LDL, triglycerides) and raise good cholesterol (HDL) in the blood. Losartan is used to treat high blood pressure (hypertension) and to help protect the kidneys from damage due to diabetes. Metoral (Metoprolol) is a drug called a beta-blocker. It’s used to treat conditions such as high blood pressure, heart failure, and angina (chest pain). Pantoprazole is used to treat certain stomach and esophagus problems (such as acid reflux). It works by decreasing the amount of acid your stomach makes. Table 13 shows the companies that produce these drugs. It is obvious that all drugs are distributed by all pharmaceutical distribution companies.
Pharmaceutical companies of the drug items.

The required data of our case is collected according to valid sources and published studies and travel distances and travel times are obtained from Google maps. Demand of each pharmacy for each drug item is given as a triangular fuzzy number (
Traveling distance between pharmacies and pharmaceutical distribution companies is shown in Table 15. Traveling distance between pharmaceutical distribution companies and pharmaceutical companies is shown in Table 16. The cost of transferring a unit of medical product from pharmaceutical distribution companies to pharmacies and cost of transferring a unit of medical product from pharmaceutical companies to pharmaceutical distribution companies are supposed to be proportional to the traveling distances between nodes (Tables 15 and 16). Travel time between pharmacies and pharmaceutical distribution companies is shown in Table 17. Travel time between pharmaceutical distribution companies and pharmaceutical companies is given in Table 18. Set up cost of intermediate warehouses depends on its storage capacity, if the capacity of distribution companies is supposed to be 16 000 m3 (medium); the opening cost of local hospitals is equal to $800 000.
82
The average life of each drug is estimated to be 300 minutes
Demand of each drugstore for drug items.

Traveling distance between pharmacies and pharmaceutical distribution companies (Co.).

Traveling distance between pharmaceutical distribution companies and pharmaceutical companies.

Travel time between pharmacies and pharmaceutical distribution companies (minute).

Travel time between pharmaceutical distribution companies and pharmaceutical companies (minute).

Tables 18 and 19 summarize the numerical results of the problem. Distribution companies of Alborz and Exir are chosen to be open for storage and transfer of medical items to pharmacies with the goal of minimizing the total cost of the chain and total time of the presence of the items in the supply chain. Table 19 shows that which distribution company provides the medical items required by pharmacies and the quantity of medical products transferred from distribution companies to pharmacies and Table 20 shows the transmission of medical items from pharmaceutical distribution companies to distribution companies.
The assignment of pharmacies to pharmaceutical distribution companies and the quantity of medical products transferred from pharmaceutical distribution companies to pharmacies.

The quantity of transferred medical items from pharmaceutical companies to pharmaceutical distribution companies.

Conclusion
In this paper, a fuzzy bi-objective MIP model for the SCN of perishable medical goods in crisis situation was proposed considering uncertainty. The present problem was the design of a three-level SC for corruptible items, which the corruption of items has a probability function of Weibull. It means whatever the presence of any relief item is more in the chain, the probability of corruption is even greater. The customers are at the first level of chain that are customers for relief items, and the amount of demand for each of them is considered as a triangular fuzzy number. At the second level, there are potential intermediate warehouses that receive, store and transfer relief items from suppliers at the third level, and play the role of interface between 2 levels. The selection of optimal intermediate warehouses and the optimal amount of flow from suppliers to them, and from them to each of the customers, with the minimum cost in the chain and the shortest possible time for the items to be received by the customers, is the object of the problem. And finally, there are suppliers at the third level. In this research, we tried to make the problem as compliant as possible with the real world conditions. The proposed mathematical model can be applied to all infrastructure or disaster types that are compatible with this model.
Three multi-objective approaches (LP-Metric,MOPS and NSGA-II) were utilized for the test problems to compare their performances based on the CPU run times and fitness function values and the results indicate the ability of the model and algorithms to solve various problems. To demonstrate the validity and capability of the developed model, a case study of a SC of perishable medical goods in crisis situations in Iran’s capital, Tehran was considered.
According to the obtained results, key managerial implications can be outlined as follows:
Senior management should consider the issues of transportation and inventory of relief items in a coordinated and integrated framework.
The collection for different situations and changes should be managed, and the planning should not be confined to a definite specific condition, anticipate the uncertainties should be foreseen and proper planning should be provided for them.
The management of the rescue and relief chain should not consider merely the cost factors in the discussion of completing and supplying the network and should always consider qualitative factors in their decisions.
Although it has been tried to identify all the important parameters of the model, due to the abundance of these factors, some other unknown factors may also be effective that were not identified. Also, accessing the required data was challenging, and obtaining the necessary permits took considerable time. In addition, due to the NP-hardness of the problem, it was not possible to solve the problem with commercial softwares such as LINGO and GAMS.
The following suggestions are provided for further studies: The multi-objective model can be solved by other efficient meta-heuristic or heuristic algorithms and results should be compared with the results of this research. Also, other approaches may be considered to cope with the uncertainty of the parameters. In addition, the presented model should be implemented and evaluated on different types of crises and geographical regions.
Footnotes
Funding:
The author(s) received no financial support for the research, authorship, and/or publication of this article.
Declaration of conflicting interests:
The author(s) declared no potential conflicts of interest with respect to the research, authorship, and/or publication of this article.
Author Contributions
Conceptualization, F.S., H.K.; methodology, F.S., H.K., A.H., and M.K.; software, F.S.; validation, F.S., H.K., A.H., and M.K.; formal analysis, F.S., H.K., A.H., and M.K.; investigation, F.S., H.K., A.H., and M.K.; resources, F.S., H.K., A.H., and M.K.; data curation, F.S., H.K., A.H., and M.K.; writing—original draft preparation, F.S., and H.K.; writing—review and editing, H.K., and M.K.; visualization, F.S., H.K., A.H., and M.K.; supervision, H.K., and M.K.; project administration, F.S.; All authors have read and agreed to the published version of the manuscript.