
Abstract
To prevent the great dangers caused by emergency situations, providing rapid and high-quality emergency aid highly depends on the location of emergency medical centers. The purpose of this research is to present a multi-objective mathematical programing model based on the minimum P-envy algorithm to locate and construct emergency medical services (EMS). Maximizing the coverage in order to increase the probability of survival of different categories of patients, minimizing the costs of constructing EMS and optimizing the ratio of regions having the right to emergency medical services is one of the fundamental challenges in the health care system of countries. In this paper, a model for maximum utilization of EMS considering budget limitations is presented. In this study, since the problem is NP-Hard, the Genetic Algorithm (GA) and Simulated Annealing (SA) algorithm were used to solve this problem. The parameters of the metaheuristic algorithms were tuned using the Taguchi method. Several instance problems were solved to compare the performance of 2 algorithms. The results demonstrate that the validity of the proposed model. Also, the mean of the solutions obtained by GA for small, medium, and large-size problems are better than the SA algorithm. Also, the GA algorithm obtained more efficient solutions than the SA algorithm.
Keywords
Introduction
Emergency medical services (EMS) are public services systems whose aim is to answer emergency calls, provide EMS to decrease complications and mortality due to injuries in accidents, provide efficient on-time services to patients, and transfer patients to hospital if needed.1-3 Proving emergency services at the time of the accident is very important because EMS services act as a part of the medical services at the time of the accident before arriving at the hospital. Thus, it can be stated that this type of service plays an important role in saving patients’ lives and decreasing the mortality rate, and has become an important part of modern health systems.4,5 Nevertheless, EMS service providers are usually faced with human resources, vehicles, and fund limitations, therefore assessing this type of service is a complicated task and needs analyzing the relationship between EMS and other available health resources and then deciding intelligibly to make the optimal use of the resources.2,3
In addition to the quality of services, one of the effective factors in improving the EMS operation is the response time and providing services to patients. 1 According to the instructions of the Portuguese National Institute of Medical Emergency, the probability of survival of cardiac arrest victims with defibrillation rhythms decreases by nearly 10% to 12% per minute without electric defibrillation. If the victims receive preliminary life support during this waiting time, this amount decreases to nearly 3% to 4%. 6 Other research demonstrates that support reception should not exceed 8 or 9 minutes in urban areas and 14 minutes in rural areas, and it shows the difference in the availability of emergency care in various geographical areas.1,7 Some countries consider the response time as a criterion. As an example, the United States requires that the response time for 90% of locations in urban areas not to exceed 8:59 minutes. This time limitation changes to 15 and 30 minutes for rural and desert areas, respectively. 8 In Britain, 75% of the most urgent emergency calls should be answered in 8 minutes, and 95% of these calls must receive aid within 14 minutes in urban areas and 19 minutes in rural areas. Hong Kong has defined a 12-minutes limitation for 92% to 95% of cases in rural or urban areas. 2
Furthermore, the number of vehicles and ambulances, their location, and the proper location of EMS centers are additional factors that influence faster service delivery and reduced survival and improvement rates. 2 The proper selection of the location is vital in reducing response time. Thus, the location of these centers in the urban space is a paramount issue. 9 Measures such as estimating this system’s performance based on locating centers and ambulances, as well as determining the required number of ambulances and assigning them to emergency calls, largely contribute to uplifting system performance. In this regard, one of the main issues in EMS management systems is the proper location of centers to maximize regional coverage and provide satisfactory high-quality services to patients. Accordingly, locating EMS system facilities is a critical step for effective decision-making and planning. The population’s right to health care is a challenge in organizing health and treatment systems, considering the likelihood of survival of different groups of patients (depending on the many types of diseases) and the population structure in different regions. Aspects that should be considered when establishing EMS include the constraints associated with building these centers, minimizing the time to provide services, and maximizing coverage.
This study proposes a static stochastic model based on the minimum P-envy algorithm for the localization and construction of EMS centers. The minimum P-envy algorithm was first presented by Espejo et al 10 for facility location. This algorithm compares and prioritizes the difference between the service quality among customers in a binary way. Then, based on the priority, it acts on the facilities allocation. In this research, envy is the difference of dissatisfaction between the applicant areas. Since the different demands of the areas have a different number of customers, the envy of each demand area is weighted according to the demand of each area. The objectives are to maximize the survival rate of patients with various diseases by minimizing the time to provide services and the cost to build such centers (budget constraints) and to optimize the rights of different regions to receive EMS services. This algorithm measures the right of an area to receive treatment facilities relative to another area to minimize the sum of these ratios in a region. In this study, the GA and SA metaheuristic algorithms were used to solve the problem since the problem is NP-hard (Non-deterministic Polynomial time). It should be noted that when the problem size increases, the computational time increases exponentially, therefore, the exact methods are not able to find the optimal solutions for large-sized problems. For this reason, the use of meta-heuristic algorithms for solving the NP-hard problems seems to be the most suitable decision. 11 Then, a sample problem was solved in Minitab to validate the proposed multi-objective mathematical programing model as well as the algorithms. Finally, several problem instances were solved using the GA and SA algorithms to compare the performance for the problem in hand.
Literature Review
Locating EMS centers is one of the most important research areas that has recently received considerable attention. Thus, several approaches and perspectives have been explored in recent studies in this field. Chanta et al 12 used the minimum P-envy model to locate EMS centers and find facilities considering customer satisfaction and equal access to facilities in all areas. They also studied this algorithm in 2014 to locate EMS centers by considering the minimum symptom rate constraint. They then solved this algorithm using meta-heuristic algorithms. 12 That same year, they also proposed a bi-objective model for locating EMS systems in rural communities to balance first-response medical service levels to patients in semi-urban and rural areas by locating ambulances at appropriate stations. Their results indicated the quality of services in rural communities is lower than in urban communities. The model they propose could address this disparity. 1
Nelas and Dias 2 developed a location optimization model for ambulatory transport vehicles based on vehicle types and the level of care they can provide as a function of the time required to provide the service. They demonstrated uncertainty through a series of scenarios, developed an exploratory method for solving the problem, and tested it against real data. Their results indicate the significance of faster service delivery to patients and locating vehicles for time management. El Itani et al 13 proposed a bi-objective covering location to solve the problem of ambulance location in Beirut, Lebanon. They showed that the proposed model could reduce the operational costs of EMS centers by shortening the time needed to satisfy EMS demands in Beirut. Karpova et al 14 presented an innovative model for the dynamic re-location of ambulances. Isochron overlap analysis was used to determine location scenarios. The findings showed that the designed proposed algorithm had a better performance than before.
Castañeda and Villegas 15 introduced a facility location model to extend the coverage of existing EMS in Colombia for people injured in traffic accidents, determine the location of new EMS facilities, and calculate the optimal number of existing and future ambulance fleets. They showed that increasing the size of the fleet plays a more important role than repositioning it. Cheng and Liang 16 proposed a multi-objective model to meet EMS demands in cities and railway stations. The aim was to maximize the coverage of ambulance stations in cities and train stations. Their analysis found that proper placement of the rescue source point could increase the effectiveness of rail accident rescue and the demand for urban medical services. Ferrari et al 17 also developed a multi-objective model for locating EMS centers to maximize the number of service delivery and demand coverage and minimize the number of facilities and the distance between them. In that research, the calls for EMS and the population at demand points were integrated into a network of demands.
Mohri and Haghshenas 18 proposed a mathematical model to solve an edge maximal covering location problem. The aim was to locate a set of ambulances to cover emergency demands due to rare and random accidents. They also applied an empirical Bayes (EB) method to the observed frequency of crashes to reduce errors caused by the random feature of the crashes. Kepaptsoglou et al 19 also introduced a hybrid standard location model to determine the optimal location of ambulances in cities to reduce the severity of traffic accidents. Their proposed model considers the frequency and severity of traffic crash in the demand network but does not address the current location of emergency facilities, while the response time of ambulances at all urban points during emergencies is considered fixed. Navazi et al 20 proposed an air and ground ambulance location model to cover accident-prone points with indeterminate demand. The model aimed to model ground EMS stations and determine the required hospital bed capacity and blood and drug inventory. The proposed model also considered budget constraints and the number of emergency vehicles. The proposed model reduced the cost and time required to provide services. Luo et al 21 proposed a multi-objective model for locating EMS stations to maximize total population coverage. Findings related to Pareto solutions show that there can be less urban-rural disparity if all new stations should be located in rural areas, but if higher coverage of the entire population is more desirable, a new station in an urban area is preferred.
Shetab-Boushehri et al 22 proposed an optimization model to solve the EMS station location and ambulance allocation problems. To obtain more realistic results, it was assumed that the demand for medical aid demands from any location in the city at any time slot of the day has a probabilistic distribution. To account for traffic fluctuations in the modeling process, it was also assumed that the arrival time at the requested location is a time-dependent variable. To tackle the complexity of the proposed approach and find optimal solutions in a reasonable execution time, some heuristic algorithms were used to solve the ambulance routing problem and the proposed nonlinear integer model. The results showed that relocating EMS stations and reallocating ambulances would lead to considerable improvements in both response time and coverage area in Isfahan.
Nadar et al 23 addressed the ambulance re-locating according to the demand time changes using the combined memetic coded algorithm. The presented model considers heterogeneous performance criteria based on survival performance and coverage of different types of patients. The results of this research showed that by ignoring the demand time changes, the number of ambulances needed increases by 15%. Un and Cheng proposed a dynamic mathematical model to solve the EMS services location-allocation problem. The results indicated that adding a floating station could significantly improve the performance of existing EMS systems. Kung et al 24 developed an optimization framework to solve the location-allocation problem of pediatric EMS stations in the U.K. The model aimed to locate EMS stations, determine the number of allocated teams to each station, and identify the hospitals each station serves. They considered stochastic journey times in the modeling process and used GA to solve the model.
Yang et al 25 developed a multi-objective model to account for insufficient data insufficiency, post-accident indeterminate demand at minimum time, maximum satisfaction, minimum delivery cost, and minimum psychological harm. Their proposed model was solved using on dominated sorting GA and was validated against objective examples. They reported a reduction in time and cost of 7.75% and 26.65%, respectively. Hashemi et al 4 proposed a mathematical model for locating EMS centers to improve demand coverage qualitatively and quantitatively. The model was first solved in small dimensions in GAMS. Furthermore, since the model is np-hard, it was then examined in large dimensions using GA. They found that the model can be effectively used to meet EMS demands and locate EMS facilities. Fritze et al 26 adopted an integrated approach by combining spatial information and integer optimization for EMS location planning. The approach considers the maximum number of emergency care physicians. Their proposed model showed that in low-populated areas, the coverage could be improved with fewer emergency care physicians. Karatas and Yakıcı 27 developed a multi-objective location model to determine the number and location of temporary emergency service centers (TEMCs) for the regional distribution of natural gas in Turkey. The model considered 3 objectives, including p-median, maximum coverage, and p-center, to minimize the average transfer time. In that research, the iterative facility location algorithm was used to solve the location problem. Liu et al 28 proposed a robust optimization method for optimizing an EMS system. The objective was to minimize the total cost of an EMS system depending on the station construction, its location, and ambulance allocation and maintenance. Table 1 summarizes the key features and objectives of the relevant studies.
A brief of relevant studies.

In many of the studies mentioned above, route optimization is discussed as a major factor in the location of EMS. However, other important factors are involved in the provision of EMS: ambulance capacity, demand location, duration of service provision, costs, and building constraints. Accordingly, the location of EMS stations and the required number of transport vehicles and ambulances should be managed to minimize the cost of serving patients, building EMS stations, and EMS facility allocation. To this end, we proposed a static probabilistic model based on the minimum P-envy algorithm for the location and construction of EMS centers.
The main objective of this research is to propose a multi-objective optimization model considering the minimum P-envy algorithm for locating and constructing emergency medical services (EMS). The specific objectives of this research are to:
(a) maximize the coverage of emergency services so as to increase the survival probability of patients,
(b) minimize the EMS construction costs, and
(c) minimize the service time.
The proposed algorithm measures the right of one area to use treatment facilities relative to another area to minimize the sum of these ratios in an area. Since the problem is NP-hard, 2 Genetic Algorithm (GA), and Simulated Annealing (SA) Algorithm were used to solve it. Then, a sample problem was solved using Minitab to investigate and validate the model. The proposed model can maximize the survival probability of various patient groups and coverage, minimize the construction cost of EMS centers, and optimize the right of areas to use EMS centers depending on the ambulance capacity and lack of access to an ambulance when it is used for emergency response.
The rest of the paper is structured as follows: Section 3 presents the methods and hypotheses. Section 4 discusses the mathematical model and how to optimize it. Finally, Section 5 presents the conclusions.
Multi-Objective Mathematical Programming Model
The model is developed based on the following assumptions.
Building stations (EMS centers) is subject to budget constraints.
The ambulances have equal capacity.
The parameters, variables, and symbols used in the research to formulate the model are described below:

The proposed optimization model
As mentioned in the previous section, this section explains the mathematical model for the location of EMS stations. In this research, the development of the minimum envy model is based on the budget approach of an area for providing services to customers.
One of the major weaknesses of the P-envy model proposed by Chanta et al 12 is that it allocates only 1 ambulance to each area. This is while, under real-world conditions, more ambulances may be needed due to demand constraints, such as in densely populated areas. In addition, most models for the location of EMS centers do not consider ambulance capacity. This aspect had to be considered in the proposed model. In this study, the budget constraints of an area were included in the developed minimum P-envy model to further simulate real-world conditions. Based on the allocated budget, the model determines the optimal point for an EMS center in the area, taking into account the costs of medical services, ambulance purchase, incomplete coverage of an area and coverage by auxiliary stations, and services provided by the main and auxiliary stations. The proposed model is as follows:
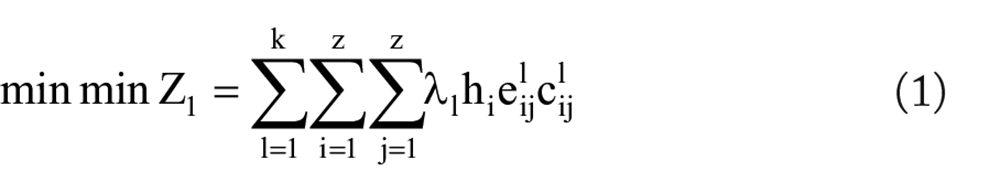


In this research, the development of the minimum envy model is presented based on the budget approach of an area to provide services to customers. The first objective function (1) indicates the cost of the non-equitable distribution of facilities between regions. For this purpose, the function provided by Chanta et al
12
is multiplied by the cost factor
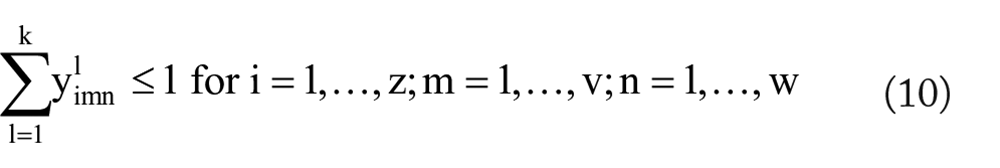
The constraints of the mathematical model are discussed below:
The constraint (5) indicates the right to have (envy) of area i relative to area j at the
Solution Methodology
Algorithm design
In this study, in order to design the required algorithm, it is necessary to determine the amount of production, clearance, allocation, and storage, as well as the number and volume of vehicles used. To this end, 2 sets of input information were defined for each algorithm. The first set refers to the algorithmic parameters. For the SA algorithm, the parameters include the initial temperature, the final temperature, the temperature control parameter, the number of iterations, and the termination condition. In GA, the first set includes the initial population (the initial population is generated randomly, the combination probability, the mutation probability, and the number of iterations). The second set of information includes the minimum and maximum production, clearance and storage of goods, as well as the minimum and maximum capacity, and the number of vehicles. The implementation of the algorithms includes the initial solution of SA and the initial population of GA.
The Genetic Algorithm (GA)
The Genetic Algorithm (GA) has been broadly employed for solving the optimization problems so far. GA is categorized into the evolutionary algorithms, which is a part of artificial intelligence. The special features of this algorithm make it impossible to consider it a simple random searcher. In fact, the basic idea of this method is inspired by Darwin’s evolutionary theory, and its function is based on natural genetics.
Representation of the solutions and the generation of the initial solution
In this study, a single-string chromosome was used to represent the solution to the problem in question. In this chromosome, the numbers in the first string represent the number of ambulances, while the numbers in the second string represent the capacity of ambulances at the potential station points. In this study, to produce the initial population and subsequent populations (at different times and with different capacities), the limitations number of ambulances and their capacity were considered, and the initial population was generated. The limited number of ambulances and their limited capacities should be taken into account to generate the initial and subsequent populations (at different times with different capacities). The fitness of each solution is defined based on the objective function. The objective function of the proposed problem is multi-objective and includes the costs of construction, lack of access to medical facilities in an area, and the costs associated with not receiving treatment. In the selection stage, a pair of chromosomes are selected and combined. The selection operator links 2 generations and passes some individuals from the current generation to the next generation. In this study, the fittest chromosomes were selected from the population (depending on the population size) using roulette wheel selection. Roulette wheel selection is a method in which individuals are selected based on their fitness proportion. A proportion of the wheel is assigned to each possible selection based on its fitness value. At each selection stage, one individual is selected, and this process is repeated so that a sufficient number of pairs are selected for the next generation. In this study, the fittest individual (with the most iterations) is selected with a high probability after determining the fitness of each individual in the population and their spatial iterations.
Termination condition
The termination condition in the proposed algorithm is the number of iterations. The GA parameters include population size and crossover and mutation rates. Table 2 shows 3 classified 3-level parameters. For this experiment, the orthogonal array was determined in Minitab (Table 3).
The levels of the GA parameters.

Orthogonal array of 3-level GA.

Then, each experiment was performed at 4 specified levels, and the mean solutions were calculated for the objective function of the problem. Table 4 shows the signal-to-noise ratio and the objective function.
Signal-to-noise ratio and objective function.

The signal-to-noise indicates the sensitivity of the feature in question to input factors in a controlled process. In this study, the signal-to-noise values for each level were calculated in Minitab (Table 5). These values can be used to measure optimal levels.
Level values of genetic parameters.

Thus, the optimal values (Table 2) will be population size: 2000, crossover rate: 0.5, and mutation rate: 0.1. Figures 1 and 2 display the signal-to-noise changes of the GA parameters at different levels.

Signal-to-noise diagram of analysis of 3 GA parameters at different levels.

The average values of the objective function in the analysis of 3 GA parameters at 3 different.
Analysis of variance
Since fractional factorial experiments consist of a chosen subset (fraction) of the plausible runs of a full factorial design, proper statistical methods are needed to verify the accuracy of final results. Analysis of variance is a standard statistical method to calculate the degree of confidence and determine the percentage of participation of each variable in the process output. This section discusses the results of the statistical analysis performed at a 95% confidence level (with 5% uncertainty). An F statistic is used to determine the effect of the significance level of a parameter on the model output. At a 95% confidence interval, if the value of P for each parameter is above .05, the effect of the parameter on output is significant. Table 5 indicates that the value of P for all parameters is above .05.
The F-test or frequency is used to determine the significance of the effect of parameters on output. As shown in Table 6, population size is the most important determinant of the GA performance, which was rejected at 5%. The crossover and mutation rates at the introduced levels show insignificant differences at 5%.
Signal-to-noise variance analysis for GA.

The design of the simulated annealing (SA) algorithm
The SA algorithm literally means to melt the object, but in the term, it is a physical process to raise the object’s temperature until it reaches the melting point and then cool it under certain conditions, during this process, the energy of the object is minimized.
Solution encoding and the generation of the initial solution
In most cases where a problem is solved using meta-heuristic methods, an appropriate approach to representing solutions to the problem is needed. The proper approach to solution representation can significantly improve the algorithm’s performance. The representation should be defined to encompass the entire solution space and facilitate the generation of neighboring solutions.
The SA solutions were generated the same as the GA solutions, with one difference: the initial population of GA is randomly generated, whereas, only one possible solution is randomly generated in the SA algorithm.
Tuning the parameters of the SA algorithm
The parameters of this algorithm include the initial temperature, the cool-down factor, and the iterations per temperature value. The number of iterations of the SA algorithm (t) is the main criterion for solving the location problem. The final temperature can also be regarded as a criterion. The proposed algorithm tests each parameter at 3 levels (Table 7).
The parameter levels of the SA algorithm.

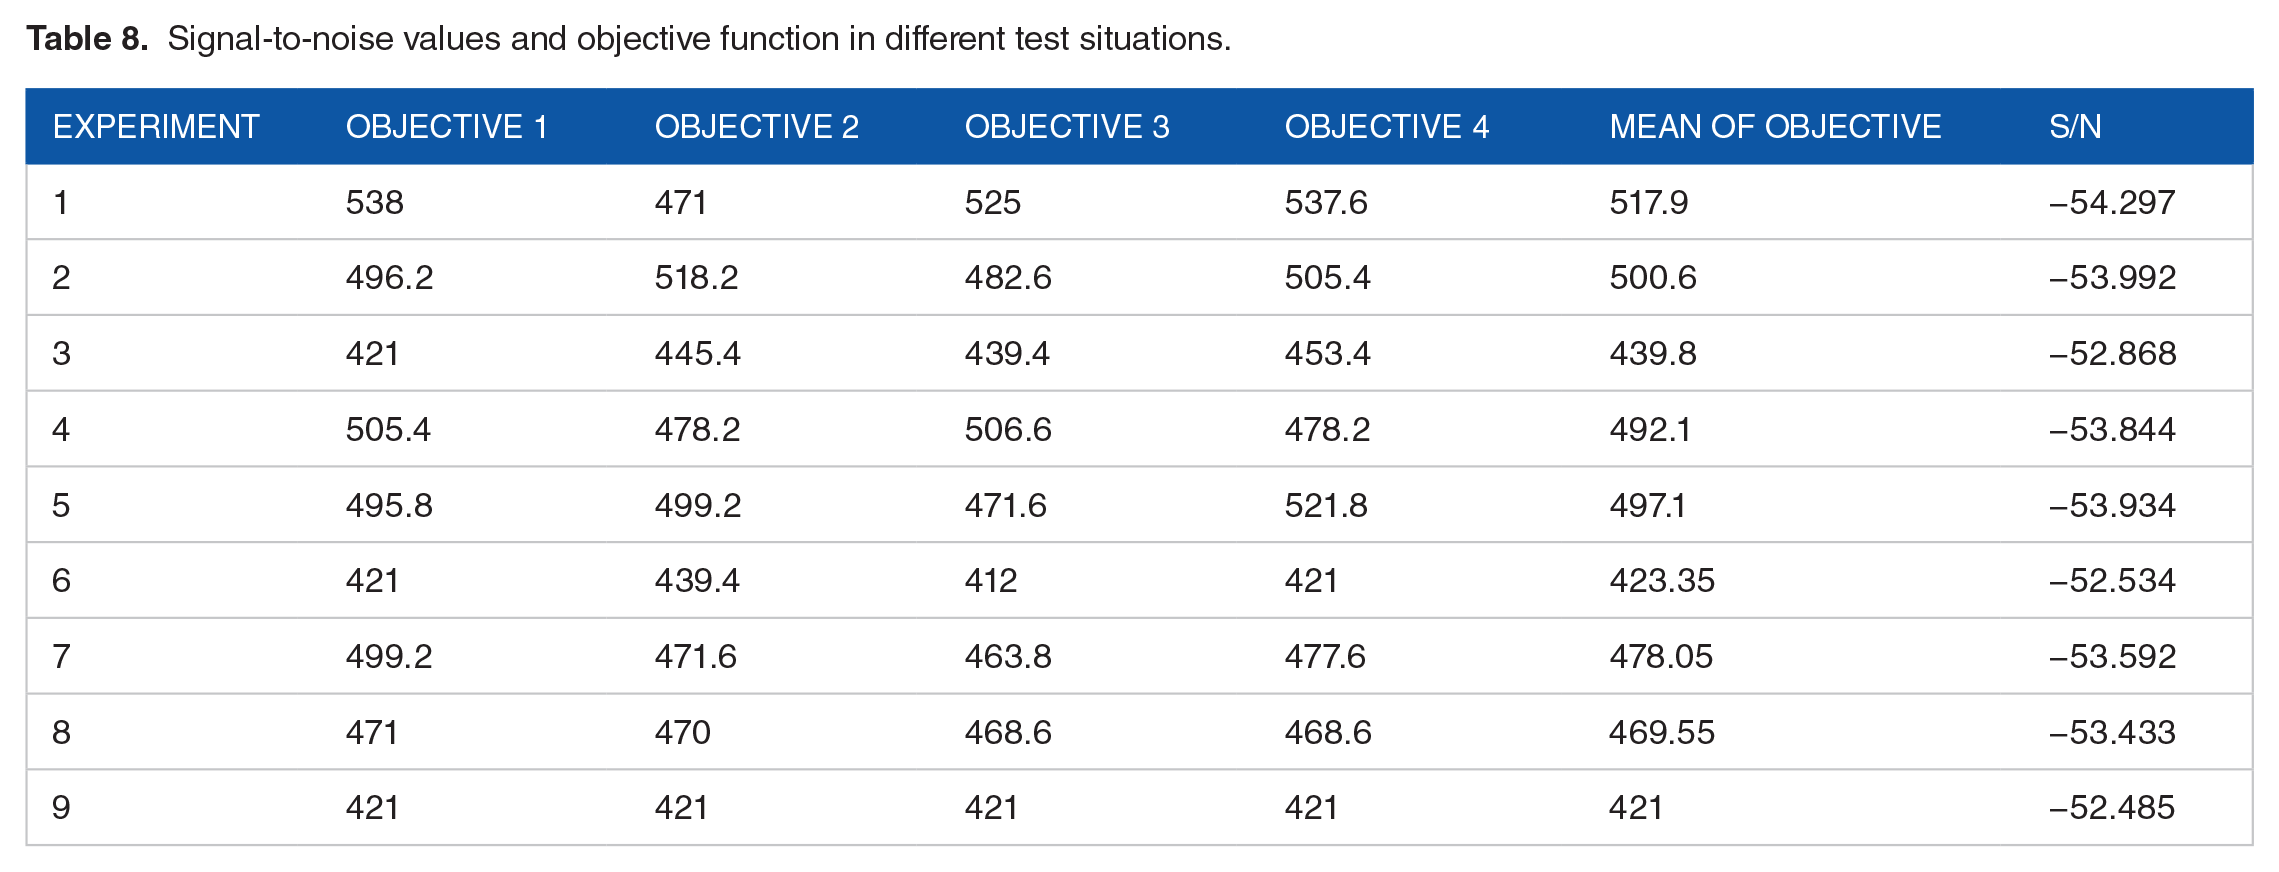
In this algorithm, the orthogonal array was used, as its parameters, similar to GA, have three 3-level factors. Now, each experiment was performed 4 times at the specified level to calculate the mean responses for the objective function of the problem (Table 8).
Signal-to-noise values and objective function in different test situations.
In the next step, the signal-to-noise ratio values for each level were calculated in Minitab (Table 9). These values can be used to determine the optimal levels. Note that the levels with the lowest signal-to-noise values are usually selected as parameters.
Signal-to-noise values for parameter levels of the SA.
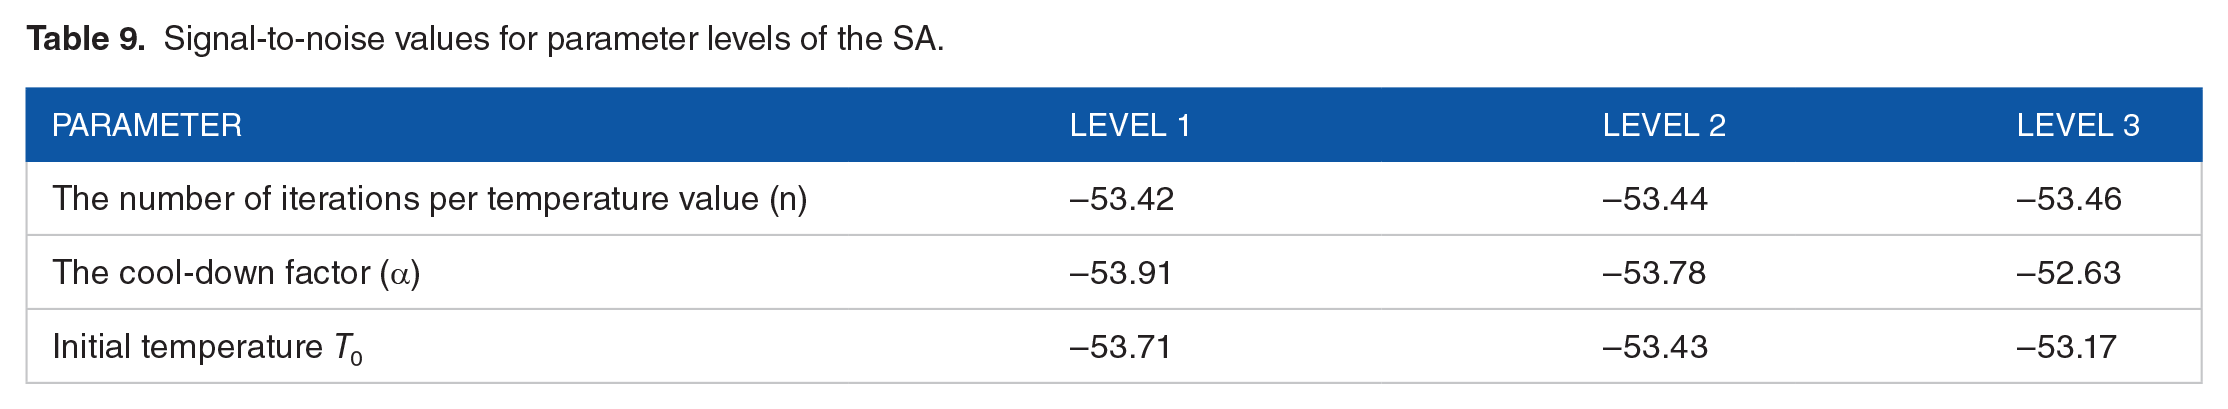
As shown in Table 7, the optimal will be as follows:
The number of iterations per temperature value (1000), the cool-down factor (0.99), and the initial temperature (50). Figures 3 and 4 show the signal-to-noise changes of the parameters at different levels in the SA algorithm.

Signal-to-noise diagram of analysis of 3 parameters at 3 different levels in SA.

Average values of the objective function in the analysis of 3 parameters at 3 different levels in the SA.
Analysis of variance
Table 10 also shows the analysis of the variance of the SA algorithm. As shown, the number of iterations per temperature value is the most important determinant of how the SA algorithm operates. At a significance level of 5%, the equality of this parameter’s levels is rejected. In addition, the cool-down factor and the initial temperature do not significantly differ from the proposed levels at a 5% significance level.
Analysis of signal-to-noise variance of the SA algorithm.

Validation of the proposed algorithm and statistical comparison
To validate the designed model and algorithms, 90 sample problems were solved and compared in small, medium, and large dimensions with random data. Note that the termination condition considered was 100 iterations for both the SA and GA algorithms. The data of the problems were randomly generated, and Table 11 shows the results of the algorithms running. The algorithms parameters are equal to the values obtained in the parameter setting section, and the stopping condition for both algorithms is 100 consecutive repetitions. Table 11 shows the mean values of the objective function of the different problems for the algorithms designed in this study.
Average values of the objective function related to problems with different sizes.
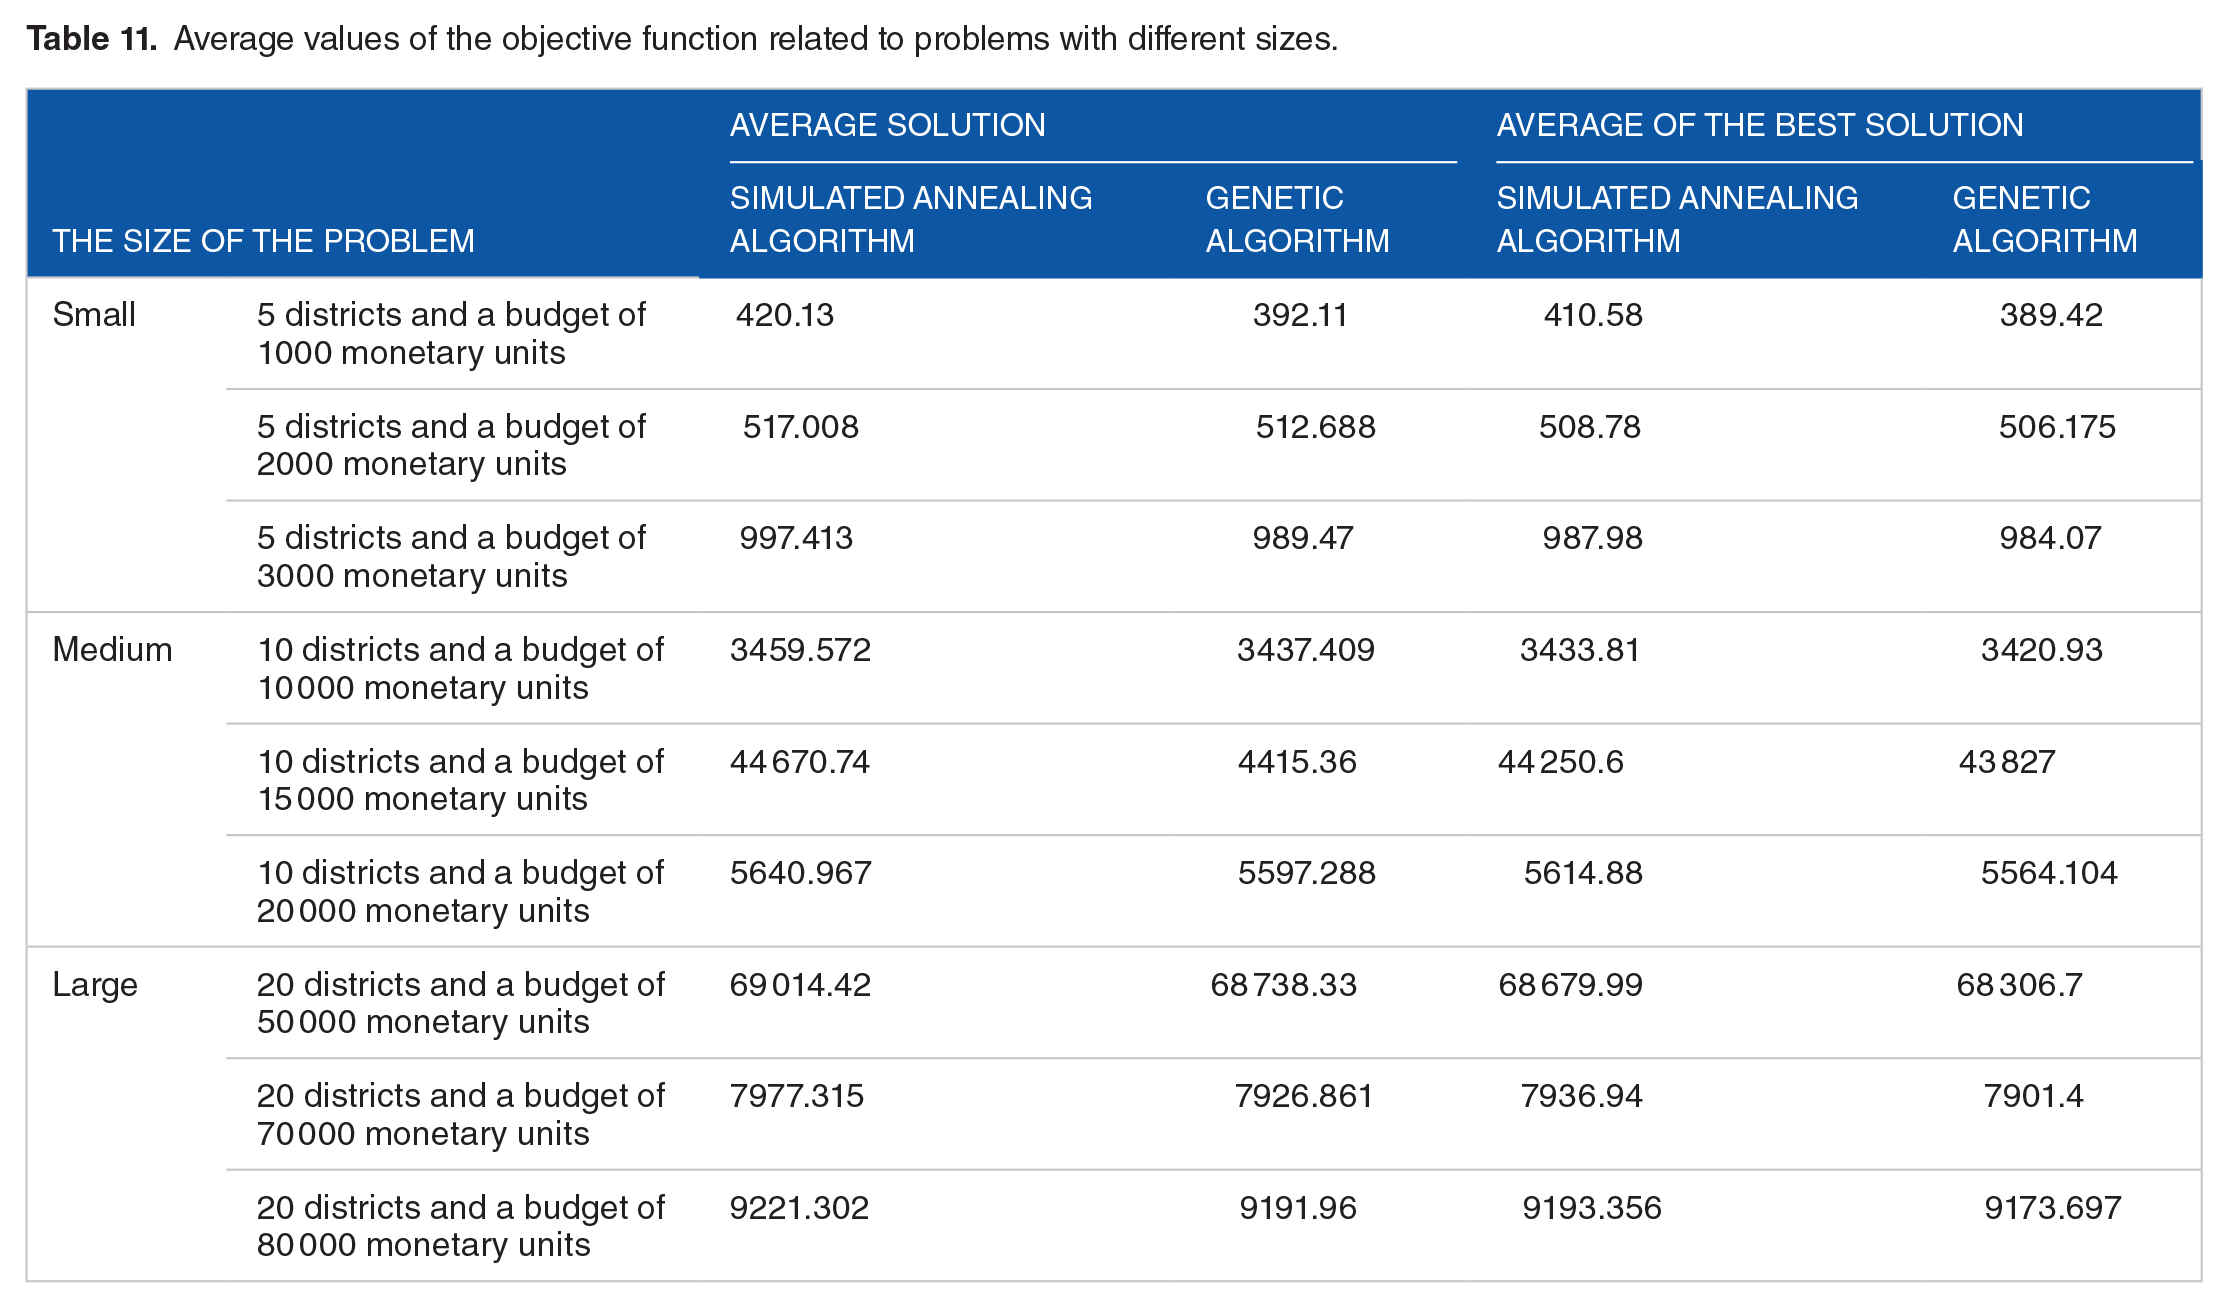
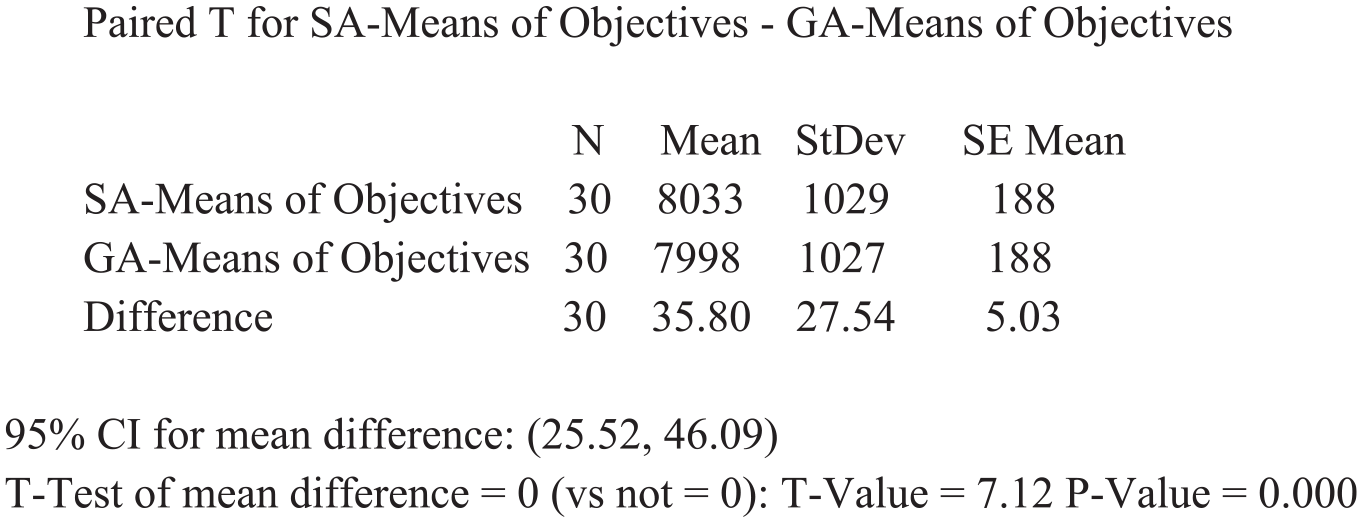
Based on Table 11, the results of the metaheuristic algorithms proposed to solve the problem reveal that the solution means of GA are better than those of SA in terms of the objective function value for all problem instances. It can also be stated that the GA solutions are much more efficient than SA. What is obtained from the comparison of the results obtained from solving the problems by these algorithms is that in all the GA problems, in terms of the value of the objective function, which is of the minimization type in all the problems, it has a better output and produces better quality solutions. Then, in order to make a more scientific comparison of the 2 algorithms, the equality hypothesis test was used to test the equality of the means in paired observations. In this method, observations are made in pairs, and each observation pair is done under the same conditions so that the conditions change from one pair to another. It should also be mentioned that this test was conducted with 30 questions for each size, so it is assumed that the data has an approximately normal distribution. The findings demonstrate that for small-sized problems, the equality of the mean of the solutions of the function is rejected at a 5% significance level. Since this statistic is not in the desired range, it can be concluded that the mean values of the solutions of GA are better than those of SA for small, medium, and large size problems (Figure 5).

Output for pairwise comparison of average solutions of algorithms for small-sized problems.
Regarding the equality of solution means of the 2 algorithms (Figure 6), the result of the paired sample t-test was rejected at a significance level of 5%. Thus, the GA solutions are considerably more efficient than those found by the SA algorithm.

Output for pairwise comparison of the quality of algorithm solutions for small-sized problems.
Figures 7 to 10 show the output of Minitab for the pairwise comparison of the mean solutions of the algorithms and the quality of the solutions in the medium- and large-dimension problems. In all the tests above, the equality of means hypothesis was rejected. Accordingly, the GA solutions are significantly more efficient than those obtained by the SA algorithm.

The output for pairwise comparison of average solutions of algorithms for medium-sized problems.

Output for pairwise comparison of algorithm solution quality for medium-sized problems.
Output for pairwise comparison of the average solutions of the algorithms for large-sized problems.

Output for pairwise comparison of the quality of algorithm solutions for large-sized problems.
Discussion
EMS centers are among the most important dimensions of health systems. They provide primary EMS and transfer patients to the optimal health care center. However, these centers have limited resources (staff and transport equipment) that should be allocated through wise decisions. Various decisions, such as locating stations, transport equipment, number of allocated centers and equipment, staff scheduling, construction costs, and the allocated budget, can affect the services provided by these centers.
In this paper, the problem of locating EMS centers under budget constraints was investigated. To this end, a probabilistic static model was developed based on the P-envy minimum algorithm for the location and construction of EMS centers. The objectives are to maximize the survival rate of patients with various diseases by increasing the survival probability of patients, lower EMS construction costs, and minimizing service time (budget constraints). In this study, an area’s budget constraints were incorporated into the developed minimum P-envy model to further simulate real-world conditions. Based on the allocated budget, the model determines the optimal point for an EMS center in the area, taking into account the costs of medical services, ambulance purchase, incomplete coverage of an area and coverage by auxiliary stations, and services provided by the main and auxiliary stations. The main goal of this model is to provide emergency medical services with different financial budgets, so that with specific budget, it provides the best performance of the emergency medical service system. After the proposed algorithm design, the metaheuristic GA and SA algorithms were used to model the problem since the problem is NP-hard.
For this purpose, in the first step, after designing GA using MINITAB software, the problem was analyzed, and the results were presented. Then, since only a part of possible states is tested in fractional factor tests, an analysis of variance was used to ensure the final accuracy of the results. Variance analysis is a standard statistical method that was used to calculate the degree of confidence and determine the percentage of participation of each variable in the output of the process. The results of variance analysis for the performance of GA showed that the most important factor determining the performance of this algorithm is the population size parameter. Because the value of P in the middle of 95% was less than .05. In addition, the parameters of the Crossover rate and mutation rate in the presented levels do not differ significantly at the 5% level. In the second step, the problem was simulated using the SA algorithm, and after checking the results, the levels with the lowest signal-to-noise value were selected as optimal parameters (Table 9). Similar to the GA variance analysis, statistical analysis was also performed on SA algorithm. In this algorithm, the iterations per temperature value is considered as the most important determining factor in the performance of the SA algorithm, and at a significance level of 5%, the equality of the levels of this parameter was rejected. In addition, the initial temperature and the cool-down factor at the level of 5% have no significant difference in the presented levels.
In the present study, the researchers used simulation to show the quality of the presented optimization model. For EMS, it is difficult to demonstrate the quality of analytical and heuristic models without using simulation to compare the performance of its solutions. Therefore, in order to estimate the parameters of the 2 algorithms, 90 problems were designed in small, medium, and large sizes and were solved and the average of the answers and the quality of the solutions were compared pairwise by Minitab software (Table 11). The results indicate the accuracy and validity of the proposed model. What is obtained from the comparison of the results of solving the problems by these algorithms is that in all the GA problems, in terms of the value of the objective function, which is of the minimization type in all the problems, it has a better output and produces better quality solutions.
Finally, to make a more scientific comparison of the 2 algorithms designed in this research, the method of testing the assumption of the equality of means was used for paired observations. In addition, considering that in this test, 30 problems were solved for each of the small, medium, and large problems, it can be assumed that the data has an approximately normal distribution. In the problems with small, medium, and large sizes, the equality of the means of the response of the functions was rejected at the significance level of 5%. Since the value of the test statistic is not in the desired range, it can be claimed that the average response of the objective function of GA is better than the SA in problems with small, medium, and large sizes. In addition, in terms of the equality of the average quality of the solutions of the 2 algorithms, the result of the pairwise comparison test was also rejected at the significance level of 5%, because the value of the test statistic was in the critical area (Figure 6). That is, the quality of the solutions of GA is significantly more efficient than the solutions of the SA algorithm.
Finally, in order to confirm the results of the research, the results and findings were compared with other researches. Samouei and Fattahi 32 also came to the conclusion that GA is one of the best algorithms for solving NP-hard problems, because the best solution is obtained and the average of the calculated solutions compared to algorithms such as Tabu Search (TS), SA algorithm and particle swarm optimization achieves the solution in a shorter time. In addition, the findings of the present research are in line with the research of Yadegari et al 33 Also, considering the simulation of the model using SA and GA showed that the proposed model correctly estimates the parameters of the research problem. Therefore, it can be said that the research findings are approved for simulating the proposed model.
Conclusion
It should be noted that in recent years, issues such as the elimination of delays in the provision of medical services and multi-disease models have attracted the attention of researchers, and since these issues are related to the performance of the innovation system, this issue is mainly due to the limitation of resources and communication. The inadequacy of specialists and medical care systems has increased the need to use artificial intelligence technologies. In other words, to improve the performance of health systems, we need to increase the available resources, and develop visions and joint statements to improve health care using artificial intelligence technologies.34-36
The limitations of the current research were as follows: One assumption that was not taken into account was related to population and traffic data, which, depending on the geographical and climatic conditions, may affect the speed of the vehicle and the time-of-service delivery, thus complicating the whole process. In addition, the differences in diseases were also not considered. Therefore, the different conditions and associated complications in different locations or the percentage of vulnerable groups, such as elderly and disabled people, should also be considered. We assumed that all EMS centers had sufficient specialists and ambulances for deployment to the accident sites, which is far from reality.
The following suggestions can be provided for future research based on the importance of locating EMS centers: Some scenarios were not addressed in this paper. For example, the likelihood of vehicles changing routes during the day or being in different locations on different days of the week. Also, it is suggested that the amount of equipment and resources should be determined in line with budget constraints in addition to facility location. If the model is solved for multiple periods, ambulance deployment decisions can be integrated with location and assignment decisions. Moreover, the stochastic and dynamic models as well as robust models should be developed to deal with the variations and uncertainty of the parameters. Furthermore, it is suggested to use geographic information systems for ambulance location and routing in the urban transportation network.
Supplemental Material
sj-docx-1-his-10.1177_11786329231195690 – Supplemental material for A Multi-objective Mathematical Programing Model for the Problem of P-envy Emergency Medical Service Location
Supplemental material, sj-docx-1-his-10.1177_11786329231195690 for A Multi-objective Mathematical Programing Model for the Problem of P-envy Emergency Medical Service Location by Mohammad Khalilzadeh and Arman Bahari in Health Services Insights
Footnotes
Author Contributions
M.K. and A.B. reviewed the literature, developed the mathematical programing model, employed the meta-heuristic algorithms to solve the proposed model, conducted analysis, and wrote the whole paper.
Declaration of Conflicting Interests:
The author(s) declared no potential conflicts of interest with respect to the research, authorship, and/or publication of this article.
Funding:
The author(s) received no financial support for the research, authorship, and/or publication of this article.
Supplemental Material
Supplemental material for this article is available online.
References
Supplementary Material
Please find the following supplemental material available below.
For Open Access articles published under a Creative Commons License, all supplemental material carries the same license as the article it is associated with.
For non-Open Access articles published, all supplemental material carries a non-exclusive license, and permission requests for re-use of supplemental material or any part of supplemental material shall be sent directly to the copyright owner as specified in the copyright notice associated with the article.