
Abstract
The emergence of the new coronavirus in late 2019 further highlighted the human need for solutions to explore various aspects of deadly pandemics. Providing these solutions will enable humans to be more prepared for dealing with possible future pandemics. In addition, it helps governments implement strategies to tackle and control infectious diseases similar to COVID-19 faster than ever before. In this article, we used the social network analysis (SNA) method to identify high-risk areas of the new coronavirus in Iran. First, we developed the mobility network through the transfer of passengers (edges) between the provinces (nodes) of Iran and then evaluated the in-degree and page rank centralities of the network. Next, we developed 2 Poisson regression (PR) models to predict high-risk areas of the disease in different populations (moderator) using the mobility network centralities (independent variables) and the number of patients (dependent variable). The P-value of .001 for both prediction models confirmed a meaningful interaction between our variables. Besides, the PR models revealed that in higher populations, with the increase of network centralities, the number of patients increases at a higher rate than in lower populations, and vice versa. In conclusion, our method helps governments impose more restrictions on high-risk areas to handle the COVID-19 outbreak and provides a viable solution for accelerating operations against future pandemics similar to the coronavirus.
Introduction
In late December 2019, Chinese officials announced a new kind of coronavirus (CoV) family has emerged in Wuhan. 1 The novel coronavirus is a pathogen that causes infectious diseases in humans with acute respiratory syndrome. 2 The COVID-19 disease is caused by a new coronavirus called Severe Acute Respiratory Syndrome Coronavirus 2 (SARS-CoV2) disease. 3 The high power of person-to-person transmission of the disease has led to special measures to prevent the disease spread, including social distancing and quarantine of patients for several days during the treatment process. 3 However, the virus scattered rapidly from China to the rest of the world, and with the registration of the first cases in 216 countries and territories, on 11 March 2020, the World Health Organization declared the novel coronavirus outbreak has turned into a pandemic. 4
Unfortunately, the governments did not take any strict preventive measures in Iran, and the first COVID-19 cases were identified on February 19, 2020. 5 Corona Crisis Headquarters in Iran managed to prevent the spread of the disease by banning ceremonies and celebrations, scientific centers, including universities and schools, encouraging people to quarantine and stay at home, but there was never a strict law to ban travel between cities.
Many methods have been developed to predict outbreaks and inspect their relationship with various factors in the literature. The most important of these prediction methods include machine learning techniques, mathematical modeling, and social network analysis. Machine learning techniques mainly include classification methods such as random forest, neural networks, Bayesian networks, and regression tree (cart). 6 Researchers used neural network and Bayesian network techniques, respectively to predict the prevalence of dengue infection,7,8 and similarly, using neural network and genetic algorithms the Oyster norovirus outbreak has been estimated.9,10 Besides, various approaches have been proposed to deal with the transmission of new coronavirus and predict the future prevalence by researchers in different countries so far. These approaches include the implementation of various machine learning models in traditional data mining based on time series data,11,12 mathematical modeling methods,13,14 deep learning algorithms, 15 Real-time analysis techniques,16,17 and the SNA approach.18,19
In this study, we investigated the relationship between COVID-19 cases and passengers transported in Iran provinces. We used the SNA technique to assess different factors in the passengers’ network and evaluate their influence on the COVID-19 outbreak. We first calculated the correlation of the various factors involved in the research issue and implemented 2 prediction models using the PR 20 method based on in-degree and page rank centrality metrics in the mobility network then evaluated the relationship between the variables in each model. Finally, we have shown that our prediction models provide an accurate estimate of the future prevalence of COVID-19 disease. It is important to state that the method presented in this study can be generalized to epidemics that have similar characteristics to the new coronavirus transmission.
To sum up, we have set a target to answer the following questions: Is it possible to identify the high-risk areas of COVID-19 outbreak through the mobility network centralities? What is the relationship between the network centralities and the number of COVID_19 cases? How does this relationship change in different populations?
Related works
Researchers in several studies used network analysis metrics to track and control the prevalence of COVID-19 in India.3,18 In these studies, the network is defined based on the contacts of patients. The researchers analyzed network parameters and identified cases that play an important role in the disease outbreak using out-degree and betweenness centralities.
Another research used the trace of positive COVID-19 cases to develop a social network and examine its characteristics. 21 In this study, the researchers calculated the network parameters and pointed out that the nodes with high out-degree have a significant role in network size. Besides, the study revealed the prevalence of the disease is influenced by government policies.
Ashani, et al. 22 developed a network for outbreaks in different countries over a few months during 2020. In this study, the authors used the degree centrality measure to identify countries with a high important degree in transmitting the disease to Canada and then identified potential communities in the network using various community detection algorithms.
Ahmed et al 23 used tweets with “mask” content posted between Twitter users to implement the social network for identifying groups of people who have an effective role in encouraging people to wear masks using the centrality metrics.
Haupt et al 24 used unsupervised machine learning and the SNA techniques to study dialogs on Twitter related to protest actions against the COVID-19 pandemic guidelines. In this study, the authors used an unsupervised manner using natural language processing (NLP) to discover subjects and used the SNA approach to examine the re-tweet network. Cluster analysis in this study exhibited that the number of tweets regarding the protest activity was more than the opposition, and the protest activity is the prevalent sensation. In addition, followers of the protest action are more likely to re-tweet users than non-supporters.
In another study, researchers used the SNA technique to analyze relationships between subgroups of students and assess relationships between them during the coronavirus pandemic. This study aims to evaluate the relationships between subgroups to identify cohesive subgroups. The risk of infection with COVID-19 is related to the degree of clustering between cluster members. Accordingly, the SNA technique determines that a network consisting of 4 subgroups produces the best division with a high degree of cohesion within subgroups and a low cohesion between them. This study also showed that the connection between subgroups and their sex is meaningful. 25
The authors also used the SNA technique to analyze content and evaluate organizational emergency responses during the coronavirus pandemic. The findings showed that the head of the research group plays a minor role in responding to the COVID-19 outbreak, and emergency responses are likely to involve less solid, formal, and non-traditional interactions. In addition, the research results showed that most of the research group’s attention is paid to issues such as lack of testing equipment, instructions, fake information, and social distancing. The author claimed that the results can help governments develop more effective organizational emergency guidelines for dealing with future pandemics. 26
Kim et al 27 revamped a coronavirus outbreak to investigate how a large cluster in a community spread before being diagnosed and assess the possible efficacy of complying with mask-wearing policies suggested by the government. In this study, researchers simulated the prevalence of COVID-19 disease using the SNA technique and simulated the outbreak of the disease in the community using a discrete-time stochastic simulation model. Besides, the authors used a calibrated baseline model to evaluate the effectiveness of acceding with a mask-wearing guideline in preventing disease infection. The results showed that if the community under study tracked mask-wearing policies, the prevalence of the disease may have been one-twentieth of its magnitude.
Finally, several other studies developed a network for COVID-19-related tweets. For example, researchers designed a network using tweets posted between users to analyze their sentiments 28 or to determine the importance of individuals in sharing COVID-19-related information between Twitter users during the COVID-19 outbreak.29,30
Methods and Materials
The research did not involve any direct participation by human subjects and is based on publicly available secondary data and does not require ethical approval or informed consent. Our methods were performed in accordance with the relevant policies and regulations.
Study area
Our study was conducted in Iran. The Islamic Republic of Iran is a country in Asia and has the second-largest country in the Middle East with an area of more than 1.6 million square kilometers. Iran has 31 provinces, each divided into several cities, and Tehran province is its capital. According to the latest statistics, Iran’s population in 2020 will reach more than 84 million people. 31
Data source
The purpose of this study is to investigate the impact of intercity land travel by private and public transport and its impact on the prevalence of COVID-19 disease. Therefore, in this study, 3 data sets, travelers transferred between provinces, the total number of patients in each province, and the population of provinces have been collected. The first set includes all trips from the origin to a specific destination until February 30, 2021, which has been collected from the official sources of the Ministry of Roads and Urban Development of the Government of Iran. Similarly, the second set is official statistics of the total number of COVID-19 cases in the Iran provinces announced by the Ministry of Health of the Government of Iran until February 30, 2021. 32 The last set includes the population of the provinces based on the latest general census conducted in the country. Unfortunately, the number of patients in some of Iran’s metropolises has never been announced by the Iran government due to security issues such as violations of restrictions, non-compliance with health principles, and social distancing by citizens. For this reason, some provinces were excluded from the study, and the number of patients in a few provinces was estimated based on the number of death cases.
Methodology
Figure 1 delivers an overview of the methodology used in this research. Initially, the number of incoming and outgoing passengers, the number of COVID-19 cases, and population variables for each province were gathered and integrated from different official sources. In the next step, we used various diagrams to visualize the collected data. Data visualization helps discover hidden patterns among data that are not statistically visible. In the next 2 steps, we utilized the programing libraries to develop the mobility network between all provinces then degree and page rank centrality metrics for each province were calculated. In the mathematical modeling stage, we employed the PR method to model the relationship between variables and predict the number of disease cases in each province based on network centralities. Finally, the evaluation stage involves evaluating the prediction models developed in the previous step, calculating the P-value to determine the significance of the relationships, and interpreting the results.

The block diagram of the methodology used in this research.
Based on the nature of the problem, the network defined in this research is a weighted directed graph and is inevitably a static network of passengers. The network’s nodes represent the provinces that are connected by directed edges from the origination province to the destination province and the weight of each edge indicates the number of passengers transferred between its origin and destination nodes.
We extracted the required data for each province through official sources approved by the Iranian government. The collected data has been stored in 2 separate files in xlsx format. Also, we used Python programing language version 3.5 to implement data preprocessing steps and mathematical modeling and R language version 3.5 for network analysis.
There are powerful tools for SNA. These tools are mostly programing packages such as NetworkX and igraph in Python and R environments, respectively, or network analysis software such as Gephi. 33 The R environment is merely a statistical environment for data analysis. 33 On the other hand, Python is a programing language that has more capabilities in addition to data analysis. SNA packages in R and Python have numerous advantages over other network analysis tools. Both can support several files format in graph modeling language (GML), GraphML, and UCINET’s DL formats and process a wide range of graph structures such as 2-mode and multi-relational graphs. Besides, they can draw networks with different visualization layouts such as Fruchterman Reingold and Kamada Kawai layouts that a tool like Pajek does not support. 33
In this research, correlation analysis has been used to evaluate the relationship between variables and the appropriate choice of the regression model. In mathematics, correlation analysis examines the relationships between variables in pairs and separately from the simultaneous effects of other variables. 34 While regression analysis predicts the future trend of a dependent variable with the simultaneous impact of one or several independent variables. 34 Correlation expresses the type and intensity of the relationship between 2 variables relative to each other but it does not necessarily mean the cause-and-effect relationship.
The degree of correlation between the 2 variables determines the rate of regression occurrence. In linear regression models, it is assumed that the dependent variable is a continuous variable that follows a normal distribution. 20 However, our dependent variable may be a count variable that follows a discrete, not continuous, and non-negative distribution. A simple example of a count dependent variable is the number of occurrences of an event during a time interval. 20 There are several methods to model count data in the literature including Poisson regression, negative binomial regression, and zero-inflated regression models. 20
Figure 2 presents how the variables in this study are distributed. Based on Figure 2, the dependent variable (COVID-19 cases) in this study is a count variable that follows a Poisson distribution, as the data is right-skewed. Therefore, the PR model was used in this study to predict the dependent variable of the patients who come down with the COVID-19 disease through independent variables of centrality metrics in the passenger’s network. This leads to the identification of high-risk and effective points in the disease outbreak. In addition, we consider the population variable, which plays an important role in the prevalence of the disease, as another independent variable in both PR models. The correlation and regression analysis results are described in detail in the results section.

Histogram and density curve of variables defined in this research.
Important Definitions
Structural research refers to a study that investigates the relationship among entities. In this type of study, entities and relationships are not limited to human social relationships. However, the SNA method in the social sciences refers to a structural study that shows the interactions among social entities. 35 The SNA approach has been used in various contexts such as analyzing relationships among group members, the class structure of society, social mobility, scientific citations, and kinship structure to discover hidden truths among the links of different social actors. 36
In this section, the formal and mathematical definition of the most important terms used in this research for readers is given. In later sections of the research, we frequently use these terms to analyze data and produce results.
Network type
As previously mentioned, the network obtained from the data points in this study is a weighted directed graph.
Vertex and edge scoring
In a given network, the importance of an actor can be computed using network analysis scoring criteria. One of the most important metrics for scoring vertices is centrality measures.
In directed graphs we can claim 37 :
Incoming degree of a node v:

Outgoing degree:

Degree

Degree centrality:

In-degree centrality:


Where damping factor (d) is a value between 0 and 1 and is usually set to 0.85, |Pj| stands for the total number of outlines from page Pj, and CPi represents the set of pages that refers to page Pi. It is important to note that the parameter d stands for a probability, and in this study, it indicates the probability that passengers will continue on their route.
Results
Demography
We analyzed 22 provinces of Iran’s metropolises. According to the latest announcement by the Statistics Center of Iran, the lowest and highest population belongs to Ilam province with606 000 people, and Fars province with more than 5 million members, respectively. Besides, all provinces consist of several urban and rural areas. Travel includes land travel to all regions inside and outside of the province. Likewise, the maximum number of passengers transferred between cities belongs to Fars province with more than 9 million passengers. On the other hand, the number of patients who come down with COVID-19 disease in the country is between 23 928 and 177 717 cases, which belong to Kohgiloyeh and Fars provinces, respectively. The Bar diagram in Figure 3 shows the ratio of incoming passengers, population, and COVID-19 case variables in each province of Iran separately.

Bar plot of the COVID-19 cases (*100), population (*1000), and the incoming passengers (*1000) corresponding to each province of Iran.
Network modeling
Visualization is a way to see details that may be hidden and the user may not be able to identify them statistically. Results visualization in this study gives us a broader view of events that happened in Iran during the pandemic months. In our mobility network, the nodes represent provinces, and the passengers transferred between the 2 nodes are shown with a directed edge from the origin node to the destination node. In addition, the thickness (corresponding to weight) of each edge indicates the total number of passengers transferred between its nodes, and the node size designates the degree of centrality of that node in the network. Figure 4 shows the in-degree centrality (equation (5)) of nodes in the weighted directed network of passengers on the map of Iran. We depicted the map according to its provinces. Each distinct area represents a province on the map. The size of each node in the network indicates the value of its in-degree centrality. Also, Figure 5 is the same network as Figure 4 with edges limited to weights of more than 30 000 passengers. Similarly, we used the page rank index (equation (6)) to determine the importance of network nodes. The passenger network described by page rank centrality is shown in Figure 6. In this Figure, if a node has a larger size, it means the province has a higher page rank, and as a result, it has received more passengers from more high-risk provinces, which have been more affected by the disease outbreak. Accordingly, the thickness of the edges indicates their weight, and the number of edges is limited to the weight of 30 000 passengers.

Weighted digraph of passengers transferred in Iran (node size describes the in-degree centrality and edge thickness indicates the corresponding weight).

Weighted digraph of passengers transferred in Iran with edge limited to weights more than30 000 passengers.

Weighted digraph of passengers transferred in Iran (node size describes the page rank centrality, and edge thickness indicates the corresponding weight).
With a glance at Figures 5 and 6, the importance of Iran provinces based on the 2 in-degree and page rank centralities in the prevalence of the disease is discernible, respectively. In Figure 5, the in-degree centrality represents Fars province as the most influential province in transmitting the virus to the other areas in the whole population, while Semnan province has the least impact on the spread of the disease compared to other cities. On the other hand, the page rank index in Figure 6 identifies Fars and Kuhgiloyeh provinces as the most and the least important zones in the whole population, respectively.
Poisson regression, intercept, regression coefficient, correlation coefficient
The degree of correlation between different variables reveals the logic of using the linear multiple regression (LMR) model to implement the final prediction models. Accordingly, we calculated the correlation coefficient for the research variables before implementing our models. The actual value of the correlation in these relations is inserted in Table 1. Based on the data provided in Table 1, the highest and lowest correlation coefficients belong to in-degree with page rank centralities and page rank centrality with population variable, respectively. Besides, the degree of correlation between the different variables in Table 1 confirms sufficient evidence to use the LMR model.
Correlation coefficients between the variables defined in this research.

On the other hand, in the study design section, we showed that our dependent variable follows the Poisson distribution, and we used the PR model to define the relationship between the variables. In the PR model, the logarithm function is used as a link function to turn a non-linear relationship into a linear form. 20 So, if the dependent variable Y and the independent variable Xi are involved in a relation, then the PR model is defined as equation (7).

In this relation, the coefficient β0 stands for intercept, and the coefficients βi express the regression coefficients. The βi coefficients are calculated by the maximum likelihood estimation method, and by placing the values of the independent variables (Xi), the corresponding value is predicted in the dependent variable (Y). 20 Besides, the regression coefficients represent the dependent variable fluctuation due to the change in the independent variables. When independent variables (Xi) are equal to zero, the dependent variable (Y) is equal to the intercept. Figure 7 shows the values of regression coefficients for the independent variables in the PR models.

Values of regression coefficients for the independent variables in the PR models.
Figure 8 exhibits the relationship between the number of COVID-19 patients with in-degree (Figure 8a) and page rank (Figure 8b) centrality metrics in the mobility network. In this figure, the population variable is the moderator variable and the blue, purple, and black lines present the average population, the population above the average, and the population below the average, respectively. As shown in Figure 8 the slope of the regression line is positive for the dependent variable of patients and network centralities in different populations, and the number of patients increases with increasing centrality measures. The only difference is that the slope of the line in lower populations is less than in higher ones. It determines the high impact of the population on the relationship between the network metrics and disease cases.

Interaction between COVID-19 cases variable, degree centrality (a), page rank centrality (b), and population as a moderator variable.
In this research, we used the P-value measure to evaluate the prediction models. The P-value for both relationships was .001, which is less than the threshold value of .05. So, the P-value in both models rejects the null hypothesis and confirms the meaningful relationships between the variables.
Fars province is one of the most important tourism centers in Iran. This province is one of the most historical regions and has a very long history in Iran. Thus, it receives many tourists from inside and outside Iran every day because of its eye-catching tourist attractions. 44 This reason can justify why this province is a high-risk area for the spread of coronavirus (Table 2). On the other hand, Alborz province is an emerging province that has recently been added to the provinces of Iran and according to statistics, it has fewer incoming passengers than other districts of Iran (Table 2). By focusing more on the results, it can be seen that provinces such as Kerman and Sistan that receive travelers from Fars province, due to the great importance they receive from it, are more effective in spreading the virus.
In-degree and PageRank centralities values corresponding to each province in Iran in the weighted mobility digraph.

Network parameters
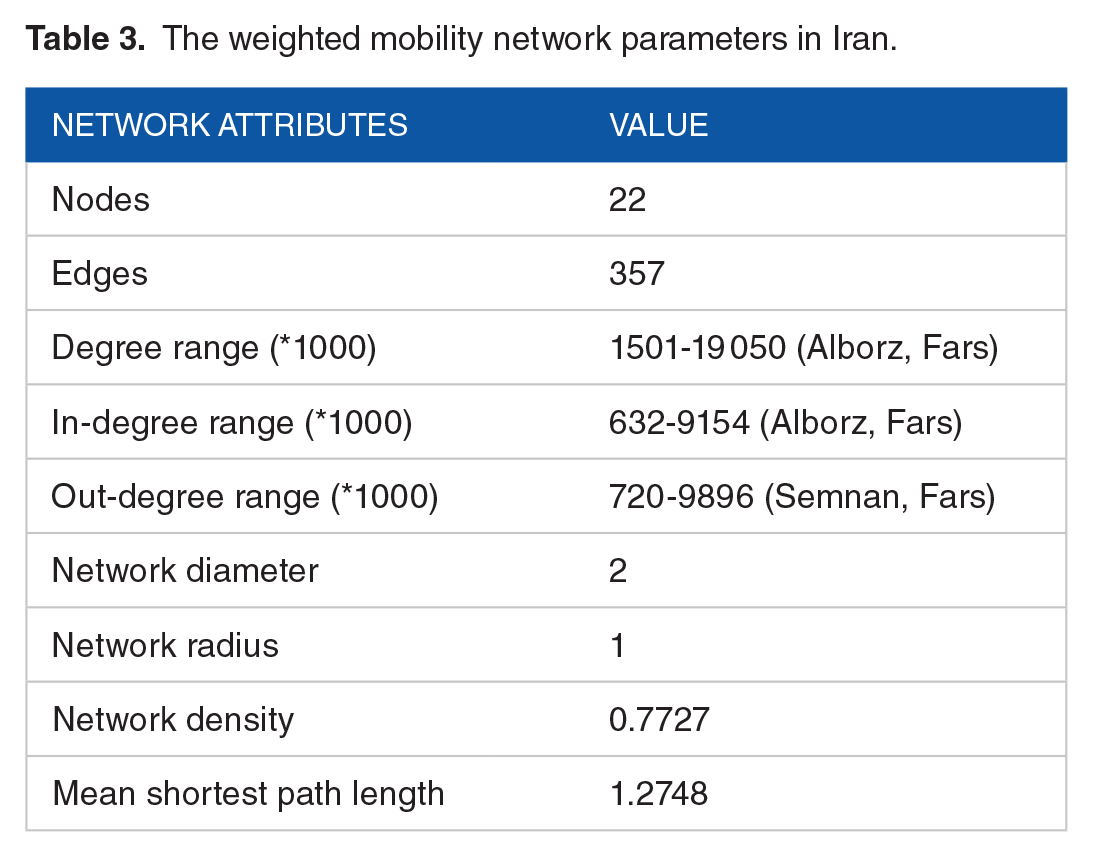
Based on the collected data, we have no nodes with zero input or output in the network. Therefore, there is no isolated node in the network, and each node is linked to at least one other node, and the network is a connected graph. Each node has a self-loop edge that indicates the number of passengers transferred within the province. Accordingly, the number of self-loop edges in the network is 22 edges for all nodes. Table 2 provides the actual value of in-degree and page rank centralities for the intended provinces in this study. Other network attributes such as the total number of edges, the range of input and output edges, the network diameter, and the network radius are detailed in Table 3. Density is one of the most widely used concepts in social network theory and means the density of edges in graph nodes. The graph density is defined as the number of edges in the graph relative to the complete graph. The network density in this study (Table 3) indicates that the network is close to complete and almost all provinces have given/received passengers to/from each other.
The weighted mobility network parameters in Iran.
Discussion
In this research, we set a target to scrutinize the relationship between travelers and novel coronavirus cases in the provinces of Iran based on the conventional SNA technique. The purpose was to discover knowledge based on the mobility network to detect the potential high-risk areas of the pandemic. The extracted knowledge included information on how the pandemic spread and what regions were more exposed to disease transmission and mortality.
In the first step, we studied the relationship between the COVID-19 cases and the travels from the in-degree and page rank centralities point of view in the mobility network and population variable. We used correlation analysis to examine the changes in different variables relative to each other to find the appropriate analysis model. Our calculations showed a relatively strong positive correlation between the intended variables in this study (Table 1). The in-degree and page rank centralities were defined in a weighted (number of transferred passengers) directed (from the origin node to destination node) graph. The in-degree centrality determines the importance of each province based on the number of its incoming passengers, and the page rank centrality calculates the degree of importance of the node based on the number of its incoming passengers and the importance of its source nodes. 45 It can justify the positive correlation between the centrality metrics and the number of passengers in each province.
In the second step, we defined the relationship between the variables using the PR method. We implemented 2 different models to predict the COVID-19 cases (dependent variable) in each province based on the in-degree and page rank centrality metrics (independent variables) and interaction of population (independent variable). The p-value (P < .001) confirmed the existence of a significant interaction between the variables in both models (Figure 8).
Our network was fully connected, so the betweenness centrality of all nodes was zero. 4 On the other hand, we considered the page rank centrality because it provided a more reliable estimate of the importance of a node in this context. As mentioned in the Important Definition section of the article, the importance of the source nodes is taken into account by page rank centrality in evaluating the importance of the destination nodes. 3 For this purpose, a node (province) that receives passengers from nodes with higher page rank centrality has a higher page rank than other nodes. Therefore, the page rank centrality provides a more reliable estimate of prevalence areas than other centralities. In addition, since our network is a weighted network, degree centrality is more important than other centralities such as closeness centrality because it considers the total number of incoming passengers and the number of incoming routes to all provinces in the network. 4 According to the definition of closeness centrality, it calculates the number of steps between 2 nodes to determine the importance of a node, 4 and this factor does not affect the transmission of disease from one region to another.
According to a recent study in Hunan 46 cities, China, researchers tracked communications and found that 8.9% and 14% of the COVID-19 cases in these 2 cities, respectively, infected 80% of all cases. Nevertheless, the page rank index has great importance in this analysis because it considers the number of incoming passengers in the origination province for all destination provinces. Therefore, if a province receives passengers from another province that has more transfers, it gets a higher page rank in the calculations and is more at risk of COVID-19.
During the pandemic, the Iranian government has described the province’s situation based on the prevalence of COVID-19 and the number of daily cases, in 3 different colors: white, yellow, and red. White color means less risk and the number of daily patients, and yellow indicates moderate risk. Finally, the high-risk provinces because of their high daily cases mark in red color. By this definition, while the Iranian government has banned entry and exit to the red districts at certain intervals, severe and long-term travel restrictions have never applied due to economic problems. Therefore, these restrictions in the red provinces can explain the decrease in centrality and consequently the number of patients in some provinces of this study. Besides, the Iranian government has never announced the number of COVID-19 patients in some metropolitan areas, such as Tehran, Mashhad, and Isfahan. So, we have not considered these provinces in our analysis. By considering these provinces, our results may change because the prevalence of the disease in them is higher than in the areas studied in this analysis. Tehran metropolis is the capital of Iran and occupies one-sixth of the total country’s population. 45 The city receives many travelers from other provinces every day and connects all the provinces in the country through its passenger terminals.
We used periodic data to develop a static network based on number of passengers transferred between pairs of provinces during 2020. Although the analysis of the dynamic mobility network provides a realistic estimate of prevalence patterns, the static network based on tourism data can also accurately identify the high-risk areas of prevalence in a specific period. 2 In addition, the main goal of this research is to investigate the relationship between the number of disease cases and the mobility network’s centralities with the moderation of the population variable, which is also possible by developing a network based on number of travelers transferred between pairs of districts. As mentioned in the related works section, the studies in the literature were focused more on tracking the positive cases of COVID-19 and their communication in different communities. In these studies, the nodes indicated COVID-19 cases (or countries) and the edges represented their communications. Besides, most of the previous works deal with networks on social media. The aim of these studies was to identify disease cases that have a great impact on disease transmission. On the other hand, the network designed in this research is based on the mobility of all passengers during 2020. In this research, we considered the population variable as a moderator in evaluating the relationship between the number of incoming travelers and the number of disease cases. Our results confirmed previous facts about the novel coronavirus outbreak and showed that there is a meaningful relationship between the number of disease cases and the number of incoming travelers in different populations. In addition, we considered the page rank centrality (unlike in previous studies) to evaluate the importance degree of network nodes, which by definition plays an important role in determining the importance of a node in a mobility network (equation (6)). Our results showed that areas with higher page rank centrality play a crucial role in the spread of disease to other areas.
By producing vaccines against coronavirus infection, governments have been able to control the spread of the virus. However, before vaccination, the spread of the virus left many human casualties due to the unknown nature of the virus and the lack of effective prediction methods. For this reason, the proposed method of this research can be generalized to identify high-risk areas in possible future pandemics similar to the coronavirus pandemic in order to predict the pattern of the epidemic at an early stage, make the right quarantine decisions, and reduce mortality.
To summarize, the main contributions of this research are highlighted as follows:
This research indicates that the pairwise correlation between the number of cases of COVID-19, the mobility network centralities (page rank and degree), and the population variables is positive.
This research shows that there is a significant relationship between the number of disease cases and the mobility network centralities.
This research confirms the role of the population variable as a moderator in the relationship.
This research shows that in high (low) population areas, the number of disease cases increases (decreases) with the increase (decrease) of network centralities.
Our study faced some limitations. For example, Iran has few provinces and our analysis is based on a small number of provinces in Iran because of government policies in pandemic management. If our research extends to a vast area of the world, our findings will be more reliable. Besides, we used only 2 factors to analyze and identify high-risk areas in the country. While other factors can influence the prevalence of the disease and participate in the calculations. Therefore, this analysis can create more reliability by considering more factors such as air pollution, trip timing, or weather conditions. Also, we only considered trips made by land vehicles, and air travel did not include in our calculations due to the limitations we had in collecting research data. Similarly, we only target the number of COVID-19 cases as a variable, while other parameters such as the number of deaths can also be a variable for analysis.
Finally, the centrality metrics we used in network analysis are more applicable to fully connected networks. Nevertheless, the method used in this research may not be sufficiently efficient in networks with more single nodes.
Conclusion
The results of our analysis confirm that the prevalence of the new coronavirus is significantly related to in-degree and page rank centrality metrics in the mobility network. Besides, we revealed the population variable moderates these relationships. Moreover, we showed through in-degree centrality that Iran provinces that have more tourist attractions have more COVID-19 cases, likely due to attracting more passengers. Our results also showed that areas of Iran with more incoming travelers are very effective in spreading the virus to the provinces that directly receive passengers due to their high page rank centrality. On the other side, the provinces that receive more passengers from the areas with high page rank centrality are more exposed to the virus than others. We recommend that the government more effectively handle the prevalence of the epidemic by identifying high-risk provinces and imposing more restrictions on these areas. Nevertheless, by identifying areas that are most at risk, health officials can encourage people in those areas to adhere more to health principles. This analysis helps governments enforce restrictions in high-risk areas instead of quarantining the country as a whole. Therefore, we recommend this method to countries that are economically inflated and are not able to impose restrictions on all businesses because it significantly reduces costs and resource consumption. Other applications of this analysis can be timely tracking and quarantining of people who travel to high-risk areas and are more likely to be infected with the virus than other citizens to prevent transmission of the infection to other parts of society. Finally, the method presented in this study can identify high-risk areas of possible future pandemics similar to the characteristics of the novel coronavirus.
To do more research, our research can be integrated with more variables such as weather conditions, geographical conditions, air travel, trip timing, etc. Also, it can be implemented based on the dynamic mobility network. Furthermore, this research can extend to a wider area of the world over intercontinental and interstate travel with more data points.
Footnotes
Acknowledgements
We would like to thank the Government of Iran that has made COVID-19 statistical data open to access through multiple online sources.
Funding:
The author(s) received no financial support for the research, authorship, and/or publication of this article.
Declaration Of Conflicting Interests:
The author(s) declared no potential conflicts of interest with respect to the research, authorship, and/or publication of this article.
Author’s Contribution
SI collected data, implemented research, designed networks, analyzed results, and wrote the manuscript. BT was the research supervisor, supervised the research process, and conceptualized network analysis.
Research Ethics and Patient Consent
The research did not involve any direct participation by human subjects and was based on publicly available secondary data and did not require ethical approval or consent.
Data Availability
The data of COVID-19 cases were collected with the participation of all authors from different health centers under the Ministry of Health in Iran’s provinces. The General statistics can be accessed at the address https://behdasht.gov.ir/. Also, the data of passengers transferred in the provinces was received from the report provided in the Persian language by the Ministry of Roads and Urban Development of Iran. The population of each province was obtained from the Statistics Center database at the address ![]() based on the latest census.
based on the latest census.