
Abstract
The level of patient satisfaction is a direct or indirect measure of services delivered in healthcare institutions. Different primary studies in Ethiopia showed the proportion of satisfied patients toward health services. Patient satisfaction reflects a wide gap between the current experience and the expected services and pushes clients to go to farther located health care facilities and even to more expensive private health care facilities to find quality healthcare services. Inconsistent findings regarding the proportion of patients that are satisfied with the healthcare services in Ethiopia make generalizations difficult at the national level. We have accessed previous studies through an electronic web-based search strategy using PubMed, Cochrane Library, Google Scholar, Embase, and CINAHL and a combination of search terms. The quality of each included article was assessed using a modified version of the Newcastle-Ottawa Scale for cross-sectional studies. All statistical analyses were done using STATA version 14 software for windows, and meta-analysis was carried out using a random-effects method. The Preferred Reporting Items for Systematic Reviews and Meta-Analyses (PRISMA) guideline was followed for reporting results. Out of 188 records screened, 41 studies with 17 176 participants fulfilled the inclusion criteria and were included for proportion estimation. The pooled proportion of satisfied patients was 63.7%. Attending a health center (AOR = 2.68; 95% CI = 1.79, 2.85), being literate (AOR = 0.46; 95% CI = 0.28-0.64), being younger than 34 years old (AOR = 2.07; 95% CI = 1.28, 2.85), and being divorced (AOR = 0.58; 95% CI = 0.38, 0.88) were factors identified as being associated with patient satisfaction. The proportion of patient satisfaction in Ethiopia was high based on over 50% satisfaction scale. The Ministry of Health should give more emphasis to improve hospital health care services to further improve patient satisfaction.
Background
Patient satisfaction is the level of satisfaction that clients experience after using the service, It reflects the difference between the expected service and the experience of the service from the patient`s point of view. 1 Measuring patient satisfaction becomes an integral part of healthcare services strategies across the world; quality assurance and accreditation process in most countries considers the satisfaction of patients as a basic criterion in evaluating patient satisfaction. 1 Patients need to be allowed to explain the services they received since it is a good step in improving the standard of the health services given. 2 It is already known that satisfaction has a great impact on whether a person seek further medical advice, adheres to the treatment they received, and keep constant and positive relationship with a healthcare provider.3-5
Different studies were conducted to assess patient satisfaction. A study conducted in India shows that 73% of the study participants were satisfied with nursing service, 6 51.7% in Serbia, 7 57.8% in the Philippines, 8 54.8% in Turkey, 9 and 82.7% in Malaysia. 10 Detailed researches were conducted in 7 developing countries; the experts who directly and critically supervise the clinical practice found that 75% of the cases were not adequately assessed, investigated, managed, and monitored. 11 Studies conducted in outpatient departments of different hospitals that are found in Ethiopia shows different client satisfaction results ranging from 22.0% in Gondar to 80.1% in Hawassa.12-15 The studies conducted in the above hospitals show variation among the service types given and low patients’ satisfaction, which reflects the wide gap between patients experience and the expected services. Most individuals believe that a lack of adequate resources and infrastructures were the reasons for having low-quality care and dissatisfaction in the developing world. In contrast, despite having high expenditure, infrastructure, and adequate facilities, many patients were not satisfied with the health care they received as it was evident from one study. 16 Some studies also showed that patients who used health care services were not happy with most of the services provided such as lack of health service coverage, inadequate staff availability, scarcity of equipment, and poor waste management and infection prevention strategies.3,17,18
In Ethiopia, patient satisfaction reflects the wide gap between the current experience and the expected services that push clients to go to more far health care facilities and even to more expensive private health facilities to find quality healthcare services. 19 Inconsistent findings of the proportion of patient satisfaction toward healthcare services in Ethiopia make generalization difficult at the national level. Therefore, this systemic review and meta-analysis will answer what is the estimated pooled magnitude of patient satisfaction and predictors that affect patient satisfaction. The output of this review and meta-analysis will help the Ethiopian Federal Ministry of Health, regional health offices, and other stakeholders to fill the gap in this regard. Further more, it provides evidence to clinicians who have direct contact with patient care.
Methods
Study design and search strategy
The procedure for this systematic review and meta-analysis was designed in accordance with the Preferred Reporting Items for Systematic Reviews and Meta-Analyses (PRISMA) guidelines. We searched PubMed, Google Scholar, and web of science database for studies reporting the level of patient satisfaction with health care services from January 2000 up to January 20, 2018. End Note (version X8) reference management software for Windows was used to download, organize, review, and cite the articles. We also manually searched cross-references to identify additional relevant articles Preferred Reporting Items for Systematic Reviews, and Meta-Analyses (PRISMA) guideline was followed to report the finding of this systematic review. 20 A detailed search was performed using the following search terms: “Patient satisfaction,” “satisfaction,” “predictors of patient satisfaction,” “health care services,” and “Ethiopia.” Boolean operators like “AND” and “OR” were used to combine search terms.
Inclusion and exclusion criteria
The following criteria were used to determine the eligibility of studies. The following studies were included: (1) quantitative studies, (2) those studies that reported the proportion and/or at least one associated factors of patient satisfaction and those studies which were published in English were included, (3), there was no any restriction in publication status, study period and study settings (studies conducted at health center/hospital or institutional level in Ethiopia), (4) Journal articles, master’s thesis and dissertations, and (5) Only studies which were written in the English language. Retrieved articles were assessed for inclusion using their title, abstract, and then a full-text was taken before inclusion in the final review. Articles without full-text and with poor methodological quality were excluded. Two authors (H.M. and Y.A.) independently evaluated the eligibility of all retrieved studies, and any disagreement and inconsistencies during the selection of articles and data extraction were resolved by discussion and consensus.
Data extraction and quality assessment
Two independent reviewers extracted data using a structured data extraction format prepared in a Microsoft Excel spreadsheet. Whenever variations of extracted data were observed, the phase was repeated. If discrepancies between data extractors continued, the third reviewer was involved. The name of the first author and year, the study region, the study design, the target population, the sample size, proportion of patient satisfaction, and AOR of associated factors were collected. Retrieved studies were exported to reference manager software, Endnote version X6 to remove duplication of studies. Two independent reviewers screened the title and abstract. The disagreement was handled based on established article selection criteria.
Two independent authors appraised the quality of studies. The quality of the studies were appraised using the criteria that was adapted from the Joanna Briggs Institute Meta-Analysis of Statistics Assessment and Review Instrument (JBI-MAStARI). 21 The disagreement was resolved by the interference of the third reviewer. This tool contains a separate appraisal checklist for each type of study design. But, the checklist for cross-sectional study was used in this review since all studies were cross-sectional studies. Description of study subject and setting, valid and reliable measurement of exposure, objective and standard criteria used in the identification of confounder, strategies to handle confounder, outcome measurement, and appropriate statistical analysis are the criteria considered while assessing the quality of the articles. Studies were considered low risk when the score is 50% and above of the quality assessment indicators.
Statistical analysis
The extracted data were imported to STATA version 14 for meta-analysis. A meta-analysis of the proportion of patient satisfaction with health care service was carried out using a random-effects method since it is the most common method in a meta-analysis to adjust for the observed variability. The influence of selected determinant factors was also independently analyzed. The pooled effect size (ie, proportion and odds ratio (OR)) with a 95% confidence interval (CI) was generated and presented using a forest plot.
Publication bias and heterogeneity were assessed. To check the publication bias, a funnel plot Egger’s regression tests were used. Publication bias was checked by funnel plot and more objectively through Egger’s regression test. 22 The heterogeneity of the studies was checked using the Q test and I2 test statistics. I2 test statistics results of 25%, 50%, and 75% were declared as low, moderate, and high heterogeneity respectively.23,24 Pooled analysis was conducted using a weighted inverse variance random-effects model. 25 Subgroup analysis was done by the study region, service area, and year of publication.
Reporting
The results of this review were reported based on the Preferred Reporting Items for Systematic Review and Meta-Analysis statement (PRISMA) guideline 26 and (Supplemental File-PRISMA checklist).
Results
Study selection and proportion of patient satisfaction
The search strategy retrieved 188 articles. After the removal of duplicated articles, 162 articles remained. About 57 Full text articles accessed for eligibility, 12 articles excluded because of reporting without of the outcome of interest, and 4 due to lack of abstract and full text. Finally, 41 studies were screened for full-text review, prevalence, and/or associated factors analysis with a total sample of 17 176 patients (Figure 1). The overall Proportion of patient satisfaction was 63.7% (95% CI = 59.48, 67.91; I2 = 99.5%) (Figure 2). Eight studies were found in Oromia Region, 12 in Amhara, 12 in Southern Nations Nationalities and Peoples region (SNNPR), 3 in Tigray, 5 in Addis Ababa, and 2 in Harare. All of these studies were done by a cross-sectional study design. Regarding the year of publication, 3 studies were published between 2000 and 2010, and 38 studies were published between the years 2010 and 2018 (Table 1).
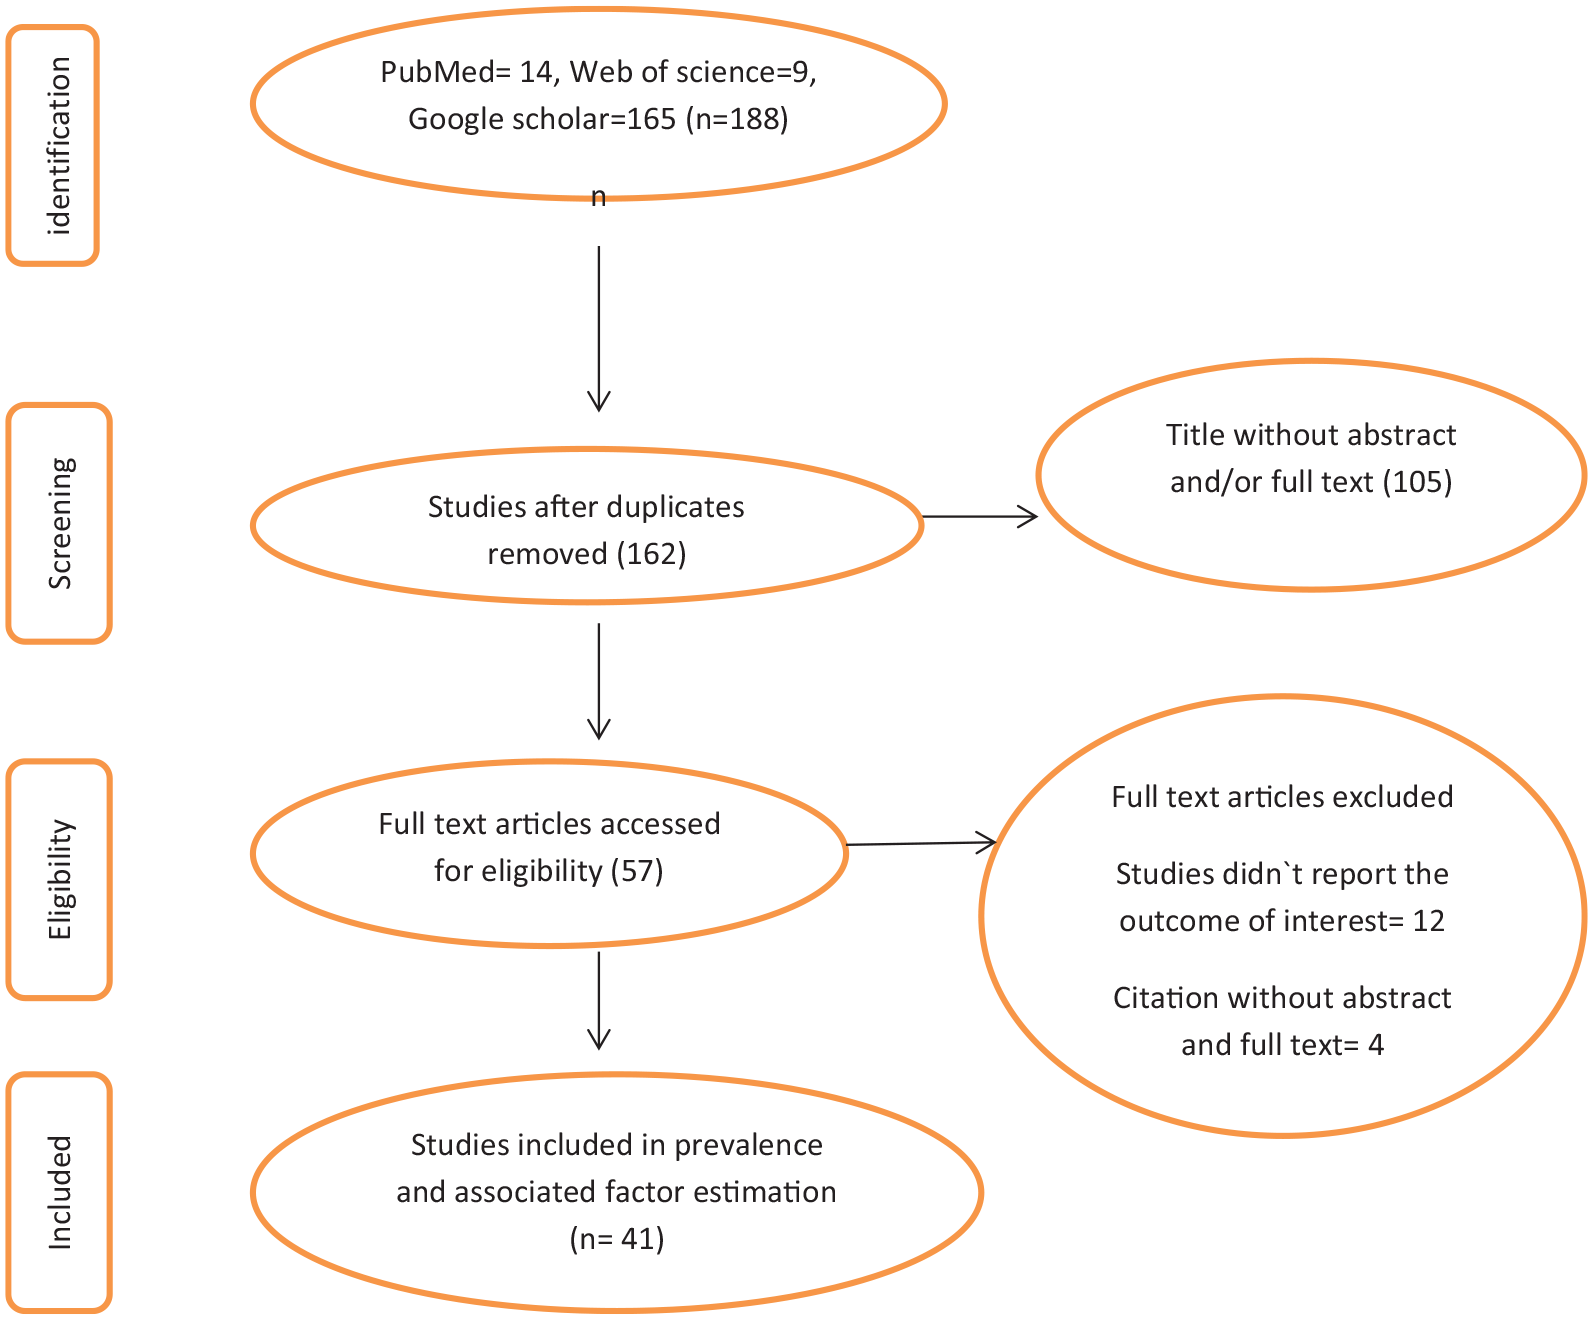
The study selection process.

Forest plot of the proportion of patient satisfaction with corresponding 95% CIs.
Characteristics and quality status of the study.

Quality of studies
The JBI quality appraisal criteria which is established for cross-sectional studies were used. The studies included in this systematic review and meta-analysis had no considerable risk. Therefore, all the studies were considered (Table 1).
Meta-analysis
Publication bias
A funnel plot test showed a symmetrical distribution (Figure 3). Egger’s regression test shows P-value of .103, which indicated the absence of publication bias.

Funnel plot for publication bias, Log prop or LNP (log of proportion) represented in the x-axis and standard error of log proportion in the y-axis.
Subgroup analysis
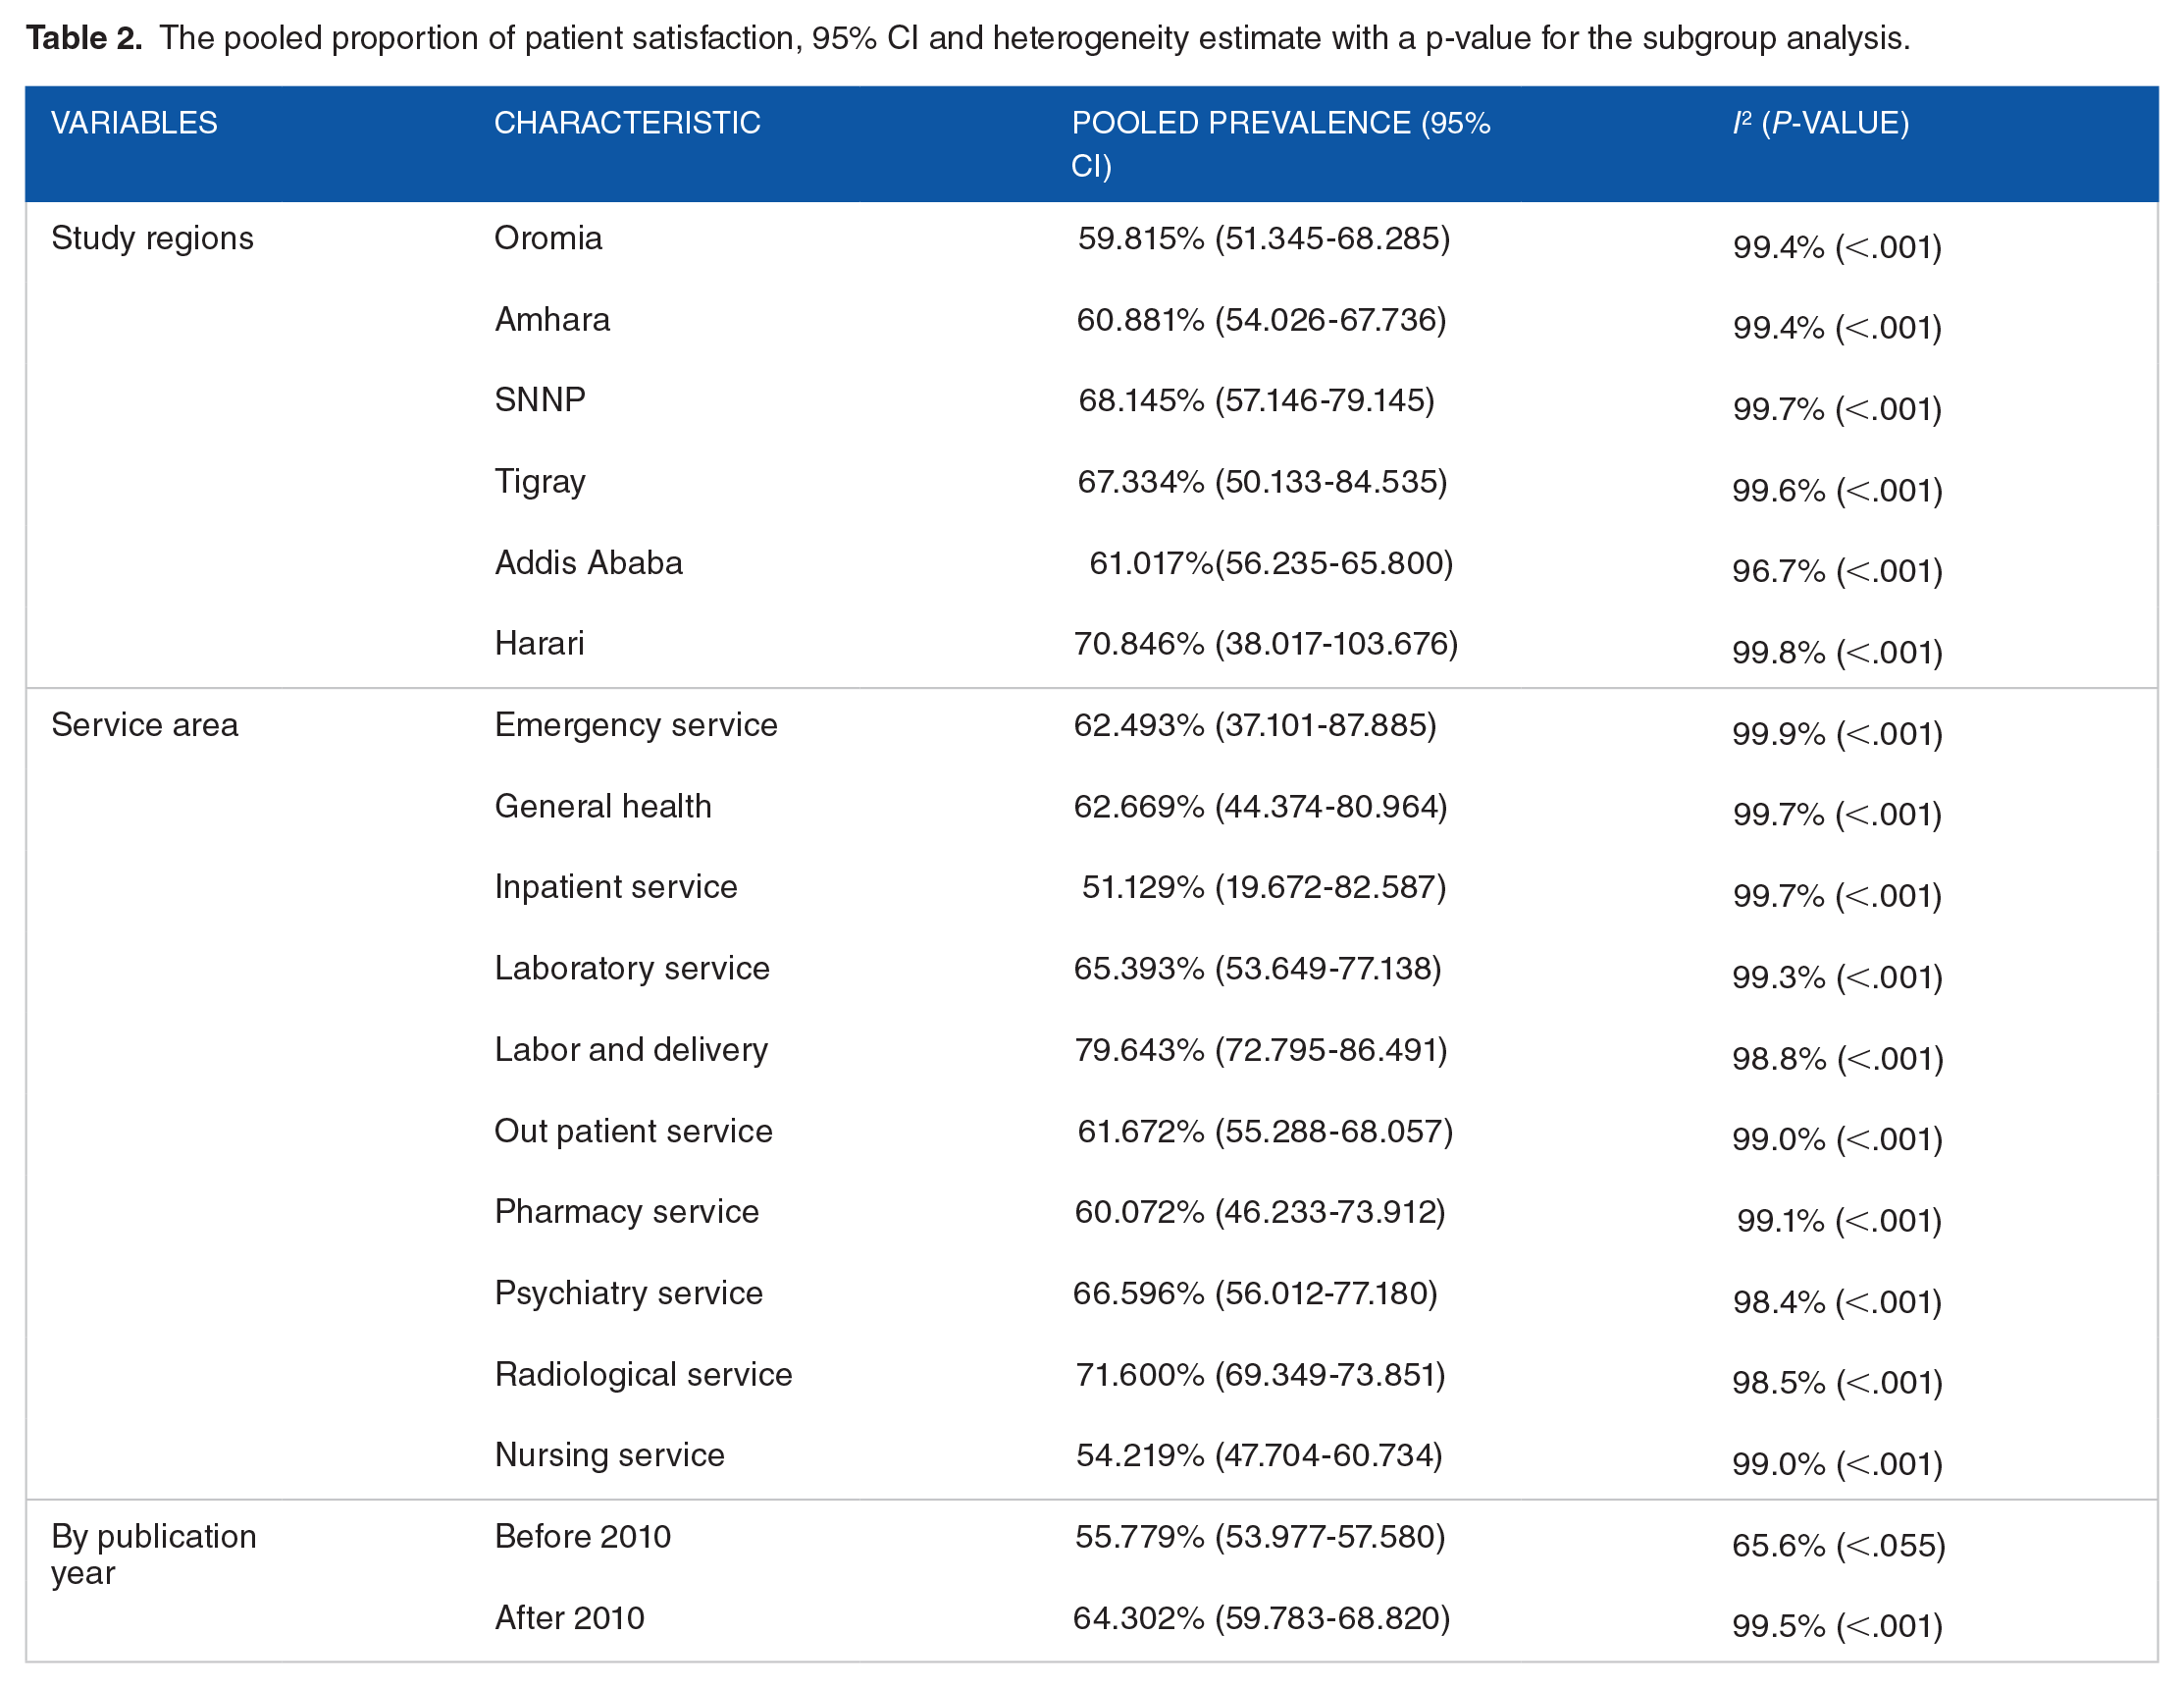
The subgroup analysis based on the region, service are and publication year was done. Based on this, the proportion of patient satisfaction was found to be 61.02% in Addis Ababa, 51.129% in the Inpatient service, and 55.8% before 2010 publication year (Table 2).
The pooled proportion of patient satisfaction, 95% CI and heterogeneity estimate with a p-value for the subgroup analysis.
Associated factors
Based on this review, patient satisfaction in Ethiopian context is associated with those patients who were attending health center (AOR = 2.68; 95% CI = 1.79, 2.85), being literate (AOR = 0.46; 95% CI = 0.28-0.64), being aged >34 years (AOR = 2.07; 95% CI = 1.28, 2.85), and divorced marital status (AOR = 0.58; 95% CI = 0.38, 0.88) (Figure 4).

Summary presentation of factors that affect patient satisfaction in Ethiopia.
Demographic characteristics of participants
Divorced/widowed individuals were 42% less likely satisfied than married individuals (AOR = 0.58, 95% CI = 0.38, 0.88). Divorced clients (AOR = 4.26, 95% CI = 1.11, 16.26) were more dissatisfied). 27 Those who were illiterate (AOR = 0.23, 95% CI = 0.074, 0.691) were 77% times less likely satisfied than their literate counter parts. 28 Mothers with secondary level education (AOR = 2.08, 95% CI = 1.08, 4.03) were satisfied as compared to individuals who do not read and write. 29
Participants with diploma and above educational status were (AOR = 0.34, 95% CI = 0.24, 0.97) 66% times less likely satisfied as compared to individuals with educational status lower than diploma. 30 Individuals who have an educational status of primary school were 68.3% less likely (AOR = 0.317, 95% CI = 0.11, 0.88) compared to those individuals who did not attend any form of education. 31
Participants who had excellent to good self-perceived health condition were about 3 times (AOR = 3.53, 95% CI = 2.27, 5.49) more likely satisfied as compared to individuals with fair to very poor self-perceived health status. Individuals who were disappointed with health care services were 68% less likely satisfied compared to (AOR = 0.32, 95% CI = 0.22, 0.47) compared to patients who were not disappointed. 32
Individuals between ages group 20 to 29 were (AOR = 8.61, 95% CI = 2.35, 9.54) satisfied compared to age group >40 years. 33 Participants with age group 25 to 34 years were (AOR = 1.94, 95% CI = 0.610, 2.223) about 2 times more likely satisfied compared to older age participants. 28 Older age (AOR = 3.353, 95% CI = 1.628-6.905). 34
Being male (AOR = 0.612, 95% CI = 0.39, 0.94) compared to their female counter parts. 35 The pooled effects of 2 studies showed age greater than 34,28,34 pooled effect of 3 studies showed that educational status,3,30,31 and pooled effect of 2 studies divorced marriage status3,27 were associated with patient satisfaction (Figure 5).
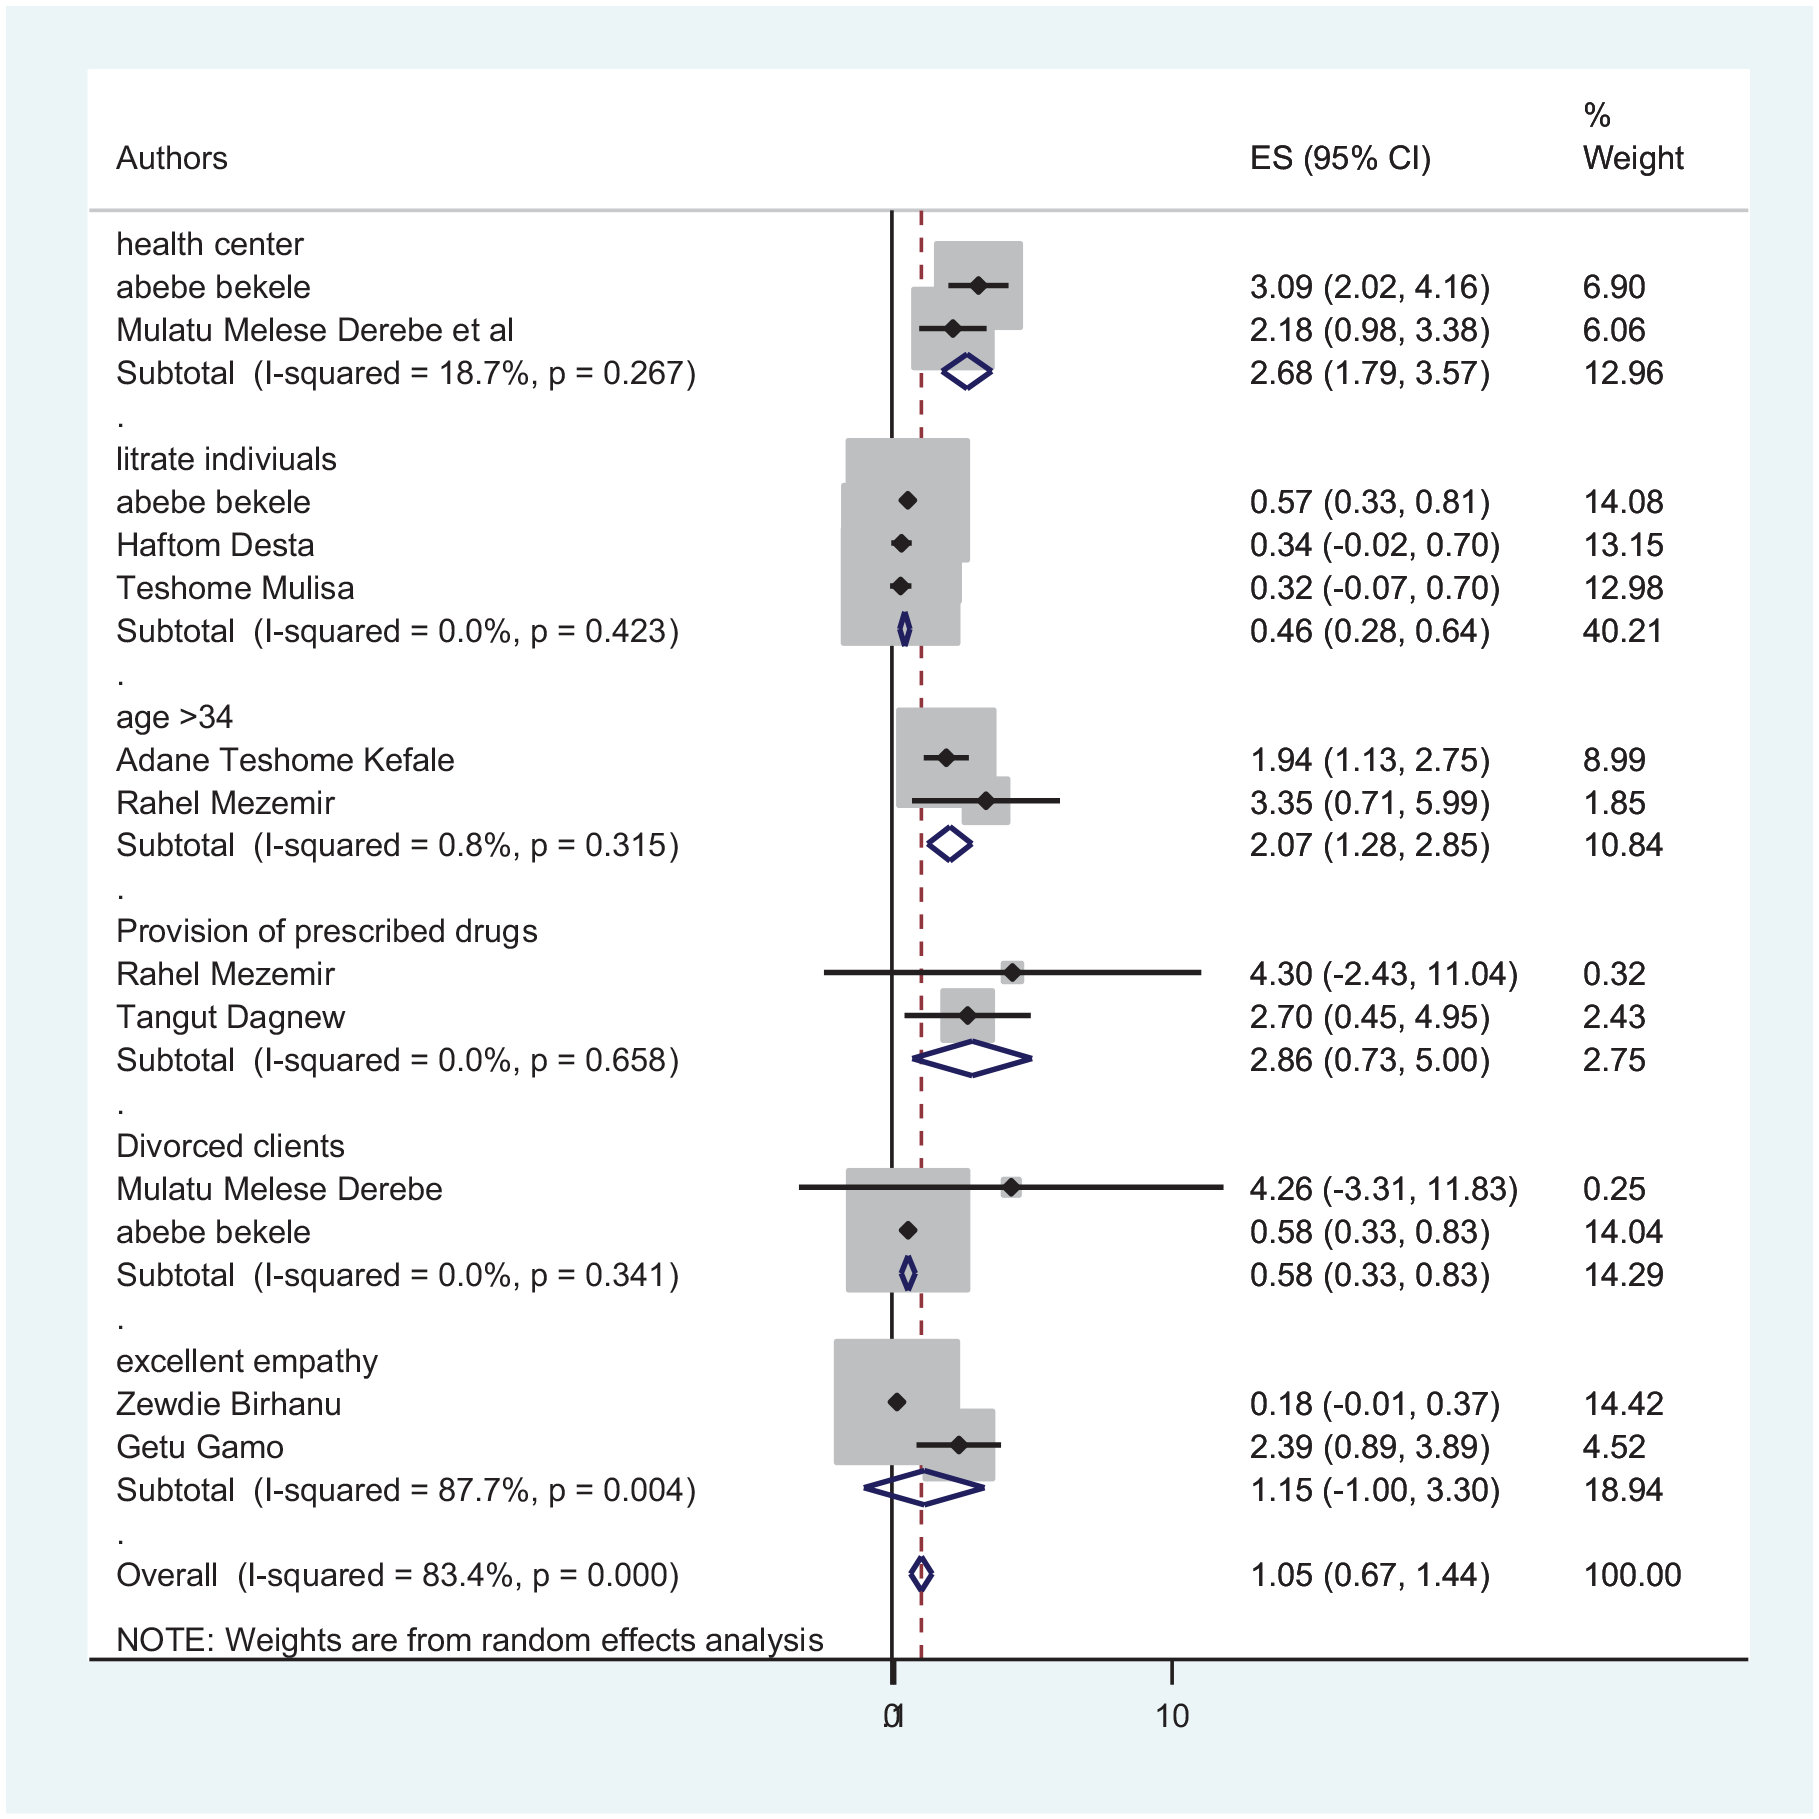
The pooled effect of health canter, literacy, age, divorced clients, provision of prescribed drugs and excellent empathy.
Socio-economic factors
Waiting time ⩽1 hour before seeing a doctor or a nurse (AOR = 2.9; 95% CI = 1.14, 7.58) compared to >1 hours were more likely to be satisfied. 36 Respondents who have had a short stay in the hospital were found to be satisfied (AOR = 4.54, 95% CI = 2.38, 8.65). 12
Participants who stayed in the ward for less than 4 days were 56% times more satisfied (AOR = 0.44, 95% CI = 0.22, 0.88) as compared to those who stayed for 4 to 7 days. 37 Respondents waited less than or equal to 30 minutes in the waiting area (AOR = 3.16, 95% CI = 1.37, 7.25). 38 Those complainers of the long waiting time were 0.01 times less likely satisfied than those waiting for short time (AOR = 0.01; 95% CI = 0.002, 0.07). 30 Patients who had short waiting time to enter into examination room stay less than 1 hour (AOR = 4.12, 95% CI = 1.4, 11.62) compared to individuals who waited greater than 1 hour. 31
Participants who reported their feeling on ways by which privacy was assured (AOR = 6.32, 95% CI = 2.78, 14.41) were more likely satisfied than participants to whom measures were not taken to assure privacy. 37 Respondents who did not report the presence of adequate privacy were less likely satisfied with the outpatient service they received (AOR = 0.52, 95% CI = 0.27, 0.78). 12 The clients who used services with payment (AOR = 2.03; 95% CI = 1.22, 3.39) were more dissatisfied than those service users with free of charge. 27 Paying participants (73%) were less likely satisfied than nonpaying participants (AOR = 0.27 95% CI = 0.09-0.81). 39
Patients who earned free hospital services (AOR = 2.10, CI = 1.27-3.48) were satisfied in the overall services than those who paid for the hospital services. 40 Those patients who paid ⩽157 ETB to service (AOR = 1.9; 95% CI = 1.15, 3.60) compared to >157 ETB were more likely satisfied. 36 Those who were not charged for service (AOR = 2.510, 95% CI = 1.518, 4.150) 34 were satisfies than those who were charged. Paying service users (AOR = 2.03, 95% CI = 1.22, 3.39) were more dissatisfied. 27
Obstetric experiences
Participants who delivered their baby without complication (AOR = 2.1; 95% CI = 1.12, 3.93) were 2 times more likely to be satisfied than mothers with who deliver with complication. 36 Mothers who get supportive individuals during delivery were six times more likely satisfied compared to individuals who did not get supportive individuals(AOR = 6.23 95% CI = 2.75-14.1), and mothers who give birth by cesarean section were 4 times more likely satisfied than mothers who deliver by spontaneous vaginal delivery (AOR = 3.6 95% CI = 1.44-9.06). 39
Mothers who deliver with cesarean section were (89%) satisfied compared to mothers who deliver through spontaneous vaginal delivery (AOR = 0.11, 95% CI = 0.023-0.51); individuals who plan to give birth at health care institution were 3 times more satisfied (AOR = 3.30, 95% CI = 1.38-7.9) compared to indivduals who plan to deliver at home; and mothers who have less than 6 hours of laboring time were 4 times (AOR = 4.03, 95% CI = 1.66-9.79) more likely satisfied compared to individuals who have greater than 6 hours. 41
Mothers admitted in Mekelle general hospital (AOR = 2.61, 95% CI = 1.23, 5.45) were about 3 times more likely satisfied compared to mothers who were admitted to Ayder referral hospital. 37 Participants who were admitted in Finoteselam general hospital were 95% more likely satisfied (AOR = 0.047, 95% CI = 0.017-0.135) compared to participants who attended in Felege Hiwot referral hospital. 40
The pooled effect of payment,30,34,36,38-40 prolonged waiting time.12,31,37,38 and privacy12,36,37 were not became significantly associated factors (Figure 6).

The pooled effect of payment, waiting time and privacy.
Health service provision factors
Client satisfaction in the health centers (AOR = 2.18; 95% CI = 1.29-3.69) was significantly higher than that of hospital services. 27 Health center (AOR = 3.09; 95% CI = 2.20, 4.34). 3 Urban residence (AOR = 0.49, 95% CI = 0.31, 0.78) was 51% times less likely satisfied compared to rural residence. 35 Hospital stay for more than 48 hours (AOR = 4.32, 95% CI = 2.21, 8.43) were more likely to be satisfied compared to stay of 1 to 12 hours. 29
Drug availability (AOR = 2.7, 95% CI = 1.3, 5.8) compared with absence prescribed drug34,42. Respondents who did not get all the required items/services from the hospital were less satisfied than their counterparts (AOR = 0.78, 95% CI = 0.41, 0.96). 12
Diagnosed with schizophrenia (AOR = 0.48, 95% CI = 0.28, 0.81), unfavorable attitude (AOR = 0.49, 95% CI = 0.28, 0.86), and poor social functioning (AOR = 0.52, 95% CI = 0.34, 0.80) were significantly associated with satisfaction. Patients under acute illness were less likely satisfied with nursing care services (AOR = 0.406, 95% CI = 0.214-0.771) than those who were under chronic illness conditions. 40
The pooled effects of 2 studies showed that service satisfactions at the health center3,27 were significantly associated with patient satisfaction, whereas the pooled effects of provision of prescribed drugs had no significant association with patient satisfaction (Figure 5).
Interaction with the health care provider
Respondents who perceived poor empathy by the provider had an average decrease of 0.319 in their satisfaction score compared to those who perceived good empathy (AOR = −0.319, 95% CI = −0558, −0.079); respondents who perceived excellent empathy have an average increase of 0.187 unit in satisfaction score as compared to patients who perceived good empathy (AOR = 0.187, 95% CI = −0.030 to 0.404). 43
Absence of good dialog with outpatient service providers were negatively associated with respondents’ satisfaction (AOR = 0.28, 95% CI = 0.12, 0.41). 12 Patients who were treated with respect (AOR = 3.0, 95% CI = 1.4, 5.7) 42 and patients who witnessed poor non-verbal communication had an average decrease of 0.595 units in satisfaction (AOR = −0.595, 95% CI = −1.078 to −0.112) (Figure 5).
Discussion
Nowadays, to evaluate the quality of health care services given at different health care institutions, client satisfaction becomes the primary reason. Client satisfaction is also a key indicator of the level of success of providers to meet client expectations and values. 27 This time, most countries around the world have a quality assurance and accreditation process which requires the satisfaction of clients to be measured on a regular basis. 1
Hospitals and health centers need to ask patients regarding what they think about the care and treatment they have received. This helps hospitals to improve the quality of care they will give. 44 Satisfaction had a great impact on whether a person seeks medical advice, adheres with treatment, and it helps to keep up a positive relationship with health care providers.4,5
This meta-analysis estimated the proportion of patient satisfaction in Ethiopia. Accordingly, the proportion of patient satisfaction was 63.7% (59.48, 67.91) which is high based on over 50% satisfaction scale. 45 The analysis estimation of this study was higher than a study conducted in Mozambique. 46 The difference might be attributed to the fact that, in our health care facilities, there is a relatively adequate number of health professionals and better diagnostic facilities. It is lower than a study conducted in Tanzania, 47 99.6% in Kuwait Primary Health Care, 48 74% in Trinidad and Tobago. 49 The possible explanation for this could be socio-cultural differences in the study areas, or there may be differences in the health service delivery system to clients, there may be differences in commitments of health care managers, and the health care providers.
Based on the subgroup analysis, the proportion of patient satisfaction was high in the labor and delivery ward compared to other service areas. The reason for higher patient satisfaction in labor and delivery service may be due to the government’s and private partners’ initiative to give priority to mothers, especially for pregnant mothers; most of the services in this ward were free of charge, equipments were well prepared and heath care professionals were well trained.
Based on the pooled analysis of 2 or more AOR studies, attending health centers, age ⩾34 years, literate individual and divorced clients were associated with patient satisfaction.
Literate individuals were 54% less likely satisfied with the service compared to illiterate individuals. This is also in agreement with the study conducted in Kuwait 50 in which patients with lower educational levels, illiterate and elementary school level patients showed a high level of satisfaction. According to a study a study conducted in Rome greater satisfaction was observed in individuals with a lower educational status. 51 In Bangladesh, higher level of education is associated with lower level of patient satisfaction. 52 This shows that patients with relatively higher educational status have a greater expectation; educated people perceived that some hospital activities were a simple activity that might even be carried out by other professionals, and they are more critical in analyzing the services provided; these could make them less satisfied.
Educated individuals were more likely prone to feel small faults in the different department of health institutions like delay, extended waiting time, and lack of prescribed drugs when compared to others. On the other hand, this study is in contrast with the study conducted in Nigeria, that indicates the more educated the respondent is, the more satisfied he/she is with the service provided. 53 The research that was done in Morocco also shows that illiterates are less satisfied than those who are educated. 54 The difference might be due to the fact that those illiterates have a lower expectation of the service provided since they were not fully aware of the standard service provided; they were afraid of questioning what is in their mind, and they don’t they are getting health care properly.
The odds of individuals within the age group >34 years were nearly 2 times to have higher satisfaction. This is also in agreement with the study conducted in Bangladesh in which older aged individuals were satisfied compared to younger one’s. 52 According to a study conducted in 31 hospitals in a large Midwestern metropolitan area in US, older patients were more satisfied with hospital care than younger patients. 55 Women of lower age groups who were less likely to be satisfied with the health care service they received were significantly associated with patient satisfaction. 56 The possible reason might be younger individuals didn’t have many experiences on the existing hospitals’ service provision; young individuals have higher expectation from the hospitals; they think that working systems in the hospital is easy going which is the cause of dissatisfaction. Older individuals were in the service delivery system for a very long period, which makes them either adapt to the existing system or give up on the system, which makes them stop complaining about it.
Individuals with divorced marriage status were nearly 42% dissatisfied compared to individuals who were married. This study was in line with divorced clients who were dissatisfied with the service provided compared to married individuals. 57 The possible explanation was due to the fact that divorced clients had poor family and social life which makes them not use health services frequently; instead they focus on their religion and religious leaders. This study is not in line with the study conducted in Indira Gandhi Memorial hospital, in which the divorced group had the high number of satisfaction compared to other groups. 58 This may be due to frequent exposure to services utilization; divorced clients utilize more medical service than single individuals.
The odds of Individuals who attend health centers were nearly 3 times satisfied compared to hospital users. This study was in line with the study conducted in west Amhara; the overall client satisfaction in the health centers was significantly higher (55%) than that of hospital services (36%) users. 27 The possible explanation will be health centers were easily accessible, less waiting time, clean, and nearby compared to hospital facilities. Low number of patient flow and availability of different friendly services tend to satisfy clients.
Strength and Limitation of the Study
This systematic review and meta-analysis is the national proportion conducted in Ethiopia. It gives the policy makers, hospital managers, ward heads, and hospital employees a baseline information about patient satisfaction and different factors which affect their satisfaction; finding the source of the problem is half part of the solution. It may lack national representativeness because no data were found from BenishangulGumuz, Afar, Gambella, Somalia, and Dire Dawa regions.
Conclusions
In Ethiopia, The proportion of patient satisfaction was high based on over 50% satisfaction scale. Attending health centers, educational status, age, and marital status were associated with patient satisfaction with health care service. Therefore, hospital management, policymakers, and other responsible officials are suggested to strengthen the satisfaction by improving the individual’s awareness of the importance of attending health care services, give regular education on the importance of having a good family life. Individuals are suggested to improve their awareness toward the services given by health care institutions.
Supplemental Material
sj-docx-1-his-10.1177_11786329211040689 – Supplemental material for Patient satisfaction towards health care services provided in Ethiopian health institutions: a systematic review and meta-analysis
Supplemental material, sj-docx-1-his-10.1177_11786329211040689 for Patient satisfaction towards health care services provided in Ethiopian health institutions: a systematic review and meta-analysis by Henok Biresaw, Henok Mulugeta, Aklilu Endalamaw, Nurhusien Nuru Yesuf and Yibeltal Alemu in Health Services Insights
Supplemental Material
sj-docx-2-his-10.1177_11786329211040689 – Supplemental material for Patient satisfaction towards health care services provided in Ethiopian health institutions: a systematic review and meta-analysis
Supplemental material, sj-docx-2-his-10.1177_11786329211040689 for Patient satisfaction towards health care services provided in Ethiopian health institutions: a systematic review and meta-analysis by Henok Biresaw, Henok Mulugeta, Aklilu Endalamaw, Nurhusien Nuru Yesuf and Yibeltal Alemu in Health Services Insights
Footnotes
Authors’ Note
Aklilu Endalamaw is now affiliated to School of Public Health, The University of Queensland, Brisbane, Australia.
Authors’ Contributions
HB conceived and designed the study. HM, AE, NN, and YA established the search Strategy. All the authors read the manuscript before they have given the Final approval for publication.
Declaration of Conflicting Interests:
The author(s) declared no potential conflicts of interest with respect to the research, authorship, and/or publication of this article.
Funding:
The author(s) received no financial support for the research, authorship, and/or publication of this article.
Availability of Data and Materials
Data generated or analyzed during this study are included in this Published article. Other materials will be available upon request.
Supplemental Material
Supplemental material for this article is available online.
References
Supplementary Material
Please find the following supplemental material available below.
For Open Access articles published under a Creative Commons License, all supplemental material carries the same license as the article it is associated with.
For non-Open Access articles published, all supplemental material carries a non-exclusive license, and permission requests for re-use of supplemental material or any part of supplemental material shall be sent directly to the copyright owner as specified in the copyright notice associated with the article.