
Abstract
Client satisfaction is an important measure of quality of care as it provides information on how well health service providers meet clients’ values and expectations. The study was cross-sectional and analytical in nature. Data were obtained with the use of an interviewer-administered questionnaire. Respondents (n = 994) were a subset of a larger group of community members recruited for a study on quality of health care who had used a health facility for care within 3 months prior to data collection. A total of 94% of clients were satisfied with services received although client satisfaction rates were higher with private than public health facilities. Waiting time of less than 20 minutes (adjusted odds ratio [AOR] = 9.35, 95% confidence interval [CI] = 2.08-41.67), cheap cost of all services received (AOR = 7.58, 95% CI = 1.95-29.41), and the ability of the health care provider to offer explanations clearly to clients (AOR = 6.21, 95% CI = 1.90-20.41) were predictors of client satisfaction. However, the use of a government-owned hospital (AOR = 0.23, 95% CI = 0.08-0.63) was predictive of client dissatisfaction. Only service characteristics were predictive of client satisfaction. Improvement in service delivery is recommended.
Background
Client satisfaction refers to a consumer’s feelings about a specific service experience. It is the judgment that a product or a service feature provides a pleasurable level of consumption-related fulfillment. 1 Client satisfaction is of fundamental importance as a measure of the quality of care because it gives information on the provider’s accomplishment at meeting the client’s values and expectations. 2 A model often used to study the quality of care and client satisfaction is that by Donabedian. It has 3 components: structure, process, and outcome. 3 Structure relates to the adequacy of facilities and equipment, qualification of medical staff, and administrative structure of programs. The process of care includes appropriateness and completeness, technical competence of the providers, interpersonal skills, the capacity to deliver prompt service without wasting time, and the ability to disseminate information to patients. Outcomes measures include patient recovery, cure, survival, disability, and patient satisfaction. Patient satisfaction is defined as a patient-reported outcome measure, whereas the structures and processes of care can be measured by patient-reported experiences. Patient-reported experiences are predictors for overall patient satisfaction. 4 A second model of quality (SERVQUAL) is that put forward by Parasuraman. The domains in the model are tangibles (including physical facilities and equipment), reliability, responsiveness, assurance, and empathy. 5
A multicountry survey in 6 Central and Eastern European countries reported that average rates of client satisfaction in each of the countries were relatively high although 10% to 14% of the service users were not satisfied with the quality of or access to health care services they had used in the preceding year with significant differences across countries. 6 The top 3 indicators of patients’ satisfaction across 3 Balkan countries were reported as trust and overall satisfaction with the attention of doctors and satisfaction with the outcome of the treatment, whereas long waiting time and huge administrative procedures were predictors for lower patient satisfaction. 7
Another survey on clients’ experience and satisfaction of using health care services in a community-based health insurance program in Bangladesh reported that the overall satisfaction level toward health services was quite favorable with an overall satisfaction mean score of 4.17 ± 0.04 out of a maximum of 5.00. 8 A survey on client satisfaction with the quality of health services in Pakistan found less than half of the clients (41%) were satisfied with the services provided by the basic health units. 9 Another survey on client satisfaction with the quality of health care in Southern India reported client satisfaction with different health care providers as high, although only about 40% of the clients were happy with the cost of the services. 10
A survey on client satisfaction in a faith-based health network in Uganda found a high level (84.2%) of satisfaction with services but recorded low client satisfaction with the dimensions of client rights and payments. 11 The client’s perceived technical competence of provider, accessibility, convenience, and availability of services especially prescribed drugs were the strongest predictors of general satisfaction reported by another study conducted in Uganda. 12 In eastern Ethiopia, a report showed that about 46% of the respondents were not satisfied with the health services provided. Satisfaction decreased with an increase in perceived length of waiting time and was lower for patients coming from outside of the region with poor paying status and poor availability of drugs within the facility. 13
In Nigeria, a survey of the perception of the quality of and preference of health care services among residents of Abeokuta South Local Government, Ogun State, reported that 78% of respondents were satisfied with healthcare received among the respondents. However, the respondents showed an average level of satisfaction as regards general cleanliness of the facility and a relatively lower level (36%) of satisfaction with waiting areas. 14 Other studies in Nnewi and Kano in Nigeria reported client satisfaction levels ranging from 75% to 83%.15,16
Client satisfaction is often measured in health facilities among those who have used specific services most recently rather than in the community.12,13,15,16 This approach often leaves out the larger majority of community members who may not have used those specific facilities for many reasons and whose views may not be captured when planning for improvements in service delivery, thus creating gaps in representativeness. Community-based assessments are more likely to provide a robust identification of factors that affect client satisfaction. This approach is more inclusive, and without the social desirability bias inclined toward the health worker in a health facility setting. This survey was therefore conducted to assess client satisfaction and identify its predictors in 4 communities in Lagos State and provides information for stakeholders and policymakers, so changes can then be advised and instituted in health care facilities to increase public use of health care services.
Methods
Data
Lagos state is located in the Southwest geopolitical zone of Nigeria and was created on May 27, 1967. It was the capital of Nigeria until 1991 and remains the economic capital of Nigeria. Lagos State is made up of 20 Local Government Areas (LGA), 16 of which are urban and 4 are rural. The LGAs are divided into wards and streets. The population of the State was 9 113 605 by the 2006 Census and the projected population was 12 615 361 in 2017, although the state government stated the population to be 17 552 940 in 2012. Lagos state has 26 registered General Hospitals, 256 public healthcare centers, 2886 private hospitals or specialist clinics, and laboratories or diagnostic centers, and an estimated 160 trado-medical centers. 17 Health care is provided through a mix of private and public facilities at primary, secondary, and tertiary levels.
The study design was analytical and cross-sectional using quantitative methods to elicit client satisfaction and service characteristics assessed by community members who had recently used a health facility in Lagos State within 3 months before data collection. An interviewer-administered questionnaire was used to obtain information for the study.
The study population was drawn from adult residents aged 18 years and above who were living in the selected LGAs. All sampled consenting adults aged 18 years and above living in the selected LGAs were included in the study, and there were no exclusion criteria. Respondents in this study were a subset (n = 994) of the larger group (2000) who had been recruited for assessment of quality of care. The sample size determination is described in details elsewhere and was derived using the appropriate formula for prevalence studies, statistical assumptions of a type 1 error rate of 5%, a prevalence of 0.58 of positive perception of health workers by community members, a precision of ±2.5 percentage points, and a 20% nonresponse rate. 18 The calculated minimum sample size was 1919, which was rounded up to 2000.
A multistage sampling method was used whereby in the first stage, out of the 20 LGAs in Lagos state, of which 16 are urban and 4 are rural, 4 LGAs (Ikeja, Mushin, and Ojo as urban LGA) and Badagry (rural LGA) were selected using stratified random sampling by balloting. In each of the selected LGA, 2 wards were selected by simple random sampling by balloting (second stage). The third stage of sampling involved using the sampling frame of all streets in the selected wards and table of random numbers to select a minimum of 10 streets. Consecutive houses on each street were selected at the fourth stage using the LGA house numbering system starting from the first number. In the fifth stage, one household was selected by balloting and a consenting adult was approached to participate in the study. Where there was more than one consenting adult in the selected household, one was chosen by a ballot.
Operational definitions
“Recent use” of a facility for this study was defined as use within the previous 3 months before respondent interviews.
“Client satisfaction” defined as when a respondent either agreed or strongly agreed to have been satisfied with the health services received at the visited facility.
Measures
The interviewer-administered questionnaire instrument was developed from a review of the literature on the subject, based on the conceptual framework of the SERVQUAL and Donabedian models.
The questionnaire was pretested in Alimosho LGA. The alpha Cronbach reliability coefficient was .792. The instrument was modified and administered after pretesting. The instrument had 2 sections. The first dealt with sociodemographic characteristics of the respondents such as age, sex, educational level, and occupation. The second focused on the assessment of quality of the facilities and providers and client satisfaction with the quality of the service received.
Data were collected by 4 trained research assistants (who had a minimum of secondary school education) between February and March 2017. Research assistants were trained for 2 days prior to data collection.
Analysis strategy
All completed questionnaires were reviewed on the field and in the office for completeness and consistency of information. Data were entered using Statistical Package for the Social Sciences (SPSS) version 22, coded, and cleaned before data entry. The outcome variable was client satisfaction (categorized into satisfied or dissatisfied). Client satisfaction was measured on a Likert-type scale using discrete data: “very satisfied” and “satisfied” were classified as “satisfied,” whereas “indifferent,” “dissatisfied,” and “very dissatisfied” were classified as “dissatisfied.” The predictor variables were sociodemographic characteristics of respondents and client assessments of various aspects of services received. Service characteristics assessed included availability of drugs and laboratory tests, cost of various services received, cost of drugs, adequacy of consultation time, privacy of consultation, waiting time, response to questions asked, the receipt of information about treatment given, and feeling better after treatment. Association between various respondents’ characteristics and outcome variables were sought for using the chi-square test. Multivariate logistic regression was done for factors found to be significant (P < .05) on bivariate analysis to identify the predictors of client satisfaction.
Ethics committee approval
All respondents were informed of the objectives of the study, its potential benefits for the health system and the state, and there was no risk of harm to them. Written informed consent was obtained from each respondent before enrollment in the study. Ethical clearance was obtained from the Lagos State University Teaching Hospital (LASUTH) Ethics Committee, with reference number LREC/06/10/755 (November 8, 2016 to August 8, 2017).
Results
More than half of the respondents (62%) were female, with the majority (40%) aged between 30 and 39 years, with average age being 38.9 ± 10.2 years. A third of the respondents (67%) had at least a secondary school education, 19% had tertiary, whereas 16% either had little (primary school) or no education. Most respondents were married (84%), and the rest were single, divorced, or separated. Almost three-quarters (72%) were Christians, whereas 28% and 0.3% practiced Islam and traditional religion, respectively. The average income of respondents was 29 477 ± 67 468 with 11% of all respondents earning less than US$1 per day (<₦10 500 per month); however, 418 (41.5%) of the respondents did not reveal their income. Among respondents who rated their satisfaction, 910 (93.7%) were satisfied with the services received in the facilities visited, and 23 (2.3%) of all respondents provided no assessment.
More than half of the respondents (55%) considered the cost of all services received as being cheap or affordable, 37% rated the cost as fair, whereas less than a tenth (8%) felt they were expensive or unaffordable. More than two-thirds of respondents (68%) reported that the pharmacy had an adequate supply of needed drugs and 45% felt the drugs were affordable or cheap. More than three-quarters of respondents (79%) felt there were adequate tests available in the laboratory in the facilities they attended, and a tenth of respondents (10%) considered the laboratory tests as being expensive (Table 1).
Respondents’ assessment of availability and cost of services at used health care facilities in the last 3 months.

Total < 994 indicates non-response by respondents.
Similar proportions of respondents (43%) rated waiting time as being less than 20 minutes and between 20 and 59 minutes. Almost all respondents that attended the various facilities felt the consultation time and privacy were adequate, they received good or excellent responses to questions asked, received information about treatment given, felt better after treatment, and were satisfied with care received (Table 2). Table 3 reveals that none of the sociodemographic characteristics of respondents had a significant association with client satisfaction.
Respondents’ assessment of services and staff attitude at used health care facilities in the last 3 months.

Total < 994 indicates non-response by respondents.
Association between sociodemographic characteristics of respondents and client satisfaction.
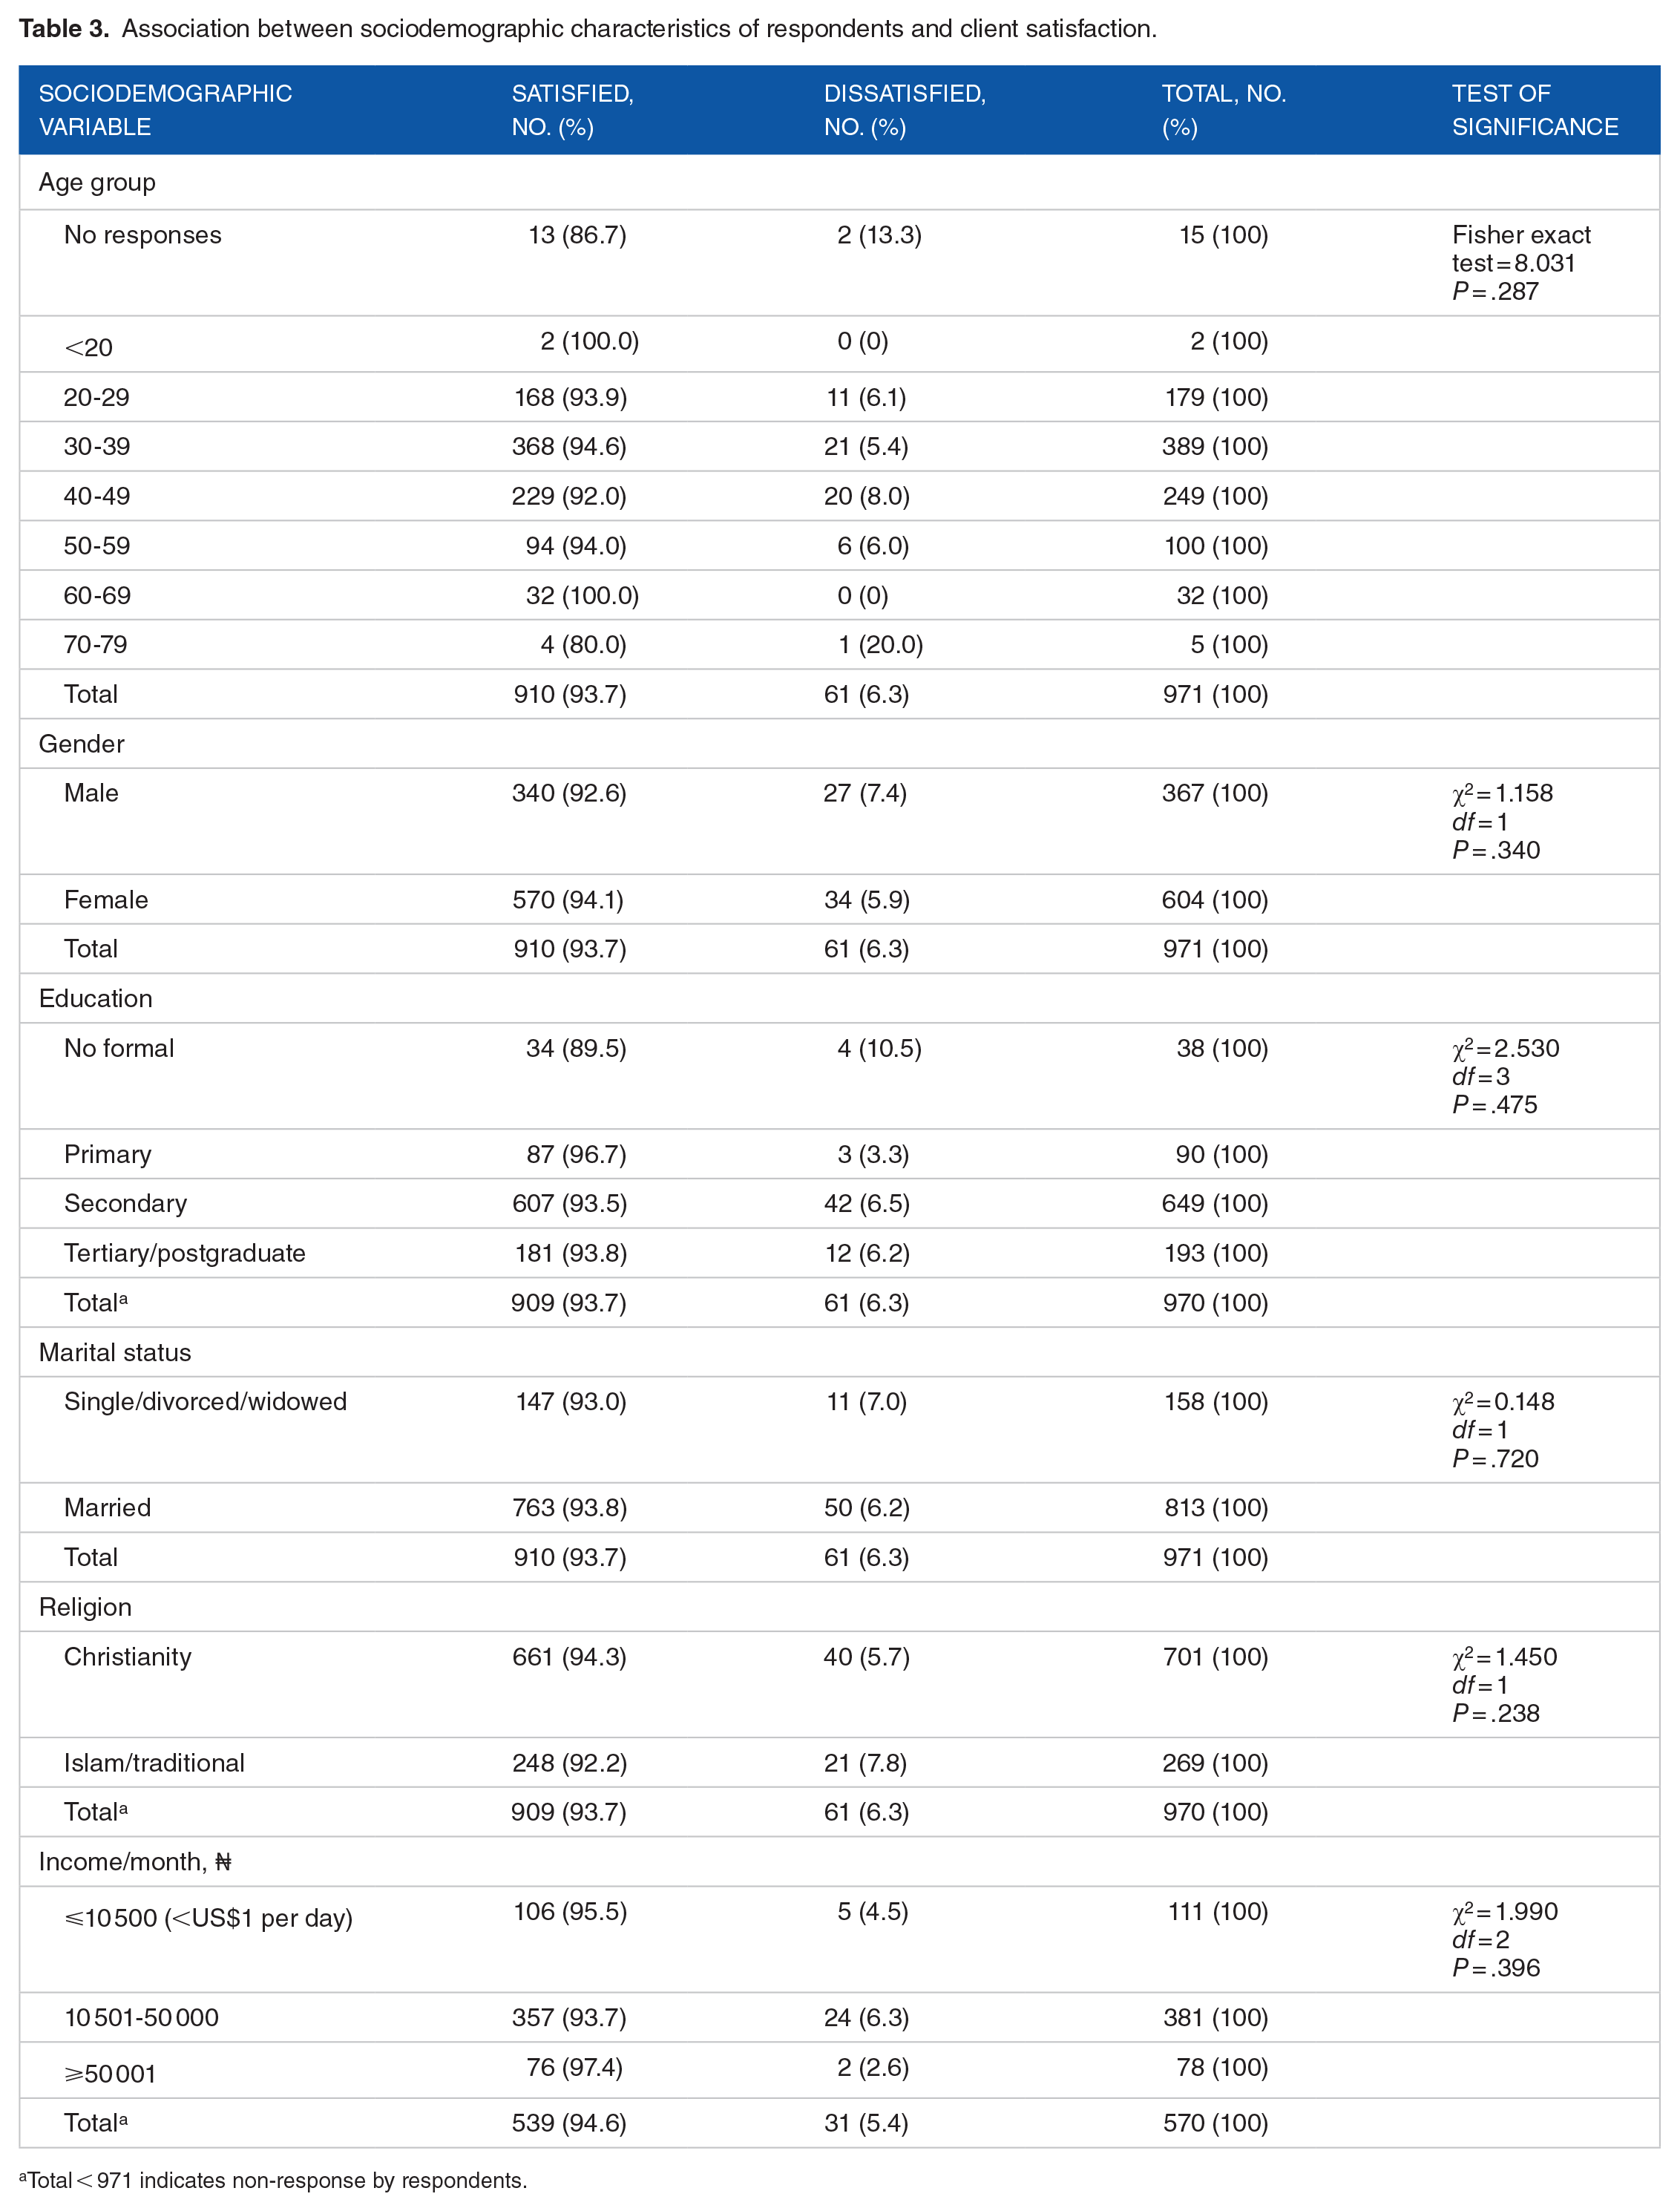
Total < 971 indicates non-response by respondents.
Service characteristics that showed significant association with client satisfaction were the cost of all services and drugs being cheap or affordable, waiting time of fewer than 20 minutes, adequacy of consultation time and privacy, being offered information about treatment given, and feeling better after treatment (Table 4).
Association between service characteristics and client satisfaction.

“Others” refers to drug stores, paraprofessionals, and traditional health facilities.
Total < 971 indicates non-response by respondents.
Bold values denote statistical significance, that is p<0.05.
Table 5 provides information on the predictors of client satisfaction. Predictors found to increase the odds of client satisfaction were waiting time of less than 20 minutes and between 20 and 59 minutes (adjusted odds ratio [AOR] = 9.35, 95% confidence interval [CI] = 2.08-41.67) and (AOR = 15.38, 95% CI = 3.73-62.5), cost of all services received being cheap (AOR = 7.58, 95% CI = 1.95-29.41) and fair (AOR = 3.74, 95% CI = 1.14-12.35), and the receipt of information about treatment given (AOR = 6.21, 95% CI = 1.90-20.41). The use of government-owned facilities (government hospitals and primary health centers [PHCs]) (AOR = 0.23, 95% CI = 0.08-0.63) showed a decrease in the odds of client satisfaction.
Predictors of client satisfaction.
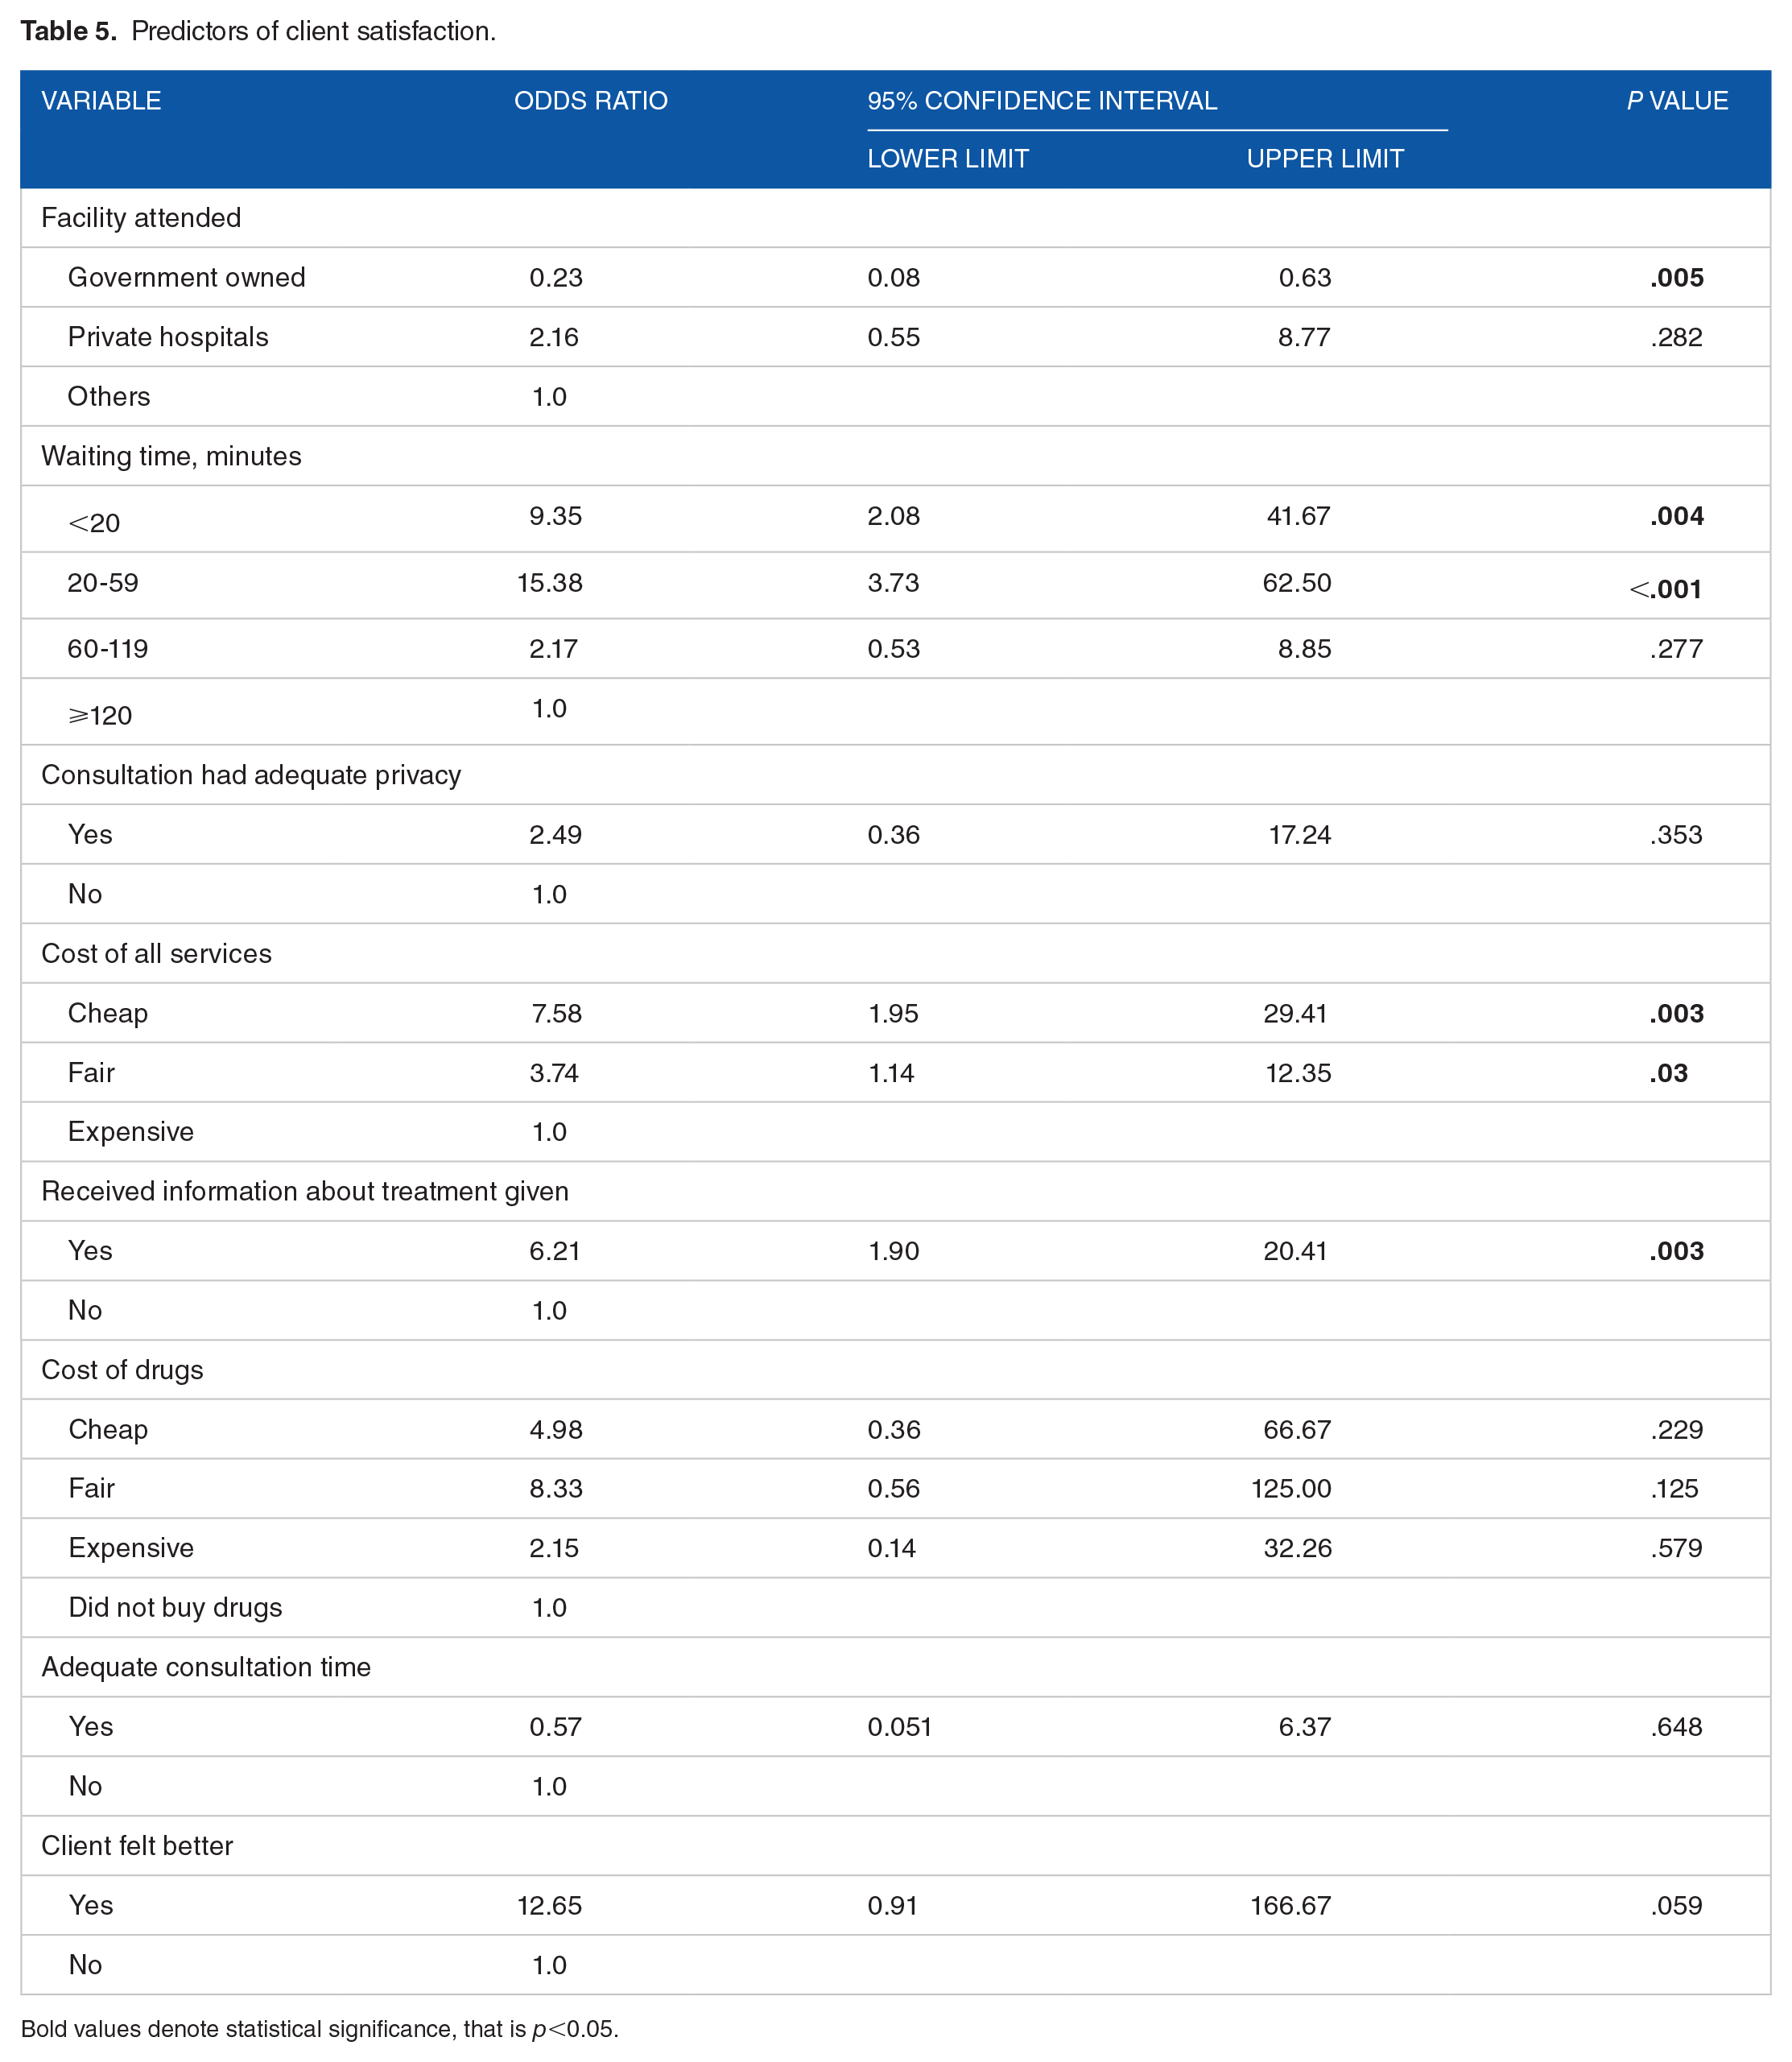
Bold values denote statistical significance, that is p<0.05.
Discussion
The high level of satisfaction elicited in this study is similar to the 90% client satisfaction rate with services at a PHC in Lagos state 19 and rates of 84%, 90%, and 83% found in Nnewi, Kano, and Sagamu in Nigeria, respectively.15,16,20 Similarly, high satisfaction rates have also been reported from the Balkan countries, and Bangladesh, and Canada.7,8,21 The satisfaction level is, however, clearly higher than the 41% reported from Pakistan 9 and the 62.6% obtained in a maternal and child care facility in Ondo state. 22 This high level of client satisfaction may, however, be on account of good quality of services obtainable in facilities in Lagos and cultural nuances.
Significant predictors that increased the odds of client satisfaction were waiting time of fewer than 20 minutes and between 20 and 59 minutes, cost of all services received, and the receipt of information about treatment given. The use of public health facilities owned by the government (government hospitals and PHCs) showed a significant decrease in the odds of client satisfaction, but the use of private hospitals though had higher odds and was, however, not significant.
Shorter waiting time as a predictor of client satisfaction found in this study is similar to a study conducted in Kano State 16 where prompt service (short waiting time) and explanation of information to clients were some of the factors that influenced client satisfaction, and in agreement with reports from the Balkan countries 7 and Ethiopia. 13 The predictive finding of short waiting time is expected as clients do not want to pay much higher economic costs while accessing health services. This is an important opportunity cost in a developing country like Nigeria.
Availability of information about their treatment was predictive of client satisfaction found in this study is in concordance with a report from Uganda. 12 Respondents in our study were 6 times more likely to be satisfied with services rendered if the treatment given was explained to them. This is a measure of the competence and communication skills of health workers. Furthermore, offering information to clients enables them to become active participants in the management of their conditions and allays fears about the illness itself and its management.
When clients rated the cost of services provided as cheap (affordable) and fair, they were about 8 and 3 times more likely to be satisfied with the services received, respectively. The finding of cost of services as a predictor of client satisfaction is in accordance with a report from Ethiopia where high cost was found to be a negative determinant of client satisfaction. 13 This indicates that cost containment practices need to be an important consideration for all facilities and measures that reduce the economic burden such as health insurance be aggressively taken up by clients.
The finding that the use of government-owned hospitals was associated with decreased odds of client satisfaction is similar to a study in the Cross-River State, Nigeria, that found a significantly higher level of client satisfaction among those that used private hospitals. 23 This finding may reflect a higher level of expectations in the study respondents who are in Lagos. Furthermore, we had previously shown that health workers in private hospitals had a higher perception index than those in government-owned facilities and this may be responsible in part for the observation. 24 It must be noted that the higher odds of client satisfaction found with the use of private facilities could be due to chance.
Client characteristics were not found to be significantly associated with client satisfaction, thus indicating that the quality of service characteristics is far more important (Figure 1). A strength of this study is the community-based and client-focused nature of assessment. Recall bias is a known limitation of cross-sectional studies.

Summary of research findings and implications.
Conclusions
In conclusion, service characteristics were the true predictors of client satisfaction. Therefore, we recommend that adequate attention should be paid to improving several aspects of service provision such as waiting time, cost containment, and improving the communication skills of health workers.
Footnotes
Funding:
The author(s) disclosed receipt of the following financial support for the research, authorship, and/or publication of this article: The study was funded by the Tertiary Education Trust Fund (TETFUND).
Declaration of Conflicting Interests:
The author declared no potential conflicts of interest with respect to the research, authorship, and/or publication of this article.
Author Contributions
MRA and EOO supervised data collection, performed data analysis, and wrote the manuscript. OOO initiated the concept of the study, was involved in data analysis, wrote the manuscript, and provided overall direction for the study. All authors approved the manuscript.