
Abstract
The RUG-III case-mix system is a method of grouping patients in long-term and post-acute care settings. RUG-III groups patients by relative per diem resource consumption and may be used as the basis for prospective payment systems to ensure that facility reimbursement is commensurate with patient acuity. Since RUG-III’s development in 1994, more than a dozen international staff time measurement studies have been published to evaluate the utility of the case-mix system in a variety of diverse health care environments around the world. This overview of the literature summarizes the results of these RUG-III validation studies and compares the performance of the algorithm across countries, patient populations, and health care environments. Limitations of the RUG-III validation literature are discussed for the benefit of health system administrators who are considering implementing RUG-III and next-generation resource utilization group case-mix systems.
Introduction
Case-mix classification systems group patients into clinically related groups with homogeneous resource consumption, 1 facilitating the implementation of prospective payment systems wherein a portion of reimbursement is tied directly to patient characteristics. This permits facility reimbursement that is commensurate with the facility’s case-mix distribution, allowing for systematic and equitable allocation of financial resources. 2 Payment systems that fail to account for patient characteristics may incentivize facilities to preferentially admit the least disabled or medically complex patients as they are typically less costly to care for.2-4 Additional applications of case-mix systems include comparisons among patient populations across health care settings, regions, and time periods 5 and facility administration such as staffing levels.6,7
The Resource Utilization Groups (RUGs) Version III case-mix classification system was developed in 1994 and was designed to group nursing home residents and skilled nursing facility patients by per diem resource use. 8 Following the structure established by the preceding RUG algorithms (RUG, RUG-II, and RUG-T18),9-11 RUG-III classifies patients into 44 mutually exclusive groups according to a hierarchy of patient categories (ie, Special Rehabilitation, Extensive Services, Special Care, Clinically Complex, Impaired Cognition, Behavior Problems, and Reduced Physical Functions). Secondary splits are based on an Activities of Daily Living (ADL) Index that is calculated by measuring level of dependence in bed mobility, toilet use, transferring, and eating. Finally, within some hierarchy categories, a tertiary split, such as provision of nursing rehabilitation or depression status, is used to further classify patients. Patients generally qualify for one of the 7 categories based on clinical characteristics; however, qualification for the Special Rehabilitation category is based primarily on intensity of physical, occupational, and speech-language pathology therapy that patients receive. 8
RUG-III was developed through a large-scale staff time measurement study of 7658 patients from 176 nursing homes in 6 US states. This study collected resident-specific nursing time using time sheets completed by nursing staff (ie, registered nurses, licensed practical nurses, aides, and orderlies) over the course of their shift. Nursing time was collected over a 24-hour period. Therapists and other auxiliary staff (ie, social workers and transportation aides) reported their resident-specific time using 7-day logs. The RUG-III algorithm explained 56% of the variation in total cost in the derivation data set. 8
Since the original derivation study, the RUG-III case-mix system has undergone some modifications. In 1998, the United States Health Care Financing Administration (HCFA), now known as the Centers for Medicare and Medicaid Services (CMS), implemented a version of the RUG-III algorithm that reduced the number of groups in the Clinically Complex category in favor of additional Special Rehabilitation groups for patients receiving at least 720 minutes per week of rehabilitation therapies. 12 This version of the algorithm also introduced a concept called “index maximization,” wherein patients who qualify for more than 1 RUG-III group are assigned to the highest-weighted group by payment index rather than to the highest group in the hierarchy. 12 In addition to the 44-group RUG-III algorithm used for Medicare programs, a 34-group variant has been created for use by Medicaid programs. In this variant, patients that qualify for the Special Rehabilitation category are not grouped based on the intensity of rehabilitation therapy they receive. 13 In 2006, CMS introduced a second version of the RUG-III algorithm with 9 additional groups for patients that qualify for both Special Rehabilitation and Extensive Services categories. 14 Finally, in 2018, a variant of the RUG-III algorithm was developed with the Canadian Institute for Health Information to redefine the qualification requirements for the Extensive Services category (eg, patients with infection requiring isolation) and to reorder the hierarchy for patients in the Behavior Problems and Impaired Cognition categories. 15
A recent advancement to the RUG classification system was the development of the fourth-generation algorithm, RUG-IV, that was implemented by CMS on October 1, 2010. 16 The RUG-IV case-mix system was derived using a sample of 9766 residents from 205 nursing homes and skilled nursing facilities in 15 US states from the Staff Time and Resource Intensity Verification (STRIVE) Project. 17 Special populations including residents with severe mental illnesses, young age, AIDS/HIV, bariatric, and traumatic brain injury were oversampled as they are relatively rare but important groups. The RUG-IV algorithm expands on the 53-group variant of RUG-III with the addition of a Special Care Low category, the joining of the Impaired Cognition and Behavior Problems categories, modifications to category qualifiers and ADL Index breaks, the requirement that select services (eg, intravenous [IV] medications and dialysis) be provided while the resident is in the facility, and the division of therapy time when more than 1 resident is treated concurrently by a single therapist. In the derivation study, the 66-group RUG-IV algorithm explained 42% of the variance in wage-weighted nursing staff time and 62% of the variance in wage-weighted nursing and therapy time.
Despite the widespread use of the RUG-IV case-mix system for Medicare skilled nursing facility payment in the United States, because it relies on items that are only available on the Minimum Data Set (MDS) 3.0 assessment, it has not been adopted internationally. To date, the predictive validity of the RUG-IV algorithm when applied outside of the United States has only been evaluated once. In Ontario nursing homes and skilled nursing facilities (ie, Complex Continuing Care hospitals), RUG-IV explained 42% of the variance in total costs; however, some groups in the algorithm could not be reproduced using items from the MDS 2.0 assessment used in these settings. 18 Currently, RUG-III is used as the basis for prospective payment systems in nursing homes and post-acute care facilities in several Canadian provinces including Ontario and Alberta.
Given that RUG-III was developed in the United States, several international studies have sought to evaluate the utility of the classification system when applied in jurisdictions that differ with respect to contextual factors such as staffing patterns, care processes, and financial arrangements. For the purpose of implementing prospective payment systems, the utility of RUG-III when applied in a new jurisdiction is determined primarily by assessing the predictive validity of the algorithm to explain variance in resource use. This overview describes the international RUG-III case-mix system validation studies that have been published to date. We describe the samples and staff time measurement methodologies used in each staff time measurement study, then proceed to compare the performance of the RUG-III algorithm across care settings and jurisdictions on the basis of several measures of predictive validity. We conclude with a discussion of the limitations of these validation studies, including considerations for health system administrators who are considering implementing RUG-III case-mix system as the basis for a prospective payment system.
Methods
For this overview of the literature, MEDLINE (PubMED), Scopus, Web of Science, and Google Scholar journal indexes were searched using title/abstract keywords to identify RUG-III validation studies in post-acute, long-term care and hospital care settings. Validation studies were defined as articles describing the application of the RUG-III case-mix system algorithm to explain staff time cost measures. Secondary literature sources were obtained by reviewing citations made by the primary article and using journal indexes to retrieve relevant literature citing the primary article. Relevant articles were screened for inclusion by 2 of the authors (LT and JPH) based on the title and abstract, followed by a review of the article’s content. Articles describing previous generation RUG classification systems (ie, RUG, RUG-II, and RUG-T18) and RUG classification systems outside of post-acute and long-term care settings (ie, RUG-III/HC for use in home care settings) were excluded.
Results
Since the initial RUG-III derivation, 8 the predictive validity of the case-mix system has been assessed in 13 individual studies conducted with long-term and post-acute care populations in Canada, 18 China, 19 the Czech Republic, 20 England and Wales,6,21 Finland, 22 Italy, 23 and Korea. 24 Although the terms used describe the care settings where the validation studies were conducted are region-specific, broadly, nursing home residents were represented in 10 studies,8,13,18-23,25,26 hospital patients were represented in 3 studies,6,24,25 skilled nursing facility patients were represented in 3 studies,4,8,18 and patients in rehabilitation facilities were represented in 1 study. 27
The 44-group version of the RUG-III algorithm was used in 12 studies.4,6,8,18-21,23-27 A 22-group variant of the algorithm that omits tertiary splits for depression status and provision of nursing rehabilitation, and collapses the number of Special Rehabilitation groups to 3 was used in 1 study. 22 Two studies used the 34-group variant of the algorithm that is commonly used by Medicaid programs.13,18 One study used a 53-group variant of the algorithm which adds 9 additional groups for high-cost patients that receive both rehabilitation and treatments necessary to qualify for the Extensive Services category. 18 Finally, one study tested a non-hierarchical variant of the 44-group RUG-III algorithm where groups are not mutually exclusive. This same study tested a second “simple” non-hierarchical variant of the RUG-III algorithm where patient classification is based on qualification for a RUG-III category. 4 Table 1 provides an overview of the care settings, patient populations, and RUG-III algorithm used in each validation study.
Description of RUG-III validation study samples and staff time measurement methodologies.
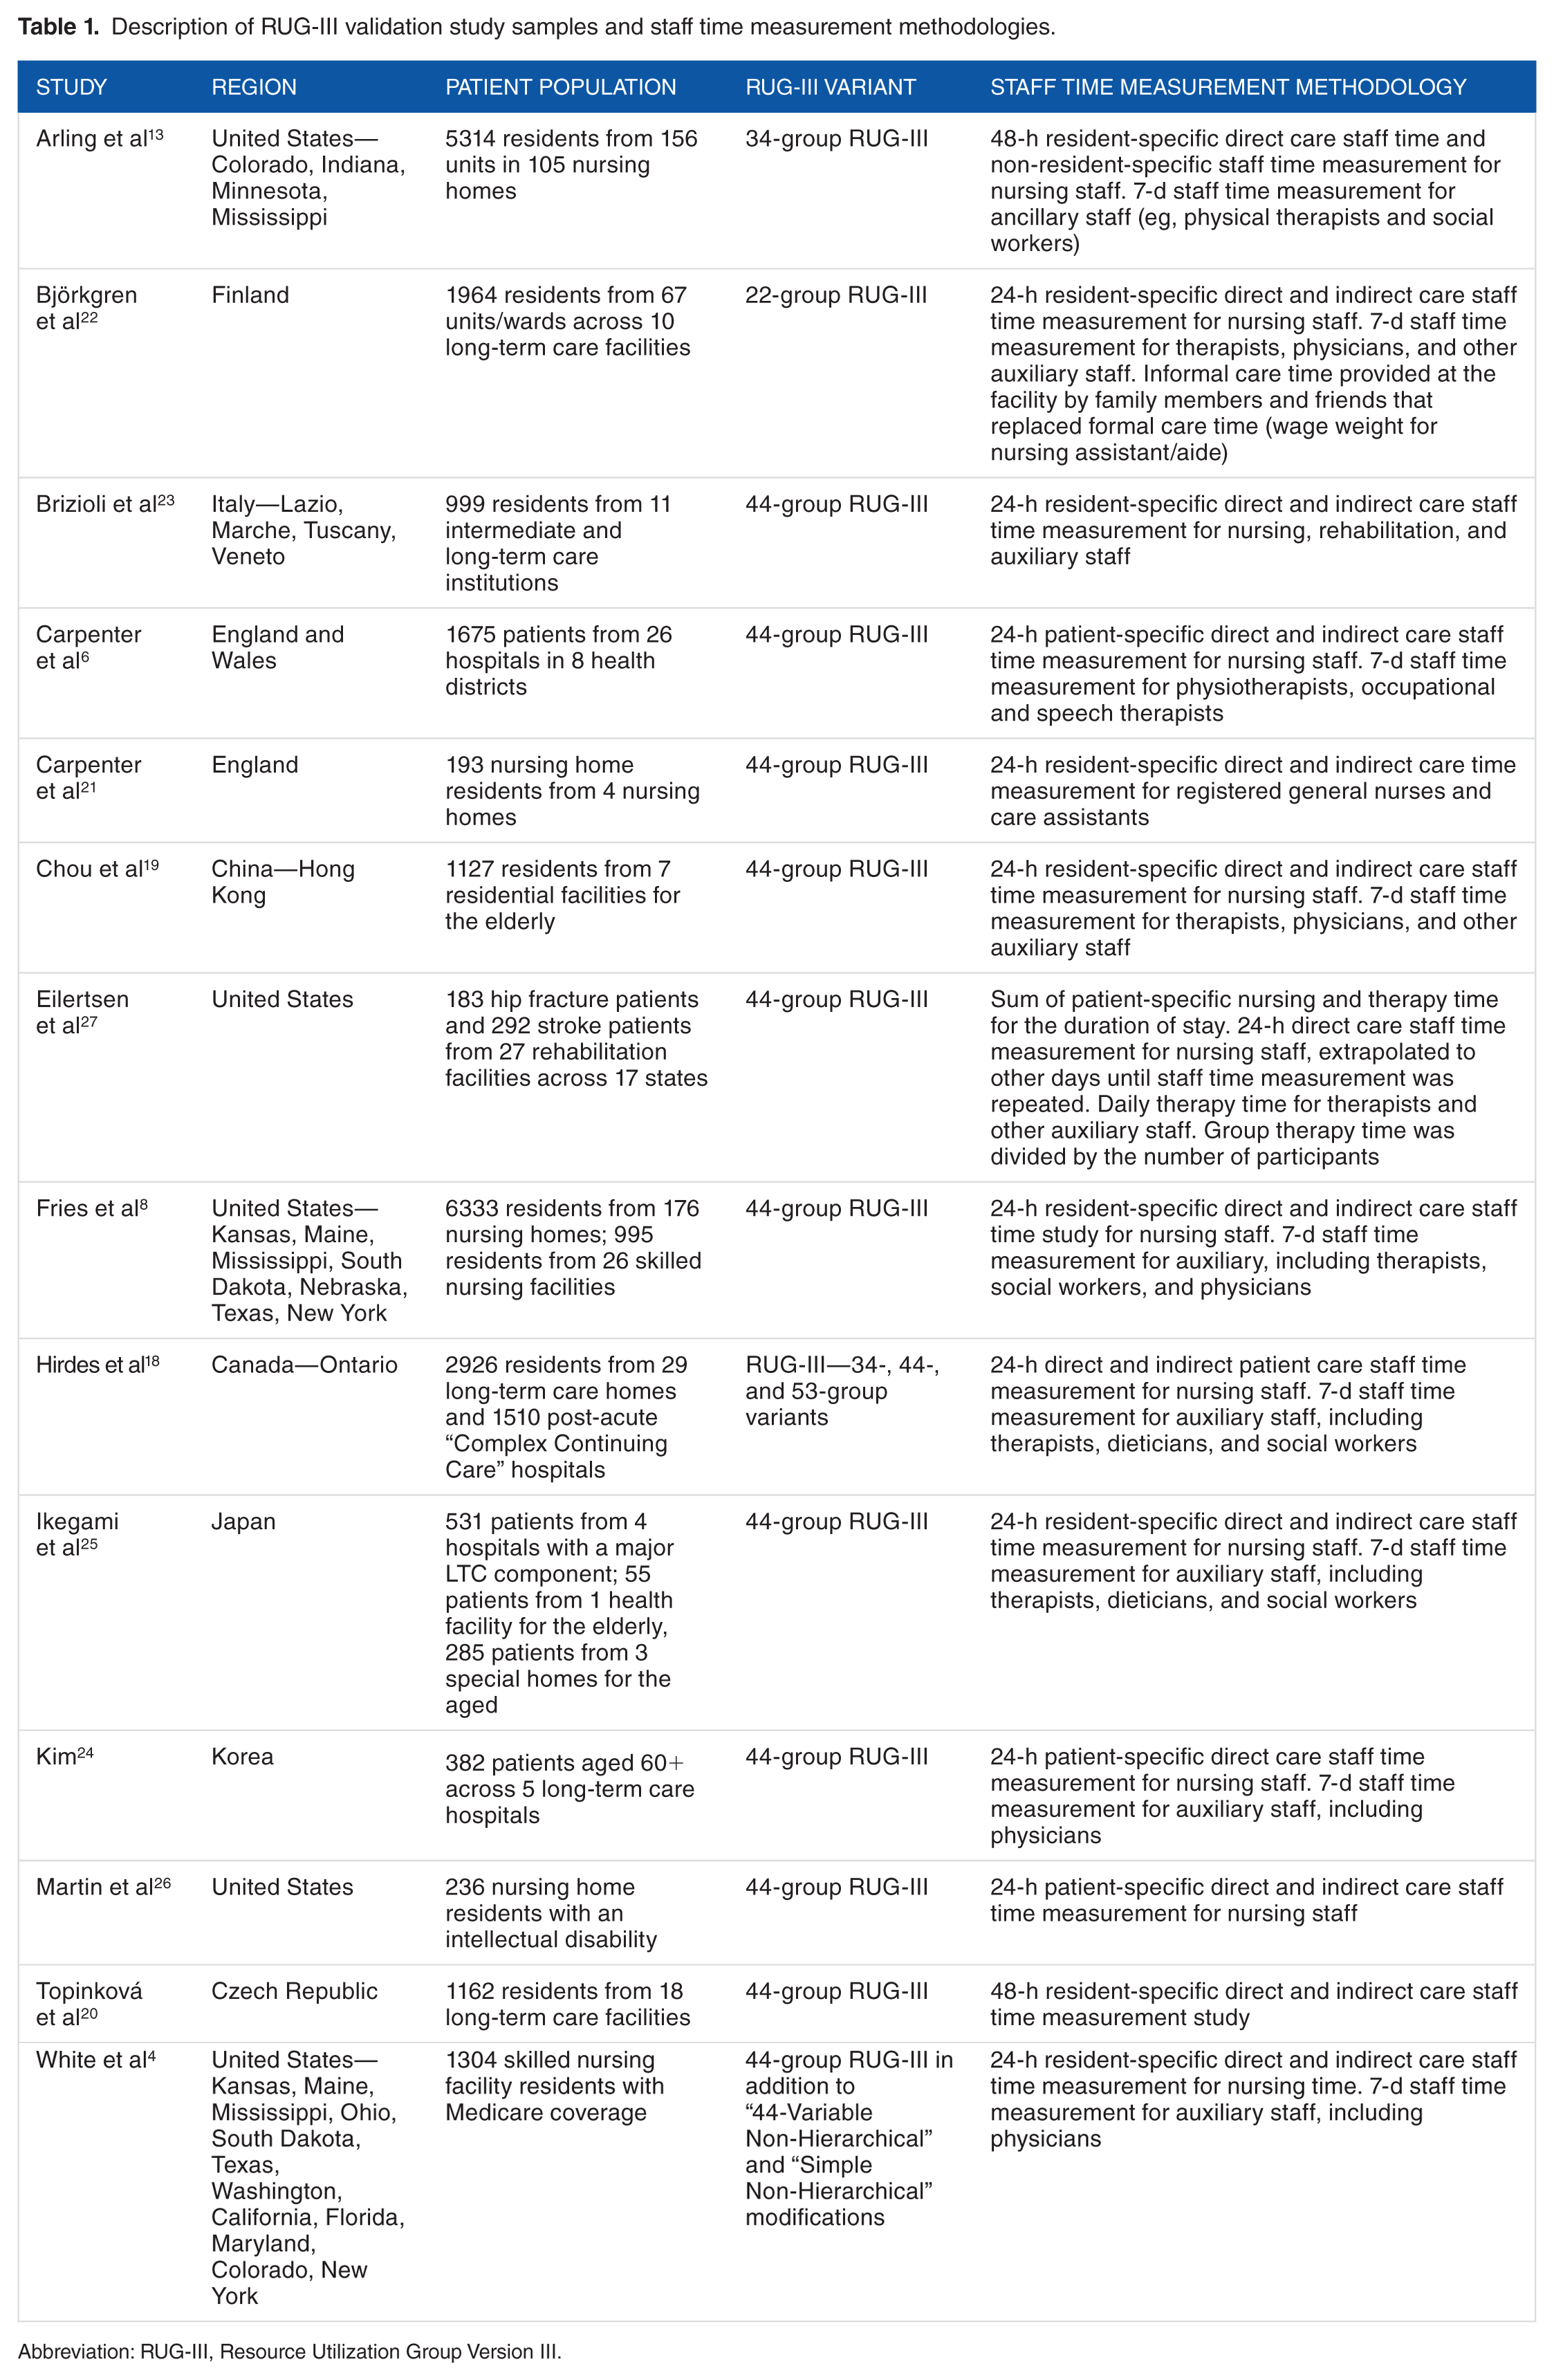
Abbreviation: RUG-III, Resource Utilization Group Version III.
Staff Time Measurement Methodology
All the RUG-III validation studies relied on nursing, therapy, and other auxiliary staff to collect their own time measurement data while delivering care. With respect to nursing staff time, 3 studies made use of hand-held computers,13,18,26 1 study used electronic wands, 4 and 3 studies used paper time sheets.6,19,21 The remainder of the studies did not specify how nursing staff time data were collected; however, it is likely that paper time sheets were used. When reported, therapy and auxiliary staff time were collected using paper logs.
Most of the validation studies employed a 24-hour resident-specific nursing staff time measurement methodology which measured both direct (ie, hands-on or bedside) care and indirect care (eg, care planning, family meetings, and physician consultation) provided by nursing staff.6,18-25 Resident-specific time refers to direct and indirect time that can be attributed to the care of a single individual. Three studies extended this observation period of resident-specific direct and indirect care time to 48 hours.8,13,26 One study allocated a uniform amount of non-resident specific nursing staff time to all patients for activities such as meetings, administration, and breaks. 4 This study measured resident-specific direct care time over a 48-hour period, but did not measure indirect care time. Another study repeated a 24-hour resident-specific direct care nursing staff time measurement each week, extrapolating this time to all other days until the next staff time measurement was performed. This was repeated throughout the episode of care, up to a maximum of 42 days of stay. 27 In one study, care provided by family members and other informal caregivers that replaced formal care time was measured and wage weighted at a rate equivalent to nursing assistants/aides. 22
Similar to nursing staff time measurement, nearly all validation studies relied on a 7-day staff time measurement for rehabilitation staff. Six studies extended this 7-day staff time measurement to auxiliary staff such as social workers and psychologists,8,13,18-20,22,25 and 5 studies measured physician time.8,19,20,22,25 One study measured rehabilitation staff time over a 24-hour period 23 and another measured daily therapy time for each day the patient was on the unit. 27 Three studies did not report or measure rehabilitation or other auxiliary staff time.21,24,26 Table 1 provides an overview of the staff time measurement methodology used in each study.
RUG-III Category Distribution
The RUG-III category distribution for each validation study is presented in Table 2. Generally, in studies conducted in nursing homes, residents were most frequently classified into Reduced Physical Functions (24.8%-61.4%), the lowest category in the hierarchy. Clinically Complex (10.9%-42.2%) was the next most frequently populated category. Conversely, the Behavior Problems (0.4%-9.7%) and Extensive Services (0.1%-10.9%) categories were the most sparsely populated in the nursing home studies.8,13,18-23,25,26 There was substantial variation in the proportion of residents classified into the Special Rehabilitation category across studies. For example, in 2 studies, nearly one-third of residents were classified as Special Rehabilitation,20,23 whereas in 3 other studies, fewer than 2% of residents were classified into this category.19,21,24 In the validation studies conducted in hospitals, a large proportion of patients (19.0%-46.3%) were classified into the Clinically Complex category. In 2 studies, nearly half of patients were classified into the first 3 RUG-III categories,6,25 whereas in the other hospital study, no patients were classified into those categories. 24 All patients in the study conducted in inpatient rehabilitation facilities qualified for the Special Rehabilitation category. 27
Distribution of RUG-III categories across validation studies.

Abbreviation: RUG-III, Resource Utilization Group Version III.
Nursing home and skilled nursing facility patients presented as a combined sample.
Explained Staff Time Variance
The proportion of the variance in wage-weighted staff time that is explained by the case-mix system is commonly used to assess the predictive validity of the algorithm in a given care setting or jurisdiction. Wage-weighted staff time is calculated by multiplying staff time utilization for each provider type (eg, registered nurse, licensed practice nurse, and physical therapist) by their wage rate. Given that staff time measurement studies only measure actual staff time allocation, wage-weighted staff time measures across different validation studies can be compared directly without the need to adjust for factors such as jurisdiction-specific staffing regulations and practice patterns. For the purposes of implementing a prospective payment system, greater explained variance is desired and provides some indication of the external validity of the algorithm when applied in a different health care environment.
Among the studies conducted in nursing homes, the RUG-III algorithm explained 14% to 65% of the variance in total wage-weighted staff time8,18-20,22,23,25 and 27% to 56% of wage-weighted nursing staff time.8,18,19,21,23,26 One study reported explained variance for wage-weighted rehabilitation staff time separately, where the RUG-III algorithm explained 65% of rehabilitation staff time. 23 Similarly, another study reported explained variance for the 34-, 44-, and 53-group variants for RUG-III using the nursing home portion of their sample. 18 The 34-group variant explained 16.5% of the variance in wage-weighted rehabilitation staff time, whereas the 44- and 53-group variants improved the explanatory power to 27.0%. One study reported explained variance for wage-weighted staff time separately for licensed and unlicensed health professionals separately. 13 In this study, the RUG-III algorithm explained 20% of the variance in wage-weighted staff time for licensed health professionals and 23% of wage-weighted staff time for unlicensed health professionals. 13
Among patients in skilled nursing facilities, RUG-III algorithm explained 20.6% to 40.1% of the variance in wage-weighted total staff time and 47.6% to 66.5% of the variance in wage-weighted rehabilitation staff time (Table 3). 4
Proportion of staff time variance explained by RUG-III and CMI range and sub-sample mean.

Abbreviation: CMI, Case-mix Index; RUG-III, Resource Utilization Group Version III.
Nursing home and skilled nursing facility patients presented as a combined sample.
In addition to measuring wage-weighted staff time, this study estimated total per diem cost using Medicare claims to estimate non-therapy ancillary costs such as diagnostic services, supplies, and prescription drugs. Overhead costs estimated from the United States Federal Reimbursement Rate were also added to the cost measure. RUG-III algorithm explained 10.4% of the variance in total costs for Medicare patients, whereas the 44-Variable Non-Hierarchical and Simple Non-Hierarchical variants of the algorithm explained 24.9% and 21.1%, respectively. 4 For patients in rehabilitation facilities, the RUG-III algorithm explained 11% of the variance in total staff time, 11% of the variance of nursing staff time, and 14% of the variance in rehabilitation staff time. 27 Finally, among hospital patients, RUG-III explained 33.4% of wage-weighted total staff time. 6 The other validation studies conducted in hospitals either did not report explained staff time variance 24 or did not report it separately for the hospital portion of their sample 25 (Table 3).
Coefficient of Variation
Outside of the RUG-III derivation study, 5 studies reported the coefficient of variation (σ / μ) for wage-weighted staff time to describe the homogeneity of resource use within case-mix groups.6,8,19,20,22,23 This statistic is used instead of the standard deviation for the mean wage-weighted staff time for each case-mix group because the standard deviation for a mean generally increases proportionally with the mean. The coefficient of variation standardizes the standard deviation of the mean, which allows the variability of resource within RUG-III groups to be compared directly, regardless of the magnitude of the mean staff time measure for a given group. A low coefficient of variation across all RUG-III terminal groups is desirable as it indicates that there is little resource use variation within groups for a broad range of patient types.
Across RUG-III groups, the coefficient of variation was lowest in the Italian nursing home study, where it was less than 0.5 for all 44 RUG-III groups. 23 The algorithm performed similarly in the Czech Republic nursing homes where the mean coefficient of variation between groups was 0.5. 20 In comparison, the mean coefficient of variation among residents in Hong Kong nursing homes was 1.17 and ranged between 0.83 and 4.63 among groups that contained at least 10 residents. 19 The mean coefficient of variation was 0.65 for the 22-group variant of the algorithm applied in Finnish nursing homes, with 9 groups scoring less than 0.5 on the metric. 22 Finally, among hospital patients, the mean coefficient of variation was 0.60. Three-quarters of the RUG-III groups in this study had a coefficient of variation less than 0.5. 6
Case-mix Index
Case-mix Index (CMI) is a numerical representation of the resource intensity of 1 RUG-III group relative to another. 1 For each validation study, a figurative “average case,” based on the mean wage-weighted staff time of the entire study sample, is assigned a CMI value of 1.0. A group that consumes 50% more resources than the average case is assigned a CMI of 1.5, whereas one that consumes 50% fewer resources than the average case is assigned a CMI of 0.5.26,28 One study reported that the mean CMI was highest for patients in hospitals (1.10-1.27), followed by homes for the aged (0.73), and health facilities for the elderly (0.73). 25 Similarly, another study reported the mean CMI for the nursing home and skilled nursing facility portions of their sample separately. 18 The mean CMIs were 0.651 and 1.008, respectively. Among the validation studies conducted in nursing homes, there was a 3.5- to 7.2-fold difference between the least and most resource intensive groups.8,18-20,22,23 Among studies completed in hospitals, there was a 1.8- to 4.2-fold difference between groups.6,24 Table 3 presents an overview of the CMI range and mean for each validation study.
In addition to the derivation study, 8 4 validation studies published CMI values for each of the groups in the 44-group variant of the RUG-III system.18-20,23 The CMI values across all 4 validation studies were strongly correlated (Pearson | R2 = 0.85 − 0.92 with the derivation study and followed a similar “sawtooth” pattern. However, compared with the derivation study, cost weights for common RUG-III groups, especially in the Special Rehabilitation and Extensive Services categories, were generally lower in Italian nursing homes, 23 Czech nursing homes, 20 and Canadian nursing homes and skilled nursing facilities 18 (Figure 1).

Comparision of RUG-III group and case-mix index (CMI) values by validation study.
Discussion
The RUG-III case-mix classification system is a widely implemented method of grouping individuals in post-acute and long-term care settings. In part, this is because the patient characteristics and provision variables that are used in the algorithm are collected as part of routine comprehensive clinical assessment using the MDS 2.0 assessment and the interRAI suite of instruments that are applicable to these care settings. In addition to case-mix classification, these instruments are used for patient care planning, outcome measurement, and health system performance measurement.29-32
Since its initial derivation, many studies have evaluated the utility of the RUG-III case-mix classification system in multiple different patient populations, care settings, and countries around the world. These validation studies employed similar staff time measurement methodologies and reported on the explanatory power of the algorithm using either total, nursing-specific, or rehabilitation-specific staff time cost measures. Although the proportion of the variance in resource use that is explained by the algorithm varied across studies, in most environments, the explanatory power of the algorithm did not differ substantially from the derivation study. 8 Based on this criterion, RUG-III and other next-generation RUG systems are likely to have utility as the basis of prospective reimbursement of nursing and other auxiliary staff time costs in most post-acute and long-term care settings outside of the United States.
The RUG-III case-mix system has been criticized because the algorithm that groups patients into the Special Rehabilitation category is “self-evident” in its explanation of staff time variance. 6 This is because patients are grouped based on the amount of therapy that is provided, as opposed to need for rehabilitation. 25 In effect, RUG-III acts as a fee-for-service pass-through for rehabilitation reimbursement in prospective payment systems. The merits of this approach have been discussed elsewhere8,11,33,34; however, this aspect of the RUG-III algorithm also has implications when evaluating the predictive validity of the case-mix system for a given health care environment. RUG-III validation studies where a large proportion of the sample is classified into the Special Rehabilitation category are expected to explain a greater proportion of total wage-weighted staff time variance. This is because a large proportion of the costs associated with caring for a patient receiving rehabilitation are built directly into the classification system. For example, excluding Special Rehabilitation patients in 1 validation study resulted in a 29% reduction in explained variance for resource use. 6
When comparing nursing home RUG-III validation studies with comparable staff time measurement methodologies, a positive relationship between the proportion of the validation sample that is classified as Special Rehabilitation and RUG-III’s explanatory power is observed.18,19,20,23,25 Because RUG-III was designed to accommodate a broad range of patients in long-term care settings, when implemented in specific care settings, certain groups, especially those in the Special Rehabilitation category, may be sparsely populated and result in less stable group cost weight estimates. For example, in the sample used by 19, the 44-group version of the RUG-III algorithm only explained 14.1% of the variance in wage-weighted total staff time because 1.8% of the sample was represented in the Special Rehabilitation category. Two studies accounted for this issue with nursing home populations that are unlikely to receive rehabilitation therapy using collapsed 22- and 34-group versions of the RUG-III algorithm which reduce the number of Special Rehabilitation groups.13,22 Although Finland is the only country to use the 22-group variant of the algorithm,22,35 the 34-group algorithm is more widely used in Canadian nursing home populations.
Because classification into Special Rehabilitation category is based on rehabilitation inputs, nearly all patients in inpatient rehabilitation 27 and skilled nursing facilities 4 are expected to be classified into first 14 groups in the RUG-III hierarchy. For example, in one sample, 92% of patients were classified into the “Very High” and “Ultra High” Special Rehabilitation levels. 27 Homogeneous samples limit the explanatory power of the algorithm in these care settings because correlation estimates between RUG-III groups and staff time costs are attenuated when the sample is distributed among a limited number of case-mix groups. Because of the samples used in these validation studies, inferences about the predictive validity of RUG-III in these rehabilitation-focused care settings should be avoided. Jurisdictions wishing to implement the RUG-III case-mix system as the basis for a prospective payment in inpatient rehabilitation and skilled nursing facilities where most of the patients receive rehabilitation therapy may account for this scenario by deriving cost weights using a broader sample of patients that represent the range of patients typically seen in post-acute and long-term care facilities.
Given that RUG case-mix classification systems are derived using staff time measurement studies, the relative wage-weighted resource intensity of each group is based on observed practice patterns as opposed to “best practice.” In the case of the RUG-III derivation study, potential poor-quality facilities were excluded from the sample in an effort to ensure that group weights (ie, CMIs) were based on reasonable resource allocation patterns. In addition, many facilities across numerous US states were included in the sample to reduce the influence of facility and region-specific practice patterns. 8 As highlighted by Bowblis and Brunt, 36 there are a lack of clear treatment guidelines in nursing home and post-acute care facilities, allowing providers some discretion when allocating therapy time. Given that classification within the Special Rehabilitation category is partly based on therapy intensity process measures, there is some evidence to suggest that providers may exploit this feature of the algorithm to increase revenue.36,37
The RUG-III derivation study implemented several processes, including structured training, unit pilot testing, daily shift audits, and a 24-hour support telephone line, to ensure that staff time was collected reliably. 8 Across the 13 validation studies, the reliability of the staff time measure used to assess the predictive validity of the RUG-III algorithm was only reported by 1 study, 6 where discrepancies between total and recorded time were found in 30% of the nursing time sheets. Some studies sought to reconcile total shift time with patient and non-patient-related time6,21; however, one study 27 found that only direct patient time could be recorded reliably. Based on this finding, they excluded indirect patient time from their cost measure. Staff time measurement studies are both costly and burdensome. Therefore, most studies constructed their staff time cost measure based on only a 24- or 48-hour observation period for nursing staff, which may be easily influenced by performance bias. Unfortunately, none of the validation studies that measured staff time over a 48-hour period reported the extent to which staff time varied between days.4,13,26 Some more recent validation studies used electronic devices to measure staff time4,18,26; however, it is unknown whether these tools increase the reliability of the staff time measurement by reducing self-report bias.
Similarly, just as providers may attempt to increase rehabilitation intensity during assessment periods to influence classification into Special Rehabilitation RUG-III groups, it is unclear to what extent the intensity of rehabilitation therapy that was provided during the staff time measurement study differed from the remainder of the episode of care. The RUG-III case-mix system is designed to classify patients by relative per diem resource use, and although resource use is expected to vary over a patient’s episode of care, 28 providers implementing case-mix classification systems for the purposes of prospective reimbursement are required to balance patient reassessment burden with the accuracy of resource use measures over the length of stay.
Although many validation studies evaluated the inter-rater reliability of the MDS 2.0 assessment items used in the RUG-III algorithm,6,19,22,23,25 only select studies reported the difference in time between the staff time measurement study period and patient assessment for case-mix classification. When reported, this gap ranged between 7 days and 4 weeks6,13,21,23; however, the rehabilitation intensity portion of the classification is based on rehabilitation provided during the staff time measurement period. This means that patients are classified into the Special Rehabilitation RUG-III category on the basis of information collected during the staff time measurement study, whereas all other patients are classified based on previous or future health status. Future validation studies should seek to measure patient characteristics as close to the staff time measurement period as possible to ensure that cost weights are based on current patient status.
Conclusions
This review of international validation studies of the RUG-III case-mix system indicates that the algorithm explains a similar amount of variance in resource use as the derivation study in most post-acute and long-term care settings is outside of the United States. Based on descriptions of the methods used in these studies, the methodological quality of these staff time measurement studies was reasonable. However, it was difficult to assess the accuracy of the cost measures used to evaluate the predictive validity of the algorithm and some studies used relativity homogeneous samples which attenuated the explanatory power of the algorithm. Health system administrators that are considering implementing RUG-III as the basis for a prospective payment system should be aware of the limitations of these validation study limitations when surveying the case-mix literature.
Footnotes
Funding:
The author(s) received no financial support for the research, authorship, and/or publication of this article.
Declaration of conflicting interests:
The author(s) declared no potential conflicts of interest with respect to the research, authorship, and/or publication of this article.
Author Contributions
LAT and JPH screened relevant articles for inclusion. LAT wrote the manuscript. JPH, JP and BF provided critical feedback. All authors have read and approved the final manuscript.