
Abstract
Background:
The number of yearly emergency department (ED) visits by older adults in the United States has been increasing.
Purpose:
The objectives were to (1) describe the demographics, health-related variables, and ED visit characteristics for community-dwelling older adults using an urban, safety-net ED; (2) examine the association between demographics, health-related variables, and ED visit characteristics with emergent vs nonemergent ED visits; and (3) examine the association between demographics, health-related variables, ED visit characteristics, and ED visit costs.
Methods:
A cross-sectional, retrospective analysis of administrative electronic medical record and billing information from 2010 to 2013 ED visits (n = 7805) for community-dwelling older adults (⩾65 years old) from an academic medical center in central Virginia was conducted.
Results:
Most of the ED visits were by women (62%), African Americans (75%), and approximately 50% of ED visits were nonemergent (n = 3871). Men had 1.2 times the odds of an emergent ED visit (95% confidence interval [CI]: 1.02-1.37). The ED visits by white patients had 1.3 times the odds of an emergent ED visit (95% CI: 1.09-1.57) and 14% higher costs (white race: 95% CI: 1.07-1.21) compared with African American patients. Emergent ED visits were 60% more likely to have higher costs than nonemergent visits (95% CI: 1.52-1.69). White race and arrival by ambulance were associated with both emergent ED visits and higher total ED visit costs in this sample of ED visits by community-dwelling older adults.
Conclusions:
Strategies to maximize opportunities for care in the primary care setting are warranted to potentially reduce nonemergent ED utilization in community-dwelling older adults.
Introduction
There has been an increasing trend in the number of yearly emergency department (ED) visits by older adults in the United States.1–3 Studies have shown a 25% to 34% increase in older adult ED visits over time.1,2 From 2012 to 2013, a total of 20.7 million ED visits were made by older adults, corresponding to an ED visit rate of 36 per 100 persons for illness and 12 per 100 persons for injury. 4 Age ⩾85 years, living alone, poor to very good self-rated health compared with excellent, and deficiencies in activities of daily living were predictors of older adult ED use. 5
Some ED visits and their associated costs may be preventable for conditions that are treatable by effective and timely primary care.6–8 In a group of high-cost Medicare patients, 43% of 2009 and 2010 ED visits were classified as preventable and accounted for about 40% of the total ED costs. 9 Preventable and frequent ED use is a concern due to the potential for increased adverse outcomes after each visit, potential for care to be more appropriately delivered in a primary care setting vs an ED, and increased costs associated with unnecessary ED visits.
Frequent ED use (⩾4 ED visits per year) has been reported to be concentrated in a small number of older adults who may have multiple chronic conditions and social barriers that limit access and coordination of care.10–13 Poor self-reported health, history of a recent ED visit, diabetes, depression, 9 or more medications, no help if needed, male, African American race, and Hispanic ethnicity have been identified as predictors of frequent ED use in older adults.13–16
However, there is a lack of information regarding frequent ED use and associated costs by older adults residing in health care hot spots. A health care hot spot is an emerging concept around the existence of geographic areas of high health care use. 17 In these areas, costs are often related to a small number of patients.17 –19 For example, in Camden, New Jersey, it was found that 30% of health care costs were associated with the care of 1% of the patients and 90% of the costs with 20% of the patients. 19 Likewise, a study in high-cost older adult Medicare beneficiaries found that 55% of the Medicare costs were associated with 10% of the beneficiaries. 20
This study adds to the evidence around community-dwelling older adult’s ED use, specifically examining if living in low-income housing, designated as a health care hot spot in this study, is a predictor of ED use. We used the validated New York University ED (NYU ED) algorithm to classify ED visits by International Classification of Diseases, Ninth Revision, Clinical Modification (ICD-9-CM) diagnosis codes into emergent and nonemergent visits. 21 The objectives and hypotheses for this study were as follows:
Describe the demographics, health-related variables, and ED visit characteristics for community-dwelling older adults using an urban, safety-net ED.
Examine the association between demographics, health-related variables, and ED visit characteristics with emergent vs nonemergent ED visits. We hypothesized that older adults were more likely to have an emergent ED visit if they lived in a health care hot spot, had higher comorbidity scores and increasing age, and arrived to the ED by ambulance.
Examine the association between demographics, health-related variables, ED visit characteristics, and ED visit costs. We hypothesized that higher costs were more likely in older adults who lived in a health care hot spot, had higher comorbidity scores and age, arrived to the ED by ambulance, and had an emergent ED visit.
Methods
Study design and data source
A cross-sectional, retrospective analysis of administrative electronic medical record data and billing records from an urban, safety-net, level 1 trauma, academic medical center that treats more than 80 000 ED patients annually, in central Virginia, was conducted. The ED visit information from 2010 to 2013 for community-dwelling older adults (⩾65 years old) was included in this study. Data were abstracted from the electronic medical and billing records by the institution’s Biomedical Informatics Core.
To determine community-dwelling status, ED visits were excluded based on the following criteria: address not indicative of a community-dwelling residence (eg, skilled nursing facility or assisted living facility), address corresponded to a correctional facility, if admit source or mode was a transfer from another health care facility (eg, another hospital) or court/law enforcement, if address was not complete and community-dwelling status could not be confirmed (eg, only provided an apartment number, PO Box, trailer number, or missing), and if address indicated that the patient was under the care of another entity (eg, c/o individual or business name).
Outcome variables
ED visit type
The first dependent variable examined in this study was type of ED visit categorized by the NYU ED algorithm.9,21 The NYU ED algorithm assigns the ICD-9-CM diagnosis code for the ED visit a probability (0-1) of falling into the following 4 ED visit types: nonemergent, emergent but primary care treatable, emergent ED care needed but preventable/avoidable, or emergent ED care needed not preventable/avoidable (Figure 1). 22

These probabilities were then used to categorize ED visits into nonemergent, emergent, and intermediate ED visit types. 22 An ED visit was categorized as nonemergent if the sum of nonemergent plus emergent, primary care treatable probabilities were >0.50. The ED visit was categorized as emergent if the sum of emergent, ED care needed, preventable/avoidable plus emergent, ED care needed, not preventable/avoidable probabilities were >0.50. An ED visit was categorized as intermediate if both nonemergent and emergent probabilities were equal to 0.50. 22 The NYU ED algorithm excludes (does not assign probabilities) mental health, alcohol, substance abuse, injury, and unclassified ED visits. 21
Total ED visit costs
The second dependent variable examined was total ED visit cost (billing costs) adjusted to 2014 US dollars (US $). Costs were adjusted for inflation using the consumer price index for Medical Care Services and reported in 2014 dollars. 23 The method provided by the US Department of Labor, Bureau of Labor Statistics was used for adjustment. 24
Covariates
Demographics
Demographics included in this study were age, sex, race, and ethnicity. Age was categorized by its quartile distribution (65-67, 68-71, 72-78, and 79 years and older) and sex was dichotomous (men vs women). Race categories were white, black or African American, Asian, Other, and Unknown. Due to small sample size, American Indian/Alaskan, Native Hawaiian/Other Pacific Islander, and Asian were collapsed into the Other race category. Ethnicity categories were Hispanic-Latino-Spanish Origin, Not Hispanic-Latino-Spanish Origin, and Unknown. Variables with responses of unknown were considered missing.
Payment source
Payment source was defined as Medicare, Medicaid, Medicare and Medicaid, Medicare and Other, Self-pay, Virginia Coordinated Care Program (VCC), Indigent, and Other.
Health-related variables
The Charlson Comorbidity Index (CCI) was used as a measure of comorbidity. 25 The Dartmouth-Manitoba (Romano) CCI adaptation which incorporates ICD-9-CM codes for identifying comorbid conditions was used. 26 Patient problems in the data were defined either as ICD-9-CM or Systematized Nomenclature of Medicine-Clinical Terms (SNOMED CT) code. The SNOMED CT codes were converted to a corresponding ICD-9-CM code using the Unified Medical Language System (UMLS) cross map. 27
The CCI scores were categorized into 5 categories based on the variable’s distribution: 0, 1, 2, 3, or ⩾4. The total disease count variable was created from the sum of the ICD-9-CM codes per ED visit. Total disease count was categorized into quartiles for analysis. The quartile (Q) distribution for the total disease count was 1 to 3 (Q1), 4 to 6 (Q2), 7 to 9 (Q3), and ⩾10 diseases (Q4).
ED visit characteristics
The mode of arrival to the ED was defined as ambulance (emergency medical services [EMS]), helicopter, and self-private transportation.
Discharge disposition was defined as follows: home or self-care, expired, left against medical advice (AMA), left before clinical evaluation, and other facility/nursing home.
A dichotomous variable was created to identify ED visits from the zip code including a health care hot spot (yes/no). This was the zip code that included the address of the low-income, subsidized housing apartment building identified as a health care hot spot.
A dichotomous variable was created to identify ED visits from the address of the low-income, subsidized housing apartment building in this study. It was considered a health care “hot spot” (ie, geographic area of high health care utilization) due to a history of high use of ambulance services and ED for primary care. 28 The variable was defined as yes/no.
The year of ED visit was categorical and defined as 2010, 2011, 2012, and 2013. The total number of visits per unique medical record number by year was determined. The inclusion of this variable helps examine the relationship of frequent ED use with total ED costs and helps to characterize whether frequent ED users are more likely to have emergent vs nonemergent ED visit. A frequent ED user was defined as having 4 or more ED visits29–32 over any one year in the study (yes/no).
Data analysis
Descriptive statistics, bivariate analyses, and multivariable regression analyses were used. The small number of intermediate ED visits (n = 115) limited their inclusion in multivariable analyses. An adjusted prediction multivariable logistic regression model was used to examine the relationship between demographics (age, sex, race, ethnicity), payment source, health-related variables (CCI, total disease count), hot spot zip code, hot spot address, and ED visit characteristics (mode of arrival, frequent ED use, year of ED visit) with emergent vs nonemergent ED visits (reference group). For emergent and nonemergent ED visits, race unknown, ethnicity unknown, admit mode by helicopter, discharge disposition, left before clinical evaluation/expired/other facility/nursing home was considered missing (cell size <5 or unknown). The variable discharge disposition was collinear with total disease count and removed from the full multivariable logistic regression model. After removal of this variable, multicollinearity was not a problem (variance inflation factors <4, correlation <0.8).
Analysis of variance was used to examine differences between mean total ED visit costs by demographic and ED visit characteristic variables. Adjusted generalized linear model (GLM) regression with gamma distribution and log link was used to model the relationship with the independent variables (age, sex, race, ethnicity, payment source, CCI score, total disease count, mode of ED arrival, discharge disposition, frequent ED user, year of ED visit, hot spot zip code, hot spot address, type of ED visit) and total ED costs.
The dependent cost variable was assessed for skewness, kurtosis, normality, and heteroscedasticity in the nonemergent and emergent ED visits. The data indicated that total costs were skewed to the right (skewness: 2.71, kurtosis: 29.61, n = 5050). The assumption of normality was violated (n = 5050, Kolmogorov-Smirnov, P < .010). The histogram of the cost variable also showed a nonnormal distribution and the q-q plot showed 5 extreme outliers. The 5 extreme observations were deleted from the data and skewness, kurtosis, normality, and heteroscedasticity was reassessed. The skewness and kurtosis were improved (1.30 and 1.37, respectively) but the data were still not normally distributed (n = 5045, Kolmogorov-Smirnov, P < .010, histogram appearance skewed) or homoscedastic (White test for heteroscedasticity P = .003). Next, log transformation of the total costs was performed. There were 253 ED encounters with zero cost (5% of study sample). The appearance of the cost histogram was improved. However, the normality and equal error variance assumptions were still violated (n = 4792, Kolmogorov-Smirnov, P < .010 and White test for heteroscedasticity, P < .0001). This was accounted for in the final GLM regression with a gamma distribution and log link. The GLM does not require normal distribution of the cost data and can correct for heteroscedasticity (unequal error variance).33–35 The 5 extreme cost outliers, zero costs, unknown race and ethnicity category, admit mode by helicopter, and discharge disposition categories of other facility/nursing home and expired were considered missing in the final model. Multicollinearity was assessed and not a concern in this model. The a priori significance level was P < .05. SAS for Windows version 9.4 was used for data analysis (SAS Institute Inc., Cary, NC, USA). This study was approved by the local institutional review board.
Results
The flow chart provides the number of ED visits excluded based on address, admission source, admission mode, discharge disposition, and duplicate records (Figure 2). A total of 7805 ED visits were included in this study for descriptive statistics. Intermediate ED visits (n = 115, 1.5%) were not included in multivariable analyses due to small sample size. The remaining approximate 34% of NYU ED visits classifications not included in additional analyses were injury (n = 1274, 16.3%), mental health related (n = 124, 1.6%), alcohol or drug related (n = 26, 0.4%), and not in a special category, not classified (n = 1216, 15.6%).

Flow chart for inclusion of ED visits.
Table 1 provides descriptive statistics for demographic and ED visit characteristics and compares nonemergent and emergent ED visits. The overall mean age was 73 years (SD 7.1) for all ED visits. Most of the ED visits were by women (62%), African Americans (75%), and non-Hispanic-Latino-Spanish origin patients (98%). Approximately 50% of ED visits were classified as nonemergent (n = 3871) and 15% were classified as emergent (n = 1179). Emergent ED visits had a higher proportion of men, higher CCI score, arrived by ambulance more often, more frequent ED users, and had higher total ED visit costs than nonemergent ED visits. Table 2 provides the 10 most common primary diagnosis codes for emergent and nonemergent ED visits.
Demographics, health-related variables, and ED visit characteristics of adults ⩾65 years old.

Abbreviations: ED, emergency department; EMS, emergency medical services.
P value for bivariate analyses: χ2 (categorical variables) or t test (continuous variable) between nonemergent and emergent ED visit, *P < .05.
For emergent and nonemergent ED visits race unknown, ethnicity unknown, admit mode by helicopter (cell size <5), for Asian (n = 29 for nonemergent ED visits and n = 4 for emergent ED visits—collapsed into other category).
Some payment source categories were collapsed due to small sample size. There were n = 5 ED visits with Medicaid, Other and n = 2 ED visits with Medicaid, Tricare collapsed into the Medicaid payment source category, n = 2 ED visits with Medicare, Medicaid, Other payment source collapsed into the Medicare, Medicaid category, n = 9 ED visits with Medicare, Tricare collapsed into the Medicare, Other category, and n = 3 ED visits with Tricare/VA only collapsed into the Other category.
Costs rounded to nearest dollar.
Top 10 primary diagnosis codes for emergent and non-emergent ED visits in adults ≥ 65 years old.

NEC = not elsewhere classifiable, NOS = not otherwise specified.
Predictors of Emergent ED Visits
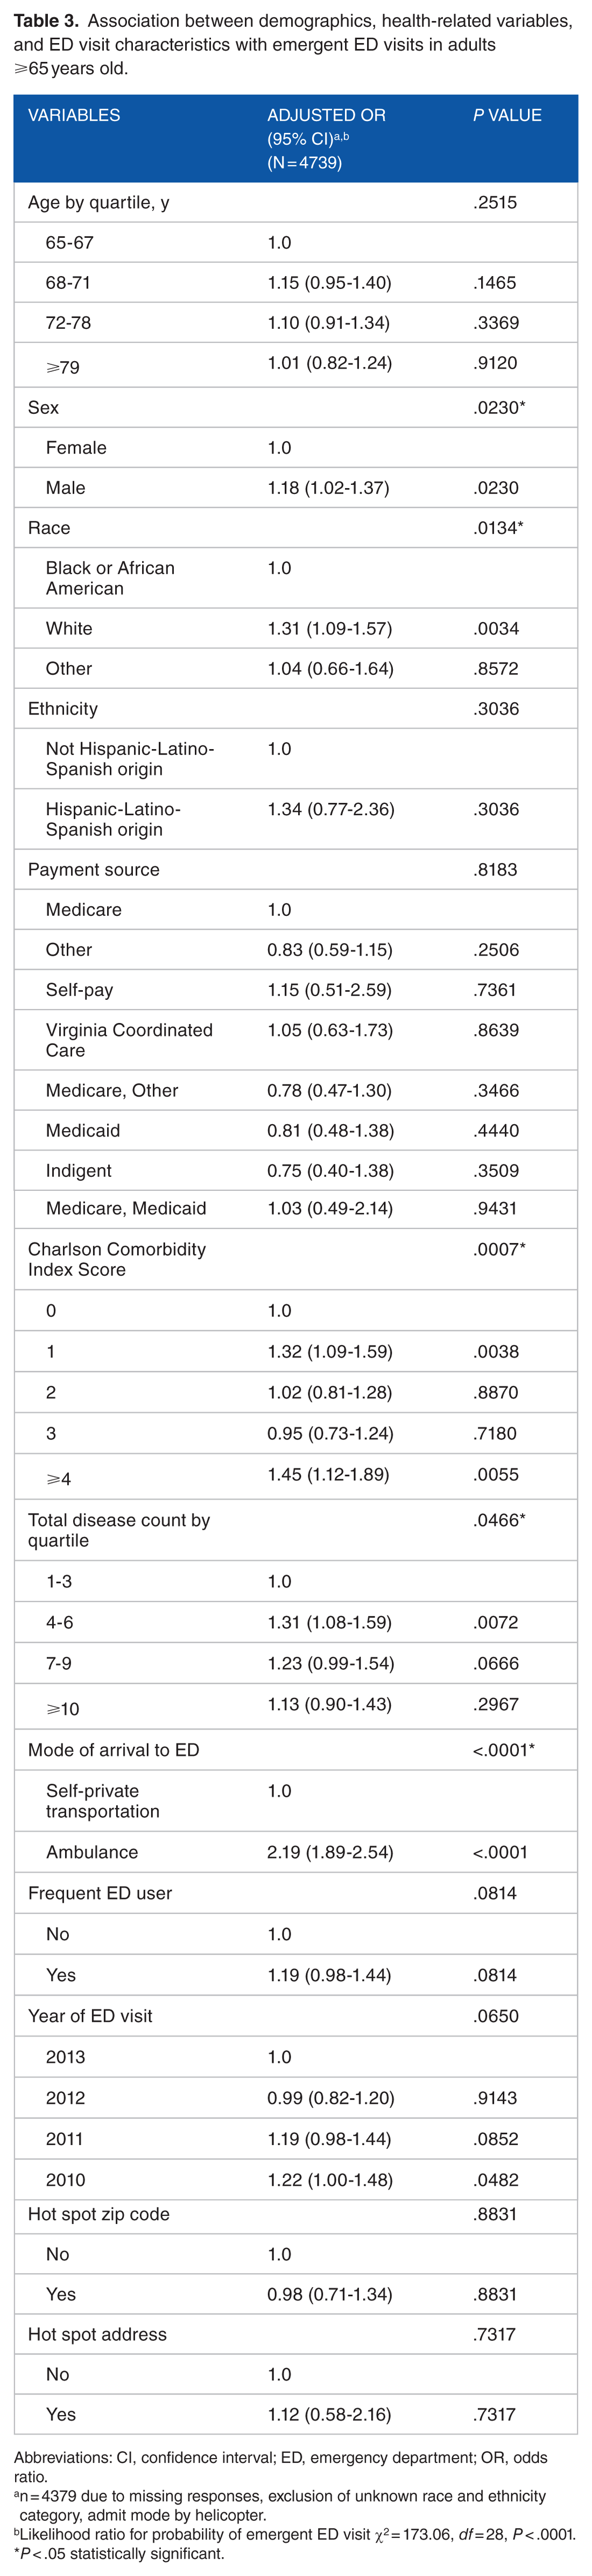
The results of the adjusted multivariable logistic regression analysis (adjusted OR, 95% CI) are summarized in Table 3. Sex, race, CCI score, total disease count, and mode of arrival to the ED were significant independent predictors of emergent ED visits. Men had 1.2 times the odds of an emergent ED visit compared with women (adjusted odds ratio [AOR]: 1.18, 95% CI: 1.02-1.37). The ED visits by white patients had 1.3 times the odds of an emergent visit compared with African American patients (AOR: 1.31, 95% CI: 1.09-1.57). A CCI score of ⩾4 compared with 0 had 1.5 times the odds of being of being categorized as emergent (AOR: 1.45, 95% CI: 1.12-1.89). Use of the ambulance for arrival mode had 2.2 higher odds of emergent ED visit categorization compared with self-private transportation (AOR: 2.19, 95% CI: 1.89-2.54). There were no other significant predictors in the presence of all other variables.
Association between demographics, health-related variables, and ED visit characteristics with emergent ED visits in adults ⩾65 years old.
Abbreviations: CI, confidence interval; ED, emergency department; OR, odds ratio.
n = 4379 due to missing responses, exclusion of unknown race and ethnicity category, admit mode by helicopter.
Likelihood ratio for probability of emergent ED visit χ2 = 173.06, df = 28, P < .0001.
P < .05 statistically significant.
Predictors of Total ED Visit Costs
The mean total ED costs per visit by demographics and ED visit characteristics are summarized in Table 4. A total of 5045 ED visits were included, of which a total of 3870 ED visits were nonemergent and 1175 were emergent ED visits. Total ED costs increased with age. Age ⩾79 years had a higher mean total ED cost (US $694) than ED visits by 65 to 67, 68 to 71, or 72 to 78 years (US $607, US $614, US $645, respectively). White race had a higher mean total ED cost (US $685) than African American (US $625) or other (US $641) race categories. Likewise, ambulance arrival to the ED vs self-private transportation (US $807 vs US $577) and ED visits with a discharge disposition to home or self-care had a higher mean total ED cost (US $666) than those ED visits with a discharge disposition of left AMA (US $210) or left before clinical evaluation (US $58). Not a frequent ED user vs frequent user (US $644 vs US $599) and the year 2013 had the highest mean total ED costs (US $730) compared with years 2010 to 2012 (US $566-US $656). The ED visits categorized as emergent vs nonemergent visit type (US $928 vs US $549) had higher mean total ED costs.
Average total ED costs per visit by demographics, health-related variables, and ED visit characteristics in adults ⩾65 years old.

Abbreviation: ED, emergency department.
Costs rounded to nearest dollar.
P < .05.
Results from the full adjusted GLM regression to evaluate predictors of total ED visit costs for nonemergent and emergent ED visits are provided in Table 5. Race, mode of arrival to the ED, year of ED visit, and visit type were significant predictors of total ED visit costs. The ED visits by white patients had 14% higher total ED visit costs and those in the other race category had 16% higher total ED visit costs than ED visits by African American patients (white race: 95% CI: 1.07-1.21; Other race: 95% CI: 1.01-1.33). Arriving to the ED via ambulance was associated with 26% higher total ED visit costs than arrival by self/private transportation (95% CI: 1.20-1.32). An ED visit in 2010, 2011, or 2012 was associated with lower total ED visit costs than an ED visit in 2013. Emergent ED visits were 60% more likely to have higher total ED visit costs than nonemergent visits (95% CI: 1.52-1.69). There were no other significant predictors while controlling for all other variables.
Relationship between demographics, health-related variables, and ED visit characteristics with total ED visit costs in adults ⩾65 years old.

Abbreviations: CCI, Charlson Comorbidity Index; CI, confidence interval; ED, emergency department.
n = 4464 were included in the final model after exclusion of missing responses, zero costs, 5 extreme cost outliers, unknown race and ethnicity category, admit mode by helicopter, and discharge disposition categories of other facility/nursing home and expired variables. Scaled Pearson χ2 = 5077.32, df = 4432, P < .001.
P < .05.
Discussion
Overall, this study indicated that community-dwelling older adults had more nonemergent ED visits than emergent ED visits. Many of the top nonemergent discharge diagnoses in this group of older adults were pain related (eg, abdominal pain, headache, back pain). Although our study did not indicate the length of the patient’s problem, it is feasible that chronic pain conditions are suitable for treatment in the primary care setting. In a sample of health care hot spot residents who used the ED, themes identified from interviews indicated that pain was a common reason for ED use and many residents did not contact a health care provider prior to their ED visit. 36 Likewise, a study by Johnson and colleagues revealed that older adults had almost 3 times the risk of an ED visit and 7 times the risk of a subsequent hospitalization for an ambulatory care sensitive condition compared with adults aged 18 to 29 years. 37 An opportunity for patient education at ED discharge about using other sources of care, including primary care services for nonemergent conditions, may be warranted. 38 In addition, assessing whether the patient has a primary care provider at time of discharge, coordinating follow-up care when needed, and asking whether any problems exist with accessing care (eg, transportation, office hours) may help to decrease preventable ED use.
Although a lower proportion of ED visits in this study, emergent ED visits remain a concern in older adults due to their associated poor outcomes. This study identified men, white, higher number of comorbidities (CCI score, total disease count), and arrival by ambulance as significant predictors of an emergent ED visit in this group of community-dwelling older adults. For Medicare patients, emergent ED visits were 3.5 times more likely to result in hospitalization within 1 day, 3.0 times more likely to result in hospitalization within 7 days, and 2.2 times more likely to result in death with 30 days of the ED visit compared with visits categorized as nonemergent. 21 As diabetes and asthma were in the top emergent ED visit discharge diagnoses, future research is warranted around chronic disease management of these conditions and avenues for improvement.
Not surprisingly, total ED visit costs were higher for emergent ED visits and ED visits where the mode of arrival was via ambulance. Total ED visit costs were also higher for white and other race compared with African American ED visits. This study did not support a relationship of higher costs between health care hot spot residence and frequent ED use. In contrast, past studies have shown that costs are often related to a small number of patients residing in a hotspot.17–19 However, the small number of ED visits from this health care hot spot may play a role in the nonsignificant finding.
Limitations
This study is limited by the accuracy of the data in the electronic medical record or billing data. However, if misclassification bias occurred, it is likely to be nondifferential misclassification (ie, the probability of a variable being misclassified is the same for all ED visits in the electronic medical record).
Another limitation is that this study includes data from one academic medical center and not all of the local EDs. It is unknown whether the patient selected this ED or whether care was directed to this ED by EMS, by the patient’s health insurance coverage, or because of overcrowding at other local EDs. The generalizability of this study’s results is limited to other urban, academic medical centers with similar patient populations (eg, predominantly African American and women).
Another potential concern is that the ED visit problem list was a mixture of SNOMED CT and ICD-9-CM codes. A cross map was used to convert SNOMED CT codes to ICD-9-CM codes for calculating the CCI score. It is possible that not all of the SNOMED CT codes converted into ICD-9-CM codes used in the CCI calculation. Thus, the study CCI may be lower than the actual CCI. In addition, there is a possibility that all patient problems were not coded with ICD-9-CM or SNOMED CT codes in the original data set (ie, some problems are missing).
The payment source was categorized from several primary health plan names. To limit misclassification bias, any primary health plan name with Medicare or Medicaid in the title was categorized as Medicare or Medicaid, respectively. It is possible that a primary health plan categorized as other may be a form of Medicare or Medicaid insurance. Another limitation is the exclusion of mental health, alcohol, substance abuse, injury, and unclassified ED visits by the NYU ED categorization. This exclusion may underestimate or overestimate our results.
Conclusions
Nonemergent ED visits were more common than emergent ED visits in this sample of ED visits by community-dwelling older adults in an urban, academic medical center. White race and arrival by ambulance were associated with both emergent ED visits and higher total ED visit costs, whereas sex (ie, men) and higher number of comorbidities were only associated with emergent ED visits. Residence in a health care hot spot was not associated with higher total ED visit costs or type of ED visit. Strategies to maximize opportunities for care in the primary care setting are warranted to potentially reduce nonemergent ED utilization in community-dwelling older adults.
Footnotes
Funding:
The author(s) disclosed receipt of the following financial support for the research, authorship and/or publication of this article: This work was supported by an American Foundation for Pharmaceutical Education (AFPE) Pre-Doctoral Fellowship awarded to ABC. The publication was supported by CTSA award no. UL1TR000058 from the National Center for Advancing Translational Sciences. Its contents are solely the responsibility of the authors and do not necessarily represent official views of the National Center for Advancing Translational Sciences or the National Institutes of Health.
Declaration of conflicting interests:
The author(s) declared no potential conflicts of interest with respect to the research, authorship, and/or publication of this article.
Author Contributions
ABC was the principal investigator for the study and responsible for study design, data collection, data analysis and interpretation, and manuscript preparation. ABC is also the corresponding author for the manuscript. LRM was responsible for assisting with study design, data analysis and interpretation, and manuscript preparation. KCO, PLP, PWS, and PEM were responsible for assisting with study design, data interpretation, and manuscript preparation.
Ethical Approval
This study is approved by Virginia Commonwealth University IRB HM20002191.