
Abstract
Background:
The proportion of outpatient surgeries performed in physician offices has been increasing over time, raising concern about the impact on outcomes.
Objective:
To use a private insurance claims database to compare 7-day and 30-day hospitalization rates following relatively complex outpatient surgical procedures across physician offices, freestanding ambulatory surgery centers (ASCs), and hospital outpatient departments (HOPDs).
Methods:
A multivariable logistic regression model was used to compare the risk-adjusted probability of hospitalization among patients after any of the 88 study outpatient procedures at physician offices, ASCs, and HOPDs over 2008-2012 in Florida.
Results:
Risk-adjusted hospitalization rates were higher following procedures performed in physician offices compared with ASCs for all procedures grouped together, for most procedures grouped by type, and for many individual procedures.
Conclusions:
Hospitalizations following surgery were more likely for procedures performed in physician offices compared with ASCs, which highlights the need for ongoing research on the safety and efficacy of office-based surgery.
Keywords
Introduction
The number of outpatient surgeries performed in physician offices in the United States has risen dramatically over the past 30 years, increasing from about 110 000 procedures in 1981 to 12 million procedures in 2009.1,2 Growth in office-based surgical procedures is attributable to a number of factors, most notably physicians seeking greater autonomy, technological advances making office-based surgery feasible for more procedures, as well as the potential to enhance physician office revenue.3,4
There have been some concerns, however, regarding the quality of surgical procedures provided in physician offices relative to more fully equipped and staffed hospital outpatient department (HOPD) and ambulatory surgery center (ASC) settings. Although some studies based on state-level adverse event reporting systems have not revealed any major quality problems, studies with more rigorous study designs have uncovered some quality differences between surgical procedures performed in physician offices and other outpatient settings.
In this article, we build on the existing research on outcomes for office-based surgery, as summarized in the “Background” section. Specifically, we conduct a retrospective study of the likelihood of hospitalization following outpatient surgery in Florida, from 2008 through 2012, using a large private insurance claims database. Our study compares the risk-adjusted rates of all-cause hospitalizations occurring within 7 and 30 days after procedure across facility type (physician offices, ASCs, or HOPDs) for one of the 88 relatively complex outpatient surgical procedures included in the study.
Background
Conceptual context
There are important differences between physician office-based surgery and surgery performed in ASCs and HOPDs, in several dimensions: (1) regulation, (2) surgeon volume and learning, (3) credentialing and peer review, and (4) facilities and equipment. Concerns about the safety and efficacy of office-based surgery are largely predicated on these differences.5–10
Physician office-based surgery is largely unregulated, with fewer requirements for adverse event reporting, risk management, and quality improvement processes in physician offices as opposed to ASCs and HOPDs.7,11 Regulation does not guarantee safer or better outcomes, but it does establish uniform minimum standards and reporting requirements which are generally designed to reduce variation in practice patterns and improve adherence to best clinical practices.12–14
Surgeon volume and learning-by-doing are also likely to play an important role in differential outcomes between physician offices and more intensive settings. 15 One of the defining characteristics of office-based surgery is that it is less resource intensive. But lower resource intensity can also limit the number of surgeries that can be performed in the office setting, which in turn may lessen the ability of office-based surgeons to capture the learning-by-doing benefits of higher volume. Lower volumes are likely to affect other members of the surgery team; in physician offices where surgery is largely a part-time activity, it may be difficult to attract higher quality anesthesiologists and surgical assistants.
A related and important difference between offices and other settings is that office-based surgeons are generally not subject to detailed credential review, in contrast to surgeons seeking access to surgical facilities at an ASC or HOPD. 16 They are also less likely to be subject of a formal review process for their adverse outcomes, particularly for office-based surgeons practicing solo or in small groups, where even informal peer review is less likely to occur. Moreover, office surgeons are the prime authority in their surgical suite; the checks and balances that are normally present in ASCs and HOPDs may or may not be present in office settings (eg, physician offices may not have autonomous medical directors and administrators). 14
The lower resource intensity of physician offices has potentially important implications for safety. Medical equipment and buildings are expensive but play an important role in clinical outcomes and safety.7,16–18 Without a requirement to construct or equip a surgical suite according to uniform minimum standards consistent with the construction and equipping of ASCs and HOPDs, it is possible for some office-based surgical suites to be underequipped and less prepared for adverse events. Even routine equipment can also have implications for outcomes. A specific example is sterilization. Immediate-use steam sterilization (IUSS), formerly referred to as “flash sterilization” is relatively inexpensive, requires fewer instrument sets, and is commonly used in office-based surgery practices. However, IUSS has been shown to be a less effective sterilization technique than using a full-cycle sterilizer, which is the norm for ASCs and HOPDs.19–22
Prior studies
Most existing studies of this issue do little or nothing to adjust for differences in the clinical factors affecting the risk of complications among patients who presented to different types of surgery sites. For example, a survey-based study of office-based liposuction by Housman et al 23 used data from members of the American Society for Dermatologic Surgery listed as performing liposuction. A total of 261 dermatologic surgeons provided data on 66 570 liposuction procedures. No deaths were reported. The overall serious adverse event (SAE) rate was 0.68 per 1000 cases. The SAE rates were higher for hospitals and ASCs than for nonaccredited office settings. Serious adverse event rates were also higher for tumescent liposuction combined with intravenous or intramuscular sedation than combined with oral or no sedation. However, no risk adjustment was performed in this study. Given the likelihood of higher case complexity for ASCs and HOPDs, higher observed complication rates are expected and may not indicate differences in quality across settings.
Comparative retrospective studies with more rigorous study designs incorporating some form of risk adjustment enable more meaningful conclusions about outcomes. For example, using the Florida adverse event registry data, Vila et al 24 found that adverse incidents occurred at a rate of 66 per 100 000 procedures in physician offices compared with 5.3 per 100 000 procedures in ASCs (relative risk = 12.4; 95% confidence interval [CI]: 9.5-16.2). Similarly, the death rate per 100 000 procedures performed was 9.2 in offices compared with 0.78 in ASCs (relative risk = 11.8; 95% CI: 5.8-24.1). The authors concluded that “if all office procedures had been performed in ASCs, approximately 43 injuries and 6 deaths per year could have been prevented.”
One of the more rigorous comparative observational studies to date is by Fleisher et al. 25 The authors conducted a claims analysis of patients undergoing 16 different surgical procedures in a nationally representative (5%) sample of Medicare beneficiaries (1994-1999). Mortality rates, emergency department risk, and admission to a hospital within 7 days of outpatient surgery were compared across physicians’ offices, ASCs, and HOPDs. Rates were risk-adjusted for age, sex, race, and comorbidity using multivariable logistic regression. The analytic data file contained information on 564 267 outpatient surgical procedures: 360 780 at an HOPD, 175 288 at an ASC, and 28 199 at a physician’s office. The risk-adjusted 7-day mortality rate was 35 per 100 000 outpatient procedures at physicians’ offices, 25 per 100 000 outpatient procedures at ASCs, and 50 per 100 000 outpatient procedures at HOPDs. The risk-adjusted rate of admission to a hospital within 7 days of outpatient surgery was 9.08 per 1000 outpatient procedures at physicians’ offices, 8.41 per 1000 outpatient procedures at ASCs, and 21 per 1000 outpatient procedures at HOPDs.
In this article, we expand on the analytic approach used by Fleisher et al 25 in several aspects beyond the use of commercial claims data rather than Medicare claims data. First, we employ a more comprehensive set of risk measures in our risk adjustment model. Second, we examine a wider range of specific outpatient surgical procedures (88 compared with 15). Finally, we use more recent data. The goal of the article is to build on existing research to expand understanding of the role of surgical facility type on outcomes of relatively complex outpatient surgical procedures.
Methods
Data
We conducted a retrospective study of surgical outcomes using a large private insurance claims database, specifically the Truven Health MarketScan Commercial Claims and Encounters Database, for Florida over the period 2008 through 2012, which was the most recent 5-year period available when this research was conducted. Florida was chosen because of its large population overall, its relatively large share of residents aged 65 years and older (19.4% compared with 14.9% for the United States in 2015), and its relatively high proportion of expenditures for physicians and other professional services (30.9% compared with the US average of 27.4% in 2009). 26 The MarketScan database contains individual-level, de-identified, health care claims information from employers, health plans, hospitals, Medicare, and Medicaid programs. These databases reflect the real world of treatment patterns and costs by tracking millions of patients as they travel through the health care system offering detailed information about all aspects of care. Data from individual patients are integrated from all providers of care, maintaining all health care utilization connections at the patient level.
There were thousands of different surgical procedures performed at outpatient facilities during the time period, so one of the first tasks was to reduce the number of index surgical procedures for analysis and reporting purposes. We selected outpatient procedures using the following criteria: (1) we only selected procedures that had at least 100 office-based procedure claims over 2008-2012 (ie, at least an average of 20 procedures per year) and (2) a “work relative value unit” (work RVU) of at least 4.0 (ie, relatively complex procedures). 27 The volume threshold was selected to eliminate procedures with an insufficient sample of office-based cases for analysis. The focus on relatively complex procedures was applied because, as noted in the “Background” section, theory predicts that differences in outcomes across types of surgery settings are least likely to be observed for low-complexity procedures. 28
Procedure complexity was measured using the work RVU, which is a component of the Medicare (Part B) physician payment system based on the Current Procedure Terminology (CPT) code for the procedure. The payment formula contains 3 RVU components: physician work, practice expense, and malpractice expense. A code with a higher work RVU generally takes more time, more intensity, or some combination of the 2. Thus, our underlying assumption in using the work RVU cut-off is that, in general, work RVU approximates procedure complexity. A total of 88 surgical procedures met these criteria (see Table A1 for descriptions). This represents a wider range of procedures compared with the 15 procedures included in the Fleischer et al 25 study.
The location of services (physician office, ASC, or HOPD) was determined by the place of service code in the claims. In addition, patients with claims for study procedures were required to have insurance coverage during the month of and the month after the procedure.
The initial study sample consisted of 4 080 800 claims with CPT codes for one of the 88 study procedures in Florida for 2008-2012. From this initial sample, 139 243 claims were excluded because the surgical facility type was not one of the 3 study facility types. After combining claims with the same patient number, CPT code, data of service, and location of service, the sample included 2 807 857 unique surgical procedures. From this total, 148 531 procedures were excluded because the patients did not have insurance coverage in both the month before and the month after surgery, leaving a final study sample of 2 757 016 procedures (see Figure 1).
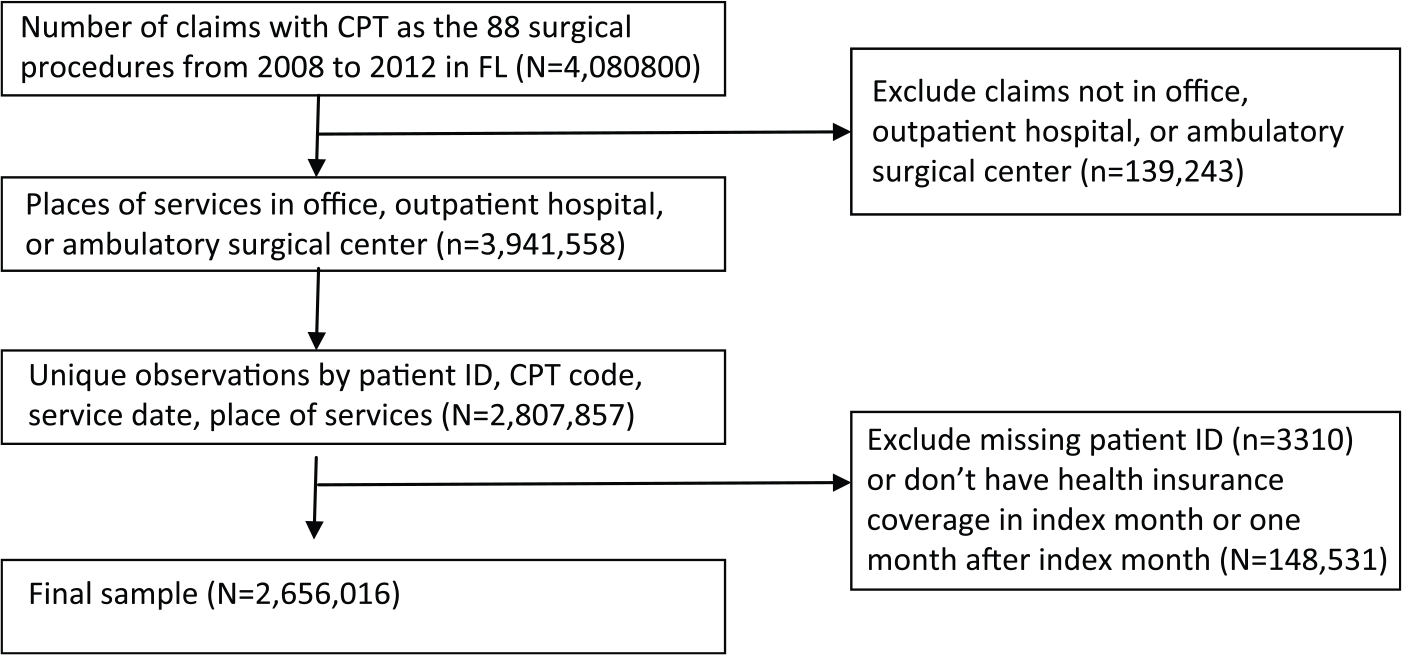
Sample flowchart. CPT indicates Current Procedure Terminology.
Measurement
Dependent variable
The main outcome measure used as the dependent variable in our multivariable logistic regression model was hospitalization within 7 days (or alternatively hospitalization within 30 days) of the surgical procedure index date. Postprocedure hospitalization is a standard measure of surgery outcomes29,30 and was used as an outcome measure in the Fleisher et al 25 study. All-cause hospitalizations were identified based on inpatient claims with admission dates within 7 or 30 days of the selected index procedures.
Independent variables
Risk adjustment facilitates a more meaningful comparison of hospitalization rates across surgical sites, given the likelihood of differences in patient severity or complexity across surgical sites. To implement risk adjustment, in addition to categorical variables for types of surgical sites, our multivariable logistic regression model included as independent variables a comorbidity index, patient age, patient sex, Major Diagnostic Category (MDC), geographic region, employment status, and year.31–33 The specific comorbidity index used was the Centers for Medicare and Medicaid Services-Hierarchical Condition Category (CMS-HCC), which was developed by the CMS as a summary index based on 189 medical condition indicators. 34 Although designed to be used for risk-adjusted payments, it has demonstrated better performance relative to the commonly used Charlson and Elixhauser indices. 35 In general, patients with higher scores are less healthy and therefore at higher risk of future hospitalizations.
Statistical analysis
We first performed a descriptive analysis of the extent of transition from HOPD or ASC-based settings to office-based settings for the 88 study procedures from the beginning of the study period (2008-2009) to the end of study period (2011-2012). The risk-adjusted hospitalization rates across settings were estimated by multivariable logistic regression models using Stata Version 14.2 (www.stata.com). A Huber-White robust standard error estimation procedure was used to account for potential variance components when estimating standard errors, such as the potential for repeated outcome measures for the same patients (ie, some patients might have received multiple treatments for study procedures during the study period).
Three sets of logistic regression models were estimated. The first was a model with data for all 88 procedures as a pooled group. The pooled model included as independent variables a set of dummy variables for each CPT code procedure. The second is a set of models for CPT procedures grouped by the type of condition being treated (eg, CPT 40490-49999 for “Digestive” procedures). The final set of models examined each of the 88 procedure codes as separate models.
Results
Utilization by setting
Work RVU, volume, and utilization by setting for the procedure groups are shown in Table 1. The overall change in procedure setting from ASCs and HOPDs to office settings was relatively low among the procedures selected for analysis, most likely attributable to exclusion of less complex procedures (RVU < 4) that might have been most likely to move to physician offices. The total proportion of all of the 88 study procedures performed in physician office settings in the earlier period (2008-2009) was 6.7% and grew to 8.0% in the later period (2011-2012), with an aggregate change of about 1.2%.
Surgical procedures performed in physician offices, by surgery code group, 2008–2012.

Abbreviations: CPT, Current Procedure Terminology; RVU, relative value unit.
Authors’ analysis of Truven MarketScan commercial claims data; see text for description.
The procedures with the highest levels of change to office settings were in the cardiovascular system group (CPT 33010-37799), increasing from 30.3% in physician offices in the earlier period (2008-2009) to nearly 50% by the later time period (2011-2012). This change was mainly due to an overall 79% increase in volume for CPT 36475 over this period, coupled with a high physician office volume share for this procedure (87%). In addition, procedures of the female genital system and integumentary system had relatively high levels of change to office settings (4.88% and 4.64%, respectively) in the period 2008-2012. Procedure volumes and the physician office share of procedures for individual procedures within CPT groupings are reported in Table A2.
Hospitalization rates
Risk adjustment models for the likelihood of hospitalization converged for a model with all of the 88 study procedures pooled together and also converged for models for 12 CPT groupings based on standard body system categories (eg, cardiovascular). Risk adjustment models also converged for 71 of the 88 individual CPT procedures. Failure to converge for the remaining 17 study procedure models was a result of a very low procedure volume for the specific procedure in 1 or more of the 3 site categories, or a very low rate of postprocedure hospitalization overall, or a combination of both. Rates of 7-day and 30-day hospitalizations were compared between office, ASC, and HOPD settings for the study of all 88 study procedures as a group, by 12 CPT groupings, and for the 71 individual procedure models. Differences in risk-adjusted rates across sites were tested for statistical significance.
All study procedures
The rates of hospital admissions (7-day and 30-day) for all 88 study procedures are reported in Table 2. The table also shows the differences between observed (unadjusted) rates and risk-adjusted rates. For the 7-day admission measure, observed rates are lowest for ASCs (0.59%), with observed rates for physician offices only slightly higher at 0.68%, and HOPD observed rates are substantially higher at 2.02%. After adjustment for the observed risk factors included in our multivariable logistic regression model (see Table A4), the office-based rate more than doubles (to 1.57%), whereas the ASC rate increases by 39% (to 0.82%) and the HOPD rate decreases by 15% (to 1.71%). The 30-day admission measure shows a similar pattern, with observed rates roughly similar for ASCs and physician offices but substantially higher for HOPDs and with risk adjustment increasing the physician office and ASC rates but reducing the HOPD rate.
Observed rates and risk-adjusted rate of hospital admissions within 7 and 30 days after procedure.
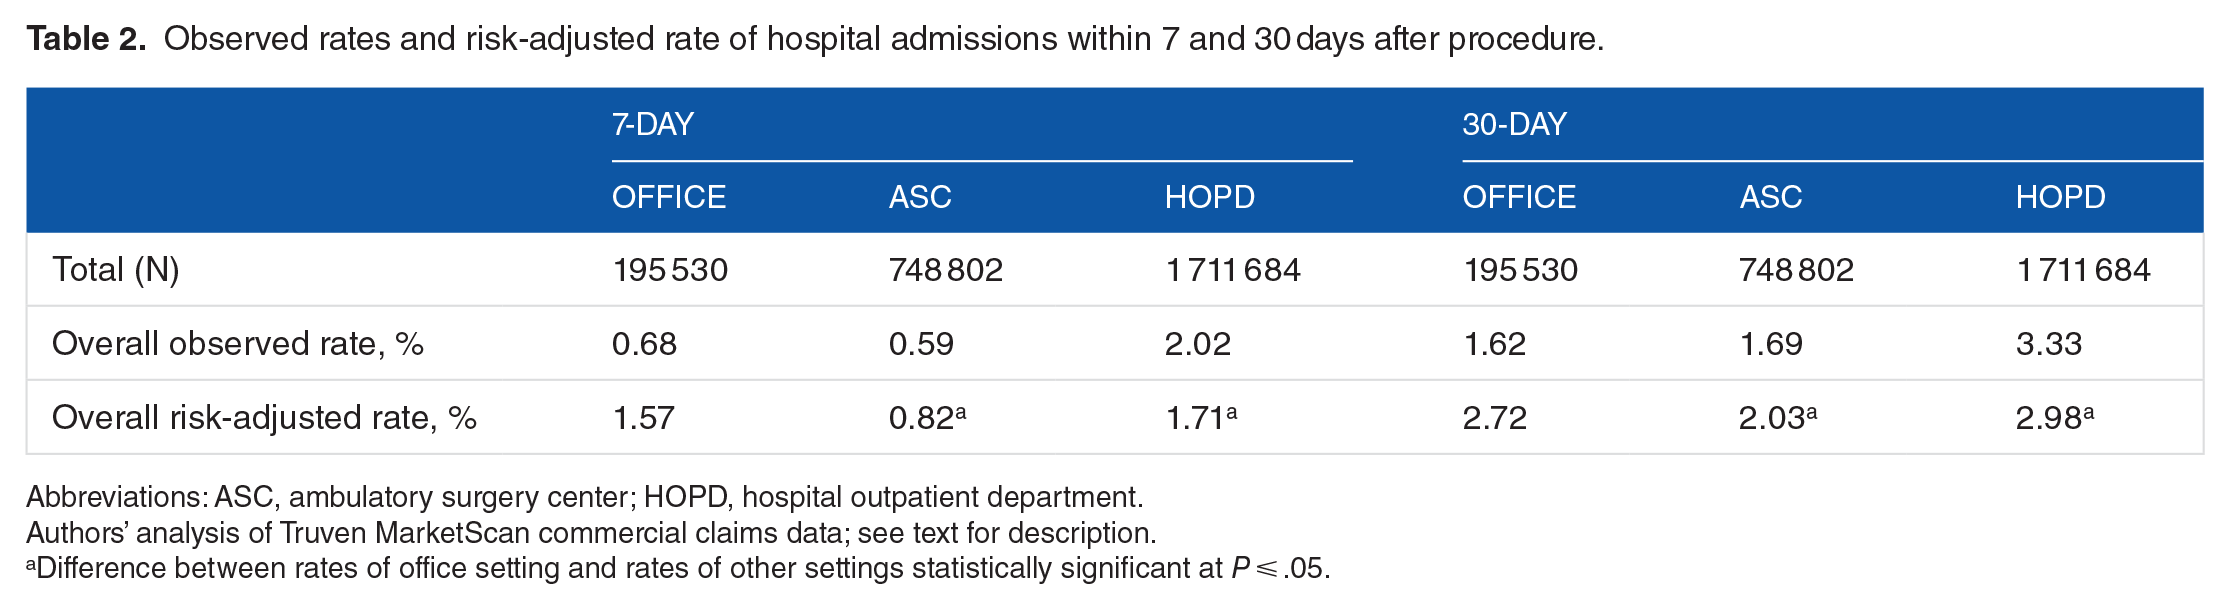
Abbreviations: ASC, ambulatory surgery center; HOPD, hospital outpatient department.
Authors’ analysis of Truven MarketScan commercial claims data; see text for description.
Difference between rates of office setting and rates of other settings statistically significant at P ⩽ .05.
Procedure groups
A comparison of risk-adjusted hospitalization rates (7-day and 30-day post-index procedure) by setting and by procedure group is reported in Table 3. The physician office risk-adjusted 7-day hospitalization rate is higher than the ASC rate for 8 of the 12 procedure groups (P < .05), with no statistically significant difference for 3 of the procedure groups, and a higher ASC rate (P < .05) for 1 procedure group (cardiovascular). Similarly, the physician office risk-adjusted 30-day hospitalization rate is higher than the ASC rate for 8 of the 12 procedure groups (P < .05), with no statistically significant difference for 2 of the procedure groups, and a higher ASC rate (P < .05) for 2 procedure groups (cardiovascular and integumentary). Among the procedure groups with a lower risk-adjusted 30-day hospitalization rate for ASCs, the largest absolute difference is a 7.4 percentage point lower risk of ASCs in the “hemic and lymphatic” procedure group (22.3% vs 14.9%), whereas the largest proportional differences are a 83% lower rate for the “auditory” group (0.90% vs 0.15%) and a 68% lower rate for the “nervous” procedure group (5.1% vs 1.6%).
Risk-adjusted hospital admission rates within 7 and 30 days after the procedure.

Abbreviations: ASC, ambulatory surgery center; CPT, Current Procedure Terminology; HOPD, hospital outpatient department.
Authors’ analysis of Truven MarketScan commercial claims data; see text for description.
Difference between rates of office setting and rates of other settings statistically significant at P ⩽ .05.
For HOPDs, the risk-adjusted 7-day and 30-day hospitalization rates were lower than the physician office rates (P < .05) for 2 procedure groups (hemic and lymphatic; eye and ocular). The risk-adjusted HOPD 7-day admission rate was higher than the physician office rate (P < .05) for 4 procedure groups, with no statistically significant difference for the remaining 8 procedure groups. Similarly, the risk-adjusted HOPD 30-day admission rate was higher than the physician office rate (P < .05) for 5 procedure groups, with no statistically significant difference for the remaining 7 procedure groups.
Specific procedures
Among the specific procedures within groupings (Table A3), the risk-adjusted rate of 7-day hospitalization for office-based procedures was greater than the ASC rate (P < .05) for 30 of the 71 individual CPT code models, with no statistically significant difference for the remaining 41 CPT models. Similarly, the risk-adjusted 30-day hospitalization rate for office-based procedures was greater than the ASC rate (P < .05) for 27 of the 71 individual CPT code models, with no statistically significant difference for the remaining 44 CPT models. None of the models indicated a statistically significant higher risk-adjusted ASC rate for either hospitalization measure.
The risk-adjusted 7-day hospitalization rate for office-based procedures was greater than the ASC rate (P < .05) for 7 of the 12 most complex procedures (work RVU > 10) and was greater than the ASC rate (P < .05) in 8 of the 12 models for the risk-adjusted 30-day hospitalization rate. In contrast, for the 12 least complex procedures included in the study (work RVU between 4.0 and 4.9), the risk-adjusted hospitalization rate for office-based procedures was greater than the ASC rate (P < .05) for 3 of the 12 models for 7-day hospitalization and for 4 of the 12 models for 30-day hospitalization.
To be conservative, statistical significance for the 71 individual procedure models was reassessed using a false discovery rate control approach suggested by Glickman et al, 36 as an alternative to the traditional Bonferroni adjustment for multiple comparisons. This approach entails sorting the 71 procedure models from the smallest to the largest P value for the estimated ASC coefficient and then applying an adjustment factor of (k/N) to the significance level (.05) to test the statistical significance for the kth model, where k is the rank order of the sorted models. For example, the procedure model with the smallest P value for the ASC coefficient (CPT 57288, repair bladder defect) had a P value of about 6.6e−80 (ie, a t ratio of 19.1). Applying the adjustment factor to .05 for k = 1 yields a significance criterion of .00074 (ie, .05 × (1/71)), which is larger than the P value for the ASC coefficient, so the null hypothesis of no difference is rejected. Similarly, for the procedure model with the 24th smallest P value (CPT = 20926, removal of tissue for graft), applying the adjustment factor to .05 for k = 24 yields a significance criterion of .0169 (ie, .05 × (24/71)), which in this case is smaller than the P value for the ASC coefficient (P = .0173), so the null is not rejected.
After applying this adjustment to the P < .05 significance level for all 71 procedures, the risk-adjusted rate of 7-day hospitalization for office-based procedures was statistically greater than the ASC rate for 23 of the 71 individual CPT code models, and the risk-adjusted 30-day hospitalization rate for office-based procedures was statistically greater than the ASC rate (P < .05) for 21 of the 71 individual CPT code models.
Focusing on specific procedures, the largest significant difference in outcomes between an office setting and ASC was tissue removal for graft (CPT 20926), which had risk-adjusted 7-day postsurgery hospitalization in the office setting nearly 12 times higher than that of ASCs (78.70% vs 6.59%, respectively) and 30-day hospitalization rates more nearly 11 times higher than that of ASCs (78.50% vs 7.28%, respectively). Similarly, the difference in outcomes for the same procedure was 2 times higher in an office setting compared with an HOPD setting for both risk-adjusted 7-day and 30-day hospitalizations, although the work RVU for this procedure is a relatively low 5.79.
The individual surgical procedure in which there was the largest significant difference in outcomes between an office setting and HOPD was shoulder arthroscopic surgery (CPT 29824), which had risk-adjusted 7-day postsurgery hospitalization in the office setting more than 4 times higher than that of HOPD (4.51% vs 0.94%, respectively) and 30-day hospitalization rates more than 3 times higher than that of HOPD (5.55% vs 1.67%, respectively). In addition, the same procedure had a risk-adjusted 7-day hospitalization rate in an office setting 9 times higher than that of the ASC setting (4.51% vs 0.46%, respectively) and 30-day hospitalization rate nearly 5 times higher than that of the ASC setting (5.55% vs 1.18%, respectively). The work RVU for this procedure is 8.98, which implies a more complicated and lengthy surgical process.
Discussion
Using a retrospective analysis of more than 1 million private health insurance claims in Florida from 2008 to 2012, we found high rates of change in the volume of procedures by facility type—moving from ASCs and HOPDs to physician offices—for a small number of the 88 surgical procedures examined in the analysis. However, for most of the 88 procedures, change rates were relatively low. These low observed rates of procedure volume shift to physician office settings probably reflects the focus on 88 relatively high-complexity procedures included in this study.
In addition, our analysis of risk-adjusted rates of hospitalizations following procedures performed in physician offices, ASCs, and HOPDs found significantly higher hospitalization rates after procedures performed in physician office settings compared with ASCs for most of the procedures studied. Across all 88 procedures included in the study, 7-day hospitalization rates were nearly 2 times higher for patients receiving procedures in an office setting compared with an ASC setting (P < .05). Similarly, 30-day hospitalization rates for surgical procedures performed in office settings were about 34% higher than the ASC rate for the total of 88 procedures (P < .05).
Similar, though, less consistent results were obtained for models where procedures were grouped by CPT code category or for models focused on specific procedures. Point estimates usually indicated that risk-adjusted hospitalization rates were higher for office-based procedures compared with ASC procedures, but the estimated differences were often not statistically significant, particularly for relatively low-complexity procedures.
One inconsistent finding is for the cardiovascular CPT code group, where the results indicate a statistically significant higher 7-day and 30-day hospitalization rate for ASC compared with office-based procedures. However, the cardiovascular group consisted of only 2 CPT codes: 36475, which is usually performed in physician offices (87% volume share), and 36561, which is rarely performed in physician offices (2.2% volume share), as shown in Table A2. When estimated separately, the model for CPT 36475 fails to converge, due in part to very low overall postprocedure hospitalization rates (<0.5%), which coupled with a low HOPD volume share (2.6%) results in no post-HOPD procedure hospitalizations observed in the data. The point estimate ASC coefficient in the CPT 36561 model is positive (consistent with the cardiovascular group result) but not statistically significant (see Table A3).
Another inconsistent result is for the integumentary CPT code group, where a statistically significant higher 30-day hospitalization rate for ASC compared with office-based procedures was found. The integumentary CPT code group consists of 10 CPT codes, which not only includes 5 procedures (17311, 14060, 14040, 15823, and 19350) with physician volume shares ranging from 12% to 93% and an average work RVU value of 8.0 but also includes 4 procedures (19318, 19380, 19125, and 19301) with an average work RVU value of 11 and low physician volume shares (<3%). Individual CPT code models converged for 8 of the 10 integumentary group codes, but only 2 models (19120 and 19318) had statistically significant ASC coefficients, both of which indicated lower 7-day and 30-day hospitalization rates for ASC compared with office-based procedures.
With respect to the 71 individual procedure models, the results indicated a statistically significant lower hospitalization rate for ASC compared with office-based procedures for about one-third of the 71 procedures, but none of the remaining individual procedure models indicated statistically significant differences in physician office and ASC hospitalization rates.
Taken as a whole, our results are consistent with those of Fleischer et al, 25 who used Medicare data to examine postsurgery hospitalization rates and mortality rates in offices, ASCs, and HOPDs. In that study, the rate of admission to an inpatient hospital within 7 days of outpatient surgery was 9.08 per 1000 outpatient procedures at physicians’ offices, 8.41 per 1000 outpatient procedures at ASCs, and 21 per 1000 outpatient procedures at HOPDs. Our study finds substantially larger differences between the physician office and ASC settings in the privately insured population, but the direction of the results across studies is consistent.
Limitations
This study has several important limitations. First, our study sample is limited to Florida and may not be representative of other states or national trends. Second, unlike Fleisher et al, the Truven MarketScan database did not support any assessment differences in mortality across settings. Instead, our analysis focused on all-cause postprocedure hospitalizations (which also were analyzed in Fleischer et al) as our outcome measure. Of course, postprocedure hospitalizations may or may not be directly attributable to the index procedures. This limitation is not as serious as it might seem because if postprocedure hospitalizations are completely unrelated to index procedures, we would expect to find no significant differences in the rates of hospitalizations between the 2 settings. Thus, any significant differences in risk-adjusted postprocedure hospitalizations that we detect across settings should be, on average, attributable to differences in some types of complication related to the index procedure across settings.
However, the occurrence of a complication ultimately resulting in hospitalization could be attributable to either errors in the process of care or specific clinical characteristics of patients placing them at higher risk of complications. As an observational study (instead of a randomized clinical trial), we cannot assume that patient risk factors were similar for patients receiving index procedures across settings. We used multivariable logistic regression to adjust for differences in observed patient risk factors among patients receiving index procedures across settings, but differences in unmeasured patient risk factors may remain. This creates the potential for bias when making inferences about differences in outcomes attributable to differences in settings.
Fortunately, we may be able to infer the potential direction of bias-based information presented in Table 2. Risk-adjusted hospitalization rates for office-based procedures were substantially higher than observed rates, whereas risk-adjusted rates were lower than actual rates for HOPDs. The ASCs fell in between, with risk-adjusted rates slightly higher than actual rates. This suggests that the lowest risk cases would tend to be treated in an office-based setting, and the highest risk cases would tend to be treated in an HOPD (with ASCs somewhere in between). Indeed, a recent unpublished study confirms that patients undergoing surgery from HOPDs were more likely to have serious comorbid conditions and more likely to have been hospitalized or have an emergency department visit 1 year prior to the date of surgery, compared with patients undergoing surgery in physician offices. 37 Under this assumption, if the true quality of care is approximately equal across settings, we would expect the lowest (unadjusted) hospitalization rates to be for office-based sites and the highest (unadjusted) rates for HOPD. Furthermore, under these assumptions, with “perfect” risk adjustment (no nonignorable unobserved risk factors), the risk-adjusted hospitalization rates would be similar across settings (ie, if true quality is assumed to be equal).
The fact that the risk-adjusted rates were not found to be equal across settings suggests some combination of treatment quality heterogeneity or imperfect risk adjustment—risk-adjusted hospitalization rates consistently were higher in office and HOPD settings compared with ASCs.
Unfortunately, the results do not allow us to make much of an inference regarding HOPD vs ASC quality (ie, the higher HOPD rate could result from higher unmeasured risk for HOPD patients with equal quality, or inferior quality, or some elements of both). However, the adjusted rates are worse for office-based care vs ASC care, which (given the likely favorable selection into office-based care) cannot be dismissed as an artifact of imperfect risk adjustment. In other words, the fact that ASCs had lower risk-adjusted hospitalization rates compared with office-based sites, even though ASCs treated higher risk patients, implies that ASCs on average provide a higher quality of care than office-based settings.
Summary
Our findings update and expand on, but generally confirm, the findings reported in the Fleischer et al 25 study using Medicare claims data. For the 88 relatively complex outpatient surgical procedures included in our study, the risk-adjusted rate of hospitalization generally was higher for patients undergoing procedures at a physician’s office compared with those treated at an ASC, for both 7-day and 30-day postprocedure hospitalization measures. This pattern was most consistent for higher complexity procedures, consistent with theory. Risk-adjusted hospitalization rates also generally were higher for HOPDs compared with ASCs, but that result may be an artifact of unmeasured risk factors not accounted for in our risk adjustment model.
Conclusions
Using a rich data set of more than 1 million private health insurance claims in Florida from 2008 to 2012, we found high rates of change in setting from ASCs and HOPDs to physician offices for some of the study procedures, but low rates of change for many other procedures. This suggests that the observed high rate of growth in office-based outpatient procedures overall is dominated by growth in relatively low-complexity procedures not included in our study. For the more complex procedures included in our analysis, we found that risk-adjusted rates of hospitalizations following procedures in physician offices were significantly higher compared with ASCs for many of the procedures studied. These findings do not necessarily imply that office-based surgery universally results in poor outcomes but do suggest a need for ongoing research on the safety and efficacy of office-based surgery to facilitate guidance for determining, given patient severity, specific outpatient procedures that are appropriate for the less-intensive office-based setting and specific procedures that should ideally remain in the relatively more intensive ASC and hospital outpatient settings.
Footnotes
Appendix 1
Full regressions of hospital admissions within 7 and 30 days after procedure on main sample.

| 7-day |
30-day |
|||||
|---|---|---|---|---|---|---|
| OR | P > z | 95% CI | OR | P > z | 95% CI | |
|
|
||||||
| Office (reference) | ||||||
| Outpatient hospital | 1.09 | .041 | 1.00–1.18 | 1.10 | .001 | 1.04–1.16 |
| ASC | 0.51 | 0 | 0.46–0.55 | 0.73 | 0 | 0.69–0.78 |
|
|
||||||
| <35 (reference) | ||||||
| 35-44 | 1.17 | 0 | 1.13–1.23 | 1.26 | 0 | 1.22–1.31 |
| 45-54 | 1.18 | 0 | 1.13–1.23 | 1.26 | 0 | 1.22–1.30 |
| 55-64 | 1.24 | 0 | 0.22–0.22 | 1.00 | 0 | 0.22–0.22 |
| Female | 1.04 | .027 | 1.00–1.07 | 1.02 | .116 | 1.00–1.05 |
|
|
||||||
| 2008 (reference) | ||||||
| 2009 | 0.93 | 0 | 0.89–0.96 | 0.96 | .004 | 0.93–0.99 |
| 2010 | 0.84 | 0 | 0.81–0.87 | 0.89 | 0 | 0.86–0.92 |
| 2011 | 0.81 | 0 | 0.78–0.84 | 0.87 | 0 | 0.85–0.90 |
| 2012 | 0.81 | 0 | 0.77–0.84 | 0.85 | 0 | 0.82–0.88 |
|
|
||||||
| Active (full-time or part-time) | ||||||
| Retiree, dependents, COBRA continuee, or long-term disability | 1.13 | 0 | 1.06–1.20 | 1.12 | 0 | 1.07–1.18 |
| Other/unknown | 0.99 | .403 | 0.96–1.02 | 1.03 | .004 | 1.01–1.06 |
| CMS-HCC score | 1.78 | 0 | 1.67–1.90 | 2.28 | 0 | 2.17–2.39 |
|
|
||||||
| 14040 (reference) | ||||||
| 14060 | 0.50 | 0 | 0.35–0.70 | 0.53 | 0 | 0.42–0.66 |
| 15823 | 0.14 | 0 | 0.06–0.30 | 0.26 | 0 | 0.17–0.41 |
| 17311 | 0.26 | 0 | 0.20–0.34 | 0.49 | 0 | 0.41–0.57 |
| 19120 | 0.84 | .178 | 0.64–1.08 | 1.47 | 0 | 1.23–1.75 |
| 19125 | 0.55 | 0 | 0.40–0.75 | 1.26 | .015 | 1.05–1.52 |
| 19301 | 1.53 | .001 | 1.19–1.97 | 2.21 | 0 | 1.86–2.63 |
| 19318 | 5.31 | 0 | 4.26–6.63 | 3.34 | 0 | 2.81–3.96 |
| 19350 | 2.36 | 0 | 1.80–3.09 | 1.85 | 0 | 1.50–2.29 |
| 19380 | 2.46 | 0 | 1.91–3.17 | 2.03 | 0 | 1.67–2.46 |
| 20680 | 2.57 | 0 | 2.00–3.30 | 1.77 | 0 | 1.47–2.13 |
| 20926 | 7.52 | 0 | 5.93–9.55 | 4.43 | 0 | 3.71–5.30 |
| 21930 | 0.51 | .003 | 0.33–0.79 | 0.56 | 0 | 0.41–0.76 |
| 22851 | 53.26 | 0 | 41.40–68.52 | 29.04 | 0 | 24.10–34.99 |
| 26116 | 0.18 | 0 | 0.07–0.46 | 0.47 | .001 | 0.31–0.73 |
| 27194 | 0.57 | .371 | 0.17–1.94 | 0.84 | .601 | 0.45–1.60 |
| 28080 | 0.33 | .001 | 0.17–0.62 | 0.65 | .013 | 0.46–0.91 |
| 28090 | 0.43 | .007 | 0.23–0.79 | 0.49 | .001 | 0.32–0.76 |
| 28119 | 0.44 | .01 | 0.23–0.82 | 0.63 | .018 | 0.43–0.92 |
| 28122 | 2.21 | 0 | 1.56–3.12 | 2.03 | 0 | 1.56–2.63 |
| 28124 | 0.70 | .125 | 0.45–1.10 | 0.85 | .301 | 0.63–1.16 |
| 28270 | 1.11 | .578 | 0.77–1.61 | 1.01 | .966 | 0.77–1.32 |
| 28285 | 0.70 | .025 | 0.51–0.96 | 0.76 | .014 | 0.61–0.95 |
| 28289 | 0.36 | .001 | 0.20–0.67 | 0.47 | 0 | 0.32–0.71 |
| 28292 | 0.54 | .014 | 0.33–0.88 | 0.51 | 0 | 0.35–0.74 |
| 28296 | 0.33 | 0 | 0.23–0.47 | 0.48 | 0 | 0.37–0.61 |
| 28299 | 0.76 | .24 | 0.48–1.20 | 0.52 | .001 | 0.36–0.75 |
| 28308 | 0.64 | .045 | 0.42–0.99 | 0.66 | .008 | 0.49–0.90 |
| 29822 | 1.22 | .17 | 0.92–1.63 | 0.95 | .633 | 0.76–1.18 |
| 29823 | 1.01 | .958 | 0.75–1.35 | 0.86 | .197 | 0.69–1.08 |
| 29824 | 1.02 | .867 | 0.77–1.36 | 0.85 | .117 | 0.68–1.04 |
| 29827 | 1.11 | .447 | 0.84–1.48 | 0.86 | .146 | 0.69–1.06 |
| 29875 | 0.64 | .005 | 0.47–0.88 | 0.76 | .013 | 0.61–0.94 |
| 29876 | 1.07 | .632 | 0.80–1.44 | 1.05 | .678 | 0.85–1.29 |
| 29877 | 0.74 | .032 | 0.56–0.97 | 0.86 | .135 | 0.71–1.05 |
| 29879 | 0.72 | .034 | 0.53–0.97 | 0.90 | .319 | 0.72–1.11 |
| 29880 | 0.70 | .013 | 0.52–0.93 | 0.85 | .107 | 0.69–1.04 |
| 29881 | 0.58 | 0 | 0.45–0.76 | 0.71 | 0 | 0.59–0.86 |
| 29888 | 1.59 | .001 | 1.21–2.08 | 1.34 | .004 | 1.10–1.64 |
| 30520 | 3.39 | 0 | 2.45–4.69 | 1.75 | 0 | 1.38–2.24 |
| 31254 | 2.43 | 0 | 1.64–3.59 | 1.70 | 0 | 1.27–2.28 |
| 31255 | 2.69 | 0 | 1.92–3.76 | 1.69 | 0 | 1.32–2.18 |
| 31267 | 2.41 | 0 | 1.71–3.37 | 1.65 | 0 | 1.28–2.13 |
| 31276 | 2.86 | 0 | 2.02–4.06 | 1.75 | 0 | 1.35–2.28 |
| 31288 | 3.39 | 0 | 2.33–4.92 | 2.09 | 0 | 1.58–2.77 |
| 36475 | 0.20 | 0 | 0.14–0.30 | 0.42 | 0 | 0.32–0.54 |
| 36561 | 4.17 | 0 | 3.35–5.20 | 5.79 | 0 | 4.96–6.77 |
| 38525 | 10.77 | 0 | 8.74–13.26 | 7.90 | 0 | 6.77–9.22 |
| 42820 | 5.86 | 0 | 4.24–8.10 | 2.67 | 0 | 2.10–3.41 |
| 43770 | 3.86 | 0 | 2.89–5.16 | 2.39 | 0 | 1.90–3.00 |
| 45380 | 0.90 | .396 | 0.71–1.14 | 1.72 | 0 | 1.46–2.03 |
| 45381 | 5.31 | 0 | 4.14–6.80 | 10.28 | 0 | 8.66–12.21 |
| 45383 | 0.76 | .064 | 0.57–1.02 | 1.28 | .011 | 1.06–1.56 |
| 45384 | 0.85 | .199 | 0.66–1.09 | 1.41 | 0 | 1.19–1.68 |
| 45385 | 0.99 | .938 | 0.78–1.26 | 1.72 | 0 | 1.46–2.03 |
| 46260 | 3.48 | 0 | 2.65–4.56 | 2.93 | 0 | 2.39–3.60 |
| 47562 | 8.38 | 0 | 6.44–10.91 | 5.69 | 0 | 4.67–6.92 |
| 47563 | 10.43 | 0 | 8.00–13.60 | 6.67 | 0 | 5.47–8.14 |
| 49320 | 10.47 | 0 | 8.21–13.34 | 8.22 | 0 | 6.89–9.81 |
| 49505 | 1.25 | .091 | 0.97–1.61 | 1.08 | .444 | 0.89–1.30 |
| 49560 | 12.54 | 0 | 9.90–15.90 | 8.70 | 0 | 7.33–10.32 |
| 49568 | 12.13 | 0 | 9.59–15.36 | 8.49 | 0 | 7.17–10.06 |
| 49585 | 3.31 | 0 | 2.58–4.23 | 2.53 | 0 | 2.11–3.03 |
| 50590 | 3.12 | 0 | 2.36–4.11 | 2.36 | 0 | 1.91–2.92 |
| 52353 | 5.17 | 0 | 3.91–6.85 | 3.45 | 0 | 2.78–4.27 |
| 57288 | 19.68 | 0 | 15.39–25.15 | 9.23 | 0 | 7.70–11.06 |
| 57520 | 4.51 | 0 | 3.36–6.05 | 3.64 | 0 | 2.91–4.54 |
| 58345 | 0.32 | .069 | 0.09–1.09 | 0.53 | .053 | 0.27–1.01 |
| 58558 | 1.41 | .008 | 1.10–1.82 | 2.31 | 0 | 1.93–2.77 |
| 58561 | 2.01 | 0 | 1.39–2.90 | 1.76 | 0 | 1.35–2.31 |
| 58563 | 1.09 | .518 | 0.84–1.42 | 1.12 | .261 | 0.92–1.35 |
| 58565 | 0.57 | .019 | 0.35–0.91 | 0.59 | .004 | 0.42–0.84 |
| 58660 | 10.40 | 0 | 8.06–13.40 | 6.50 | 0 | 5.36–7.86 |
| 58661 | 8.19 | 0 | 6.39–10.49 | 4.75 | 0 | 3.95–5.72 |
| 58662 | 3.86 | 0 | 2.99–4.98 | 2.52 | 0 | 2.08–3.05 |
| 58670 | 2.16 | 0 | 1.54–3.03 | 1.60 | 0 | 1.23–2.08 |
| 59820 | 1.15 | .402 | 0.83–1.60 | 0.89 | .427 | 0.68–1.18 |
| 63030 | 9.06 | 0 | 7.04–11.66 | 6.05 | 0 | 5.03–7.27 |
| 63650 | 1.48 | .025 | 1.05–2.09 | 3.36 | 0 | 2.69–4.19 |
| 64704 | 0.88 | .665 | 0.49–1.59 | 0.99 | .96 | 0.67–1.46 |
| 64721 | 0.68 | .028 | 0.48–0.96 | 0.88 | .271 | 0.70–1.11 |
| 65426 | 0.09 | 0 | 0.03–0.34 | 0.19 | 0 | 0.10–0.37 |
| 66982 | 0.48 | .033 | 0.25–0.94 | 0.71 | .095 | 0.48–1.06 |
| 66984 | 0.26 | 0 | 0.16–0.43 | 0.55 | 0 | 0.40–0.76 |
| 67210 | 0.65 | .117 | 0.38–1.12 | 1.06 | .721 | 0.77–1.47 |
| 67904 | 0.25 | .002 | 0.11–0.60 | 0.40 | 0 | 0.24–0.65 |
| 69610 | 0.68 | .225 | 0.37–1.26 | 0.51 | .004 | 0.32–0.80 |
| 69620 | 1.10 | .786 | 0.54–2.26 | 0.61 | .093 | 0.35–1.08 |
|
|
||||||
| Missing/invalid diagnosis (reference) | ||||||
| Nervous | 1.88 | 0 | 1.33–2.65 | 1.70 | 0 | 1.30–2.24 |
| Eye | 2.17 | .004 | 1.28–3.69 | 2.23 | 0 | 1.54–3.21 |
| Ear, nose, mouth, and throat | 1.02 | .91 | 0.71–1.47 | 1.29 | .094 | 0.96–1.73 |
| Respiratory | 1.80 | .001 | 1.27–2.54 | 1.44 | .008 | 1.10–1.89 |
| Circulatory | 3.32 | 0 | 2.42–4.56 | 2.74 | 0 | 2.12–3.55 |
| Digestive | 2.49 | 0 | 1.90–3.27 | 1.84 | 0 | 1.46–2.32 |
| Liver, pancreas | 1.35 | .049 | 1.00–1.83 | 1.18 | .192 | 0.92–1.53 |
| Musculoskeletal | 2.16 | 0 | 1.59–2.95 | 1.86 | 0 | 1.44–2.40 |
| Skin, breast | 1.88 | 0 | 1.41–2.51 | 1.78 | 0 | 1.40–2.26 |
| Metabolic | 3.82 | 0 | 2.77–5.26 | 2.97 | 0 | 2.26–3.91 |
| Kidney | 1.84 | 0 | 1.38–2.45 | 2.03 | 0 | 1.59–2.59 |
| Male reproductive | 1.77 | .015 | 1.12–2.79 | 1.66 | .006 | 1.16–2.37 |
| Female reproductive | 1.44 | .006 | 1.11–1.87 | 1.50 | 0 | 1.21–1.87 |
| Pregnancy, childbirth | 3.11 | 0 | 2.24–4.33 | 2.46 | 0 | 1.85–3.28 |
| Blood | 1.78 | .002 | 1.24–2.54 | 2.57 | 0 | 1.97–3.34 |
| Myeloproliferative diseases | 2.51 | 0 | 1.86–3.38 | 2.15 | 0 | 1.68–2.74 |
| Injuries, poisonings | 3.14 | 0 | 2.21–4.47 | 2.64 | 0 | 1.96–3.54 |
| Health status | 1.39 | .023 | 1.05–1.84 | 1.07 | .58 | 0.85–1.35 |
| Others | 6.11 | 0 | 4.03–9.26 | 4.93 | 0 | 3.47–7.00 |
| Cons | 0.00 | 0 | 0.00–0.00 | 0.00 | 0 | 0.00–0.01 |
Abbreviations: ASC, ambulatory surgery center; CI, confidence interval; CMS-HCC, Centers for Medicare and Medicaid Services-Hierarchical Condition Category; CPT, Current Procedure Terminology; MDC, Major Diagnostic Category; OR, odds ratio.
Peer Review:
Four peer reviewers contributed to the peer review report. Reviewers’ reports totaled 886 words, excluding any confidential comments to the academic editor.
Funding:
The author(s) disclosed receipt of the following financial support for the research, authorship, and/or publication of this article: This research was funded in part by an unrestricted research grant from the Florida Society of Ambulatory Surgery Centers.
Declaration Of Conflicting Interests:
The author(s) declared no potential conflicts of interest with respect to the research, authorship, and/or publication of this article.
Author Contributions
RLO, PL, and JES conceived and designed the experiments, jointly developed the structure and arguments for the paper, and made critical revisions and approved the final version. PL, IS, and CS analyzed the data. RLO, PL, IS, and CS wrote the first draft of the manuscript. JES contributed to the writing of the manuscript. RLO, PL, JES, IS, and CS agree with the manuscript results and conclusions. All authors reviewed and approved the final manuscript.
Disclosures and Ethics
As a requirement of publication, author(s) have provided to the publisher signed confirmation of compliance with legal and ethical obligations including, but not limited to the, following: authorship and contributorship, conflicts of interest, privacy and confidentiality, and (where applicable) protection of human and animal research subjects. The authors have read and confirmed their agreement with the ICMJE authorship and conflict of interest criteria. The authors have also confirmed that this article is unique and not under consideration or published in any other publication, and that they have permission from rights holders to reproduce any copyrighted material. Any disclosures are made in this section. The external blind peer reviewers report no conflicts of interest.