
Abstract
Background:
High-resolution meteorological exposure assessment is essential for individual-level environmental epidemiology. However, clear methodological guidance on the optimal spatial interpolation technique for daily meteorological variables at the national scale remains limited.
Methods:
Using daily observations from 2417 national meteorological stations across mainland China from 2010 to 2021, we systematically benchmarked 2 widely used spatial interpolation methods—Inverse Distance Weighting (IDW) and Ordinary Kriging (OK). Twelve representative days capturing seasonal variability were selected, and 10-fold cross-validation was conducted. Interpolation performance was evaluated using root mean squared error (RMSE), standardized mean absolute percentage error (sMAPE), Nash–Sutcliffe efficiency (NSE), bias, and computation time.
Results:
Across 12 representative days from 2010 to 2021, IDW consistently outperformed OK in national-scale 10-fold cross-validation. For daily mean temperature, IDW achieved lower prediction errors, with RMSE ranging from 1.52°C to 1.75°C, compared with 1.50°C to 1.81°C for OK, and consistently higher NSE values (0.83-0.97 vs 0.82-0.97). Similar performance advantages were observed for relative humidity. Bias estimates were close to zero for both methods, indicating minimal systematic error. In addition, IDW showed modest computational advantages, with average processing times of approximately 96 s/day, compared with approximately 99 s/day for OK, supporting its suitability for large-scale meteorological exposure reconstruction in epidemiological studies.
Conclusions:
From an epidemiological exposure assessment perspective, IDW provides a favorable balance between accuracy, computational efficiency, and preservation of spatial variability. These findings offer practical methodological guidance for large-scale individual-level meteorological exposure modeling in climate–health research.
Keywords
Introduction
Global warming has emerged as one of the most significant environmental threats to human health, influencing a wide range of morbidity and mortality outcomes through both acute and chronic pathways. 1 Understanding the health effects of meteorological variables such as temperature and humidity has therefore become central to climate-health research and public health adaptation strategies.
Most epidemiological studies assessing meteorological impacts on health rely on area-level exposure metrics, aggregated at administrative units such as cities or counties.2,3 Although convenient, these approaches inevitably introduce exposure misclassification by failing to capture substantial spatial heterogeneity within administrative boundaries. 4 This limitation is particularly problematic for short-term exposure assessments, where fine-scale spatial variability may meaningfully influence estimated health effects. To address this issue, individual-level time-stratified case-crossover designs have been increasingly adopted, requiring spatially continuous, high-resolution meteorological exposure data.5 -8
In practice, meteorological observations are collected at discrete monitoring stations, which are unevenly distributed in space, even in countries with extensive observation networks such as China. 7 Spatial interpolation techniques are therefore required to transform point-based observations into continuous exposure surfaces. Among commonly used approaches, inverse distance weighting (IDW) and ordinary kriging (OK) are the 2 most frequently applied methods due to their simplicity and interpretability.9 -11 However, despite widespread application, there is no consensus on which method is more suitable for individual-level exposure assessment, particularly at the national scale and for long-term daily data. Existing studies often focus on local or regional scales, climatological averages, or engineering applications, and rarely evaluate interpolation performance from an epidemiological perspective. Systematic national-scale benchmarking of interpolation methods for individual-level meteorological exposure assessment remains limited, especially in regions with pronounced climatic and geographic heterogeneity such as China.
To address this methodological gap, the present study conducts a nationwide evaluation of IDW and OK using daily observations from 2417 meteorological stations across mainland China. We compare interpolation accuracy, computational efficiency, and spatial smoothness, with a specific focus on their suitability for individual-level exposure assessment in environmental health studies.
The specific objectives of this study are to:
Systematically benchmark commonly used spatial interpolation methods for daily meteorological variables at the national scale;
Evaluate their performance from an epidemiological exposure modeling perspective, emphasizing accuracy, stability, and computational feasibility;
Provide practical methodological guidance for selecting interpolation approaches in individual-level climate–health research.
Materials and Methods
Study Area and Data
Daily meteorological observations were obtained from the China Meteorological Administration (CMA), covering 2417 national-level surface observation stations across mainland China from 2010 to 2021. Stations located in Hong Kong, Macao, and Taiwan were excluded. The dataset includes station location (latitude and longitude) as well as daily mean temperature and daily mean relative humidity.
China was selected as the study area due to its vast geographic extent, pronounced climatic gradients, and heterogeneous distribution of meteorological stations, making it an ideal setting for national-scale interpolation benchmarking.
To capture seasonal variability while maintaining computational feasibility, the first day of each month over the 12-year study period was selected as representative days for interpolation analysis.
Inverse Distance Weighted (IDW)
IDW estimates values at unsampled locations as a weighted average of surrounding observations, with weights inversely proportional to distance between locations. This approach assigns greater influence to nearby stations and is well suited for preserving local spatial variability. 12 Model parameters were optimized empirically based on cross-validation performance, with details provided in the Supplemental Methods.
Ordinary Kriging (OK)
OK is a geostatistical interpolation method that explicitly models spatial autocorrelation through a variogram. In this study, a spherical variogram model was fitted to characterize spatial dependence. OK provides unbiased predictions with minimized estimation variance but typically produces smoother spatial surfaces compared with distance-based methods. 10 Additional methodological details are provided in the Supplemental Methods.
Model Evaluation and Cross-Validation
Ten-fold cross-validation was conducted for each representative day. Stations were randomly partitioned into 10 subsets, with 9 subsets used for model training and the remaining subset for validation. This process was repeated until all subsets served once as validation data.
Interpolation performance was evaluated using multiple complementary metrics, including root mean squared error (RMSE), standardized mean absolute percentage error (sMAPE), Nash–Sutcliffe efficiency (NSE), bias, and computation time. These indicators jointly assess predictive accuracy, relative error, variance representation, systematic bias, and computational efficiency. Formal definitions of all evaluation metrics are given in the Supplemental Methods.
Assumptions of the Study
This study assumes that meteorological variables exhibit distance-decay spatial dependence and that station-level observations are representative of surrounding areas at the selected spatial resolution. Interpolation errors are assumed to be temporally stable and non-differential with respect to health outcomes, implying that residual exposure measurement error would primarily attenuate effect estimates rather than introduce systematic bias.
Software and Computational Environment
All analyses were conducted using R software (version 4.1.2). Spatial interpolation and geostatistical modeling were implemented using the “gstat” package, while spatial data processing, raster manipulations, and administrative masking were performed using the “sf,” “raster,” and “sp” packages. Data visualization was generated using “ggplot2,” complemented by “ggspatial” for geographic annotations and “cowplot” for the composition of multi-panel maps. All computational procedures were executed on a workstation equipped with an Intel i5 processor and 8 GB of RAM.
Results
Meteorological Station Coverage and Data Characteristics
A total of 2417 ground-based meteorological stations across mainland China were included. After preprocessing daily data from January 1, 2010 to December 31, 2021 (4383 days), 10 098 269 valid daily mean temperature records and 10 548 687 daily mean relative humidity records were retained, with missingness rates of 4.67% and 0.43%, respectively (Table 1). The low proportion of missing data (<5%) indicates high data completeness and suitability for nationwide spatial interpolation.13,14
Descriptive Statistics of Meteorological Station Coverage and Observed Meteorological Variables.

Station coverage was spatially heterogeneous. The mean nearest-neighbor distance was 33.76 km (SD: 23.27 km), ranging from 3.70 km in densely monitored regions to 365.87 km in sparsely covered areas. A grid resolution of 15 km × 15 km was therefore adopted to balance spatial representativeness and computational feasibility for nationwide individual-level climate–health analyses.15,16
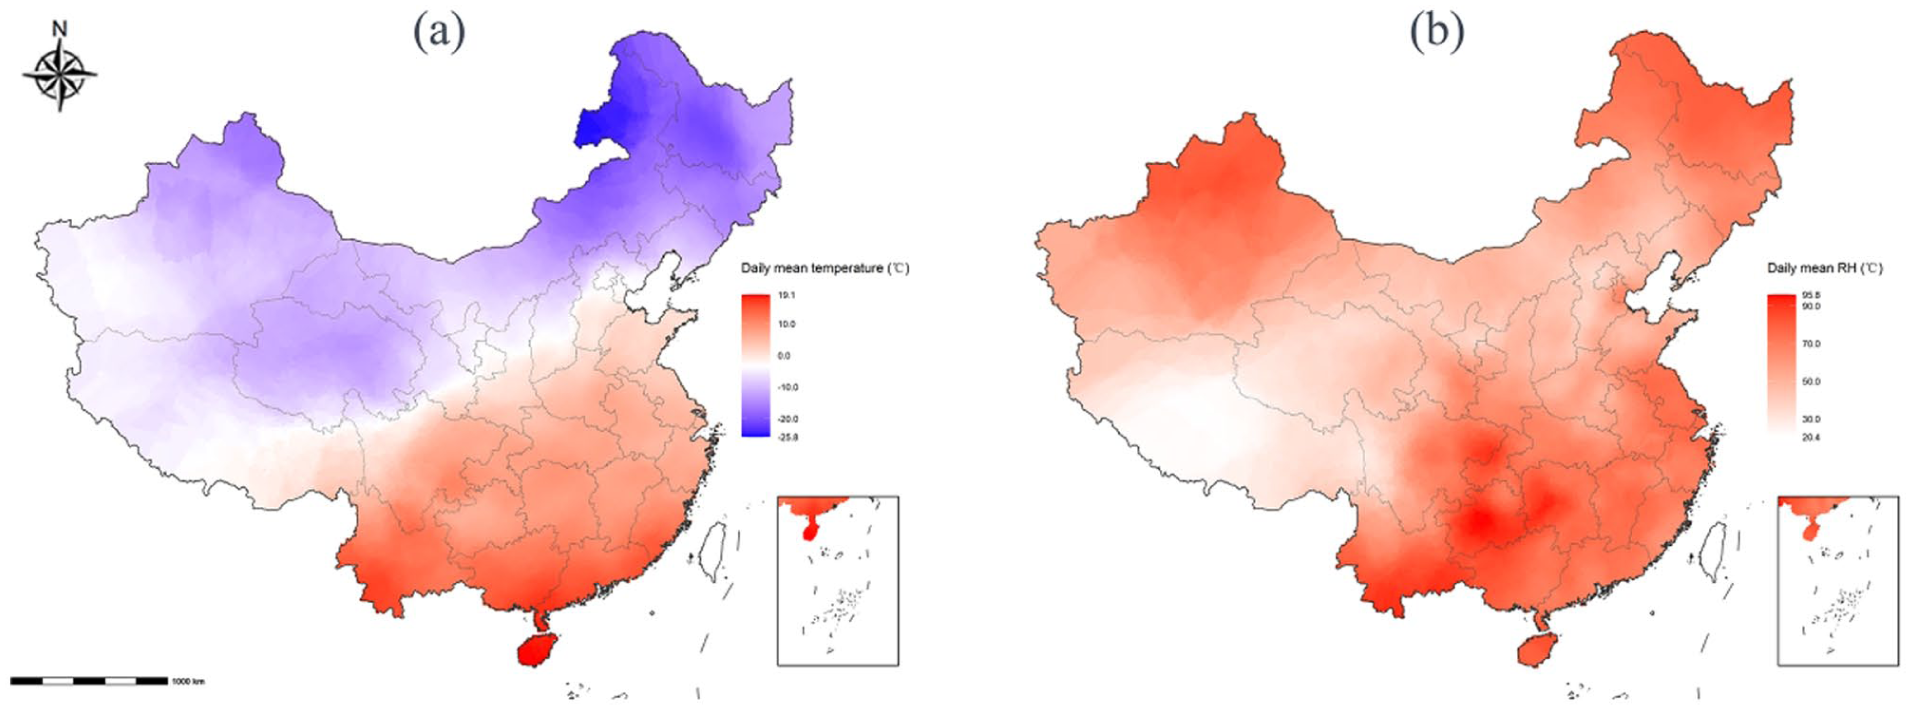
Daily mean temperature ranged from −44.6°C to 42.3°C (mean: 13.75°C; SD: 11.33°C; CV: 0.82), reflecting substantial spatial and seasonal heterogeneity. Daily mean relative humidity ranged from 0 % to 100% (mean: 67.63%; SD: 18.73%; CV: 0.28), indicating moderate spatial variability. Slightly heavy-tailed distributions were observed for both variables (Kurtosis: 3.19 for temperature; 2.75 for humidity). Thematic maps for January 1, 2018 illustrate denser station coverage in southeastern China and sparser coverage in the northwest, accompanied by marked geographic contrasts in temperature and humidity (Figure 1).

Spatial distribution of meteorological stations and observed meteorological variables in mainland China: (a) daily mean temperature and (b) daily mean relative humidity (example day: January 1, 2018).
Interpolation Performance and Validation
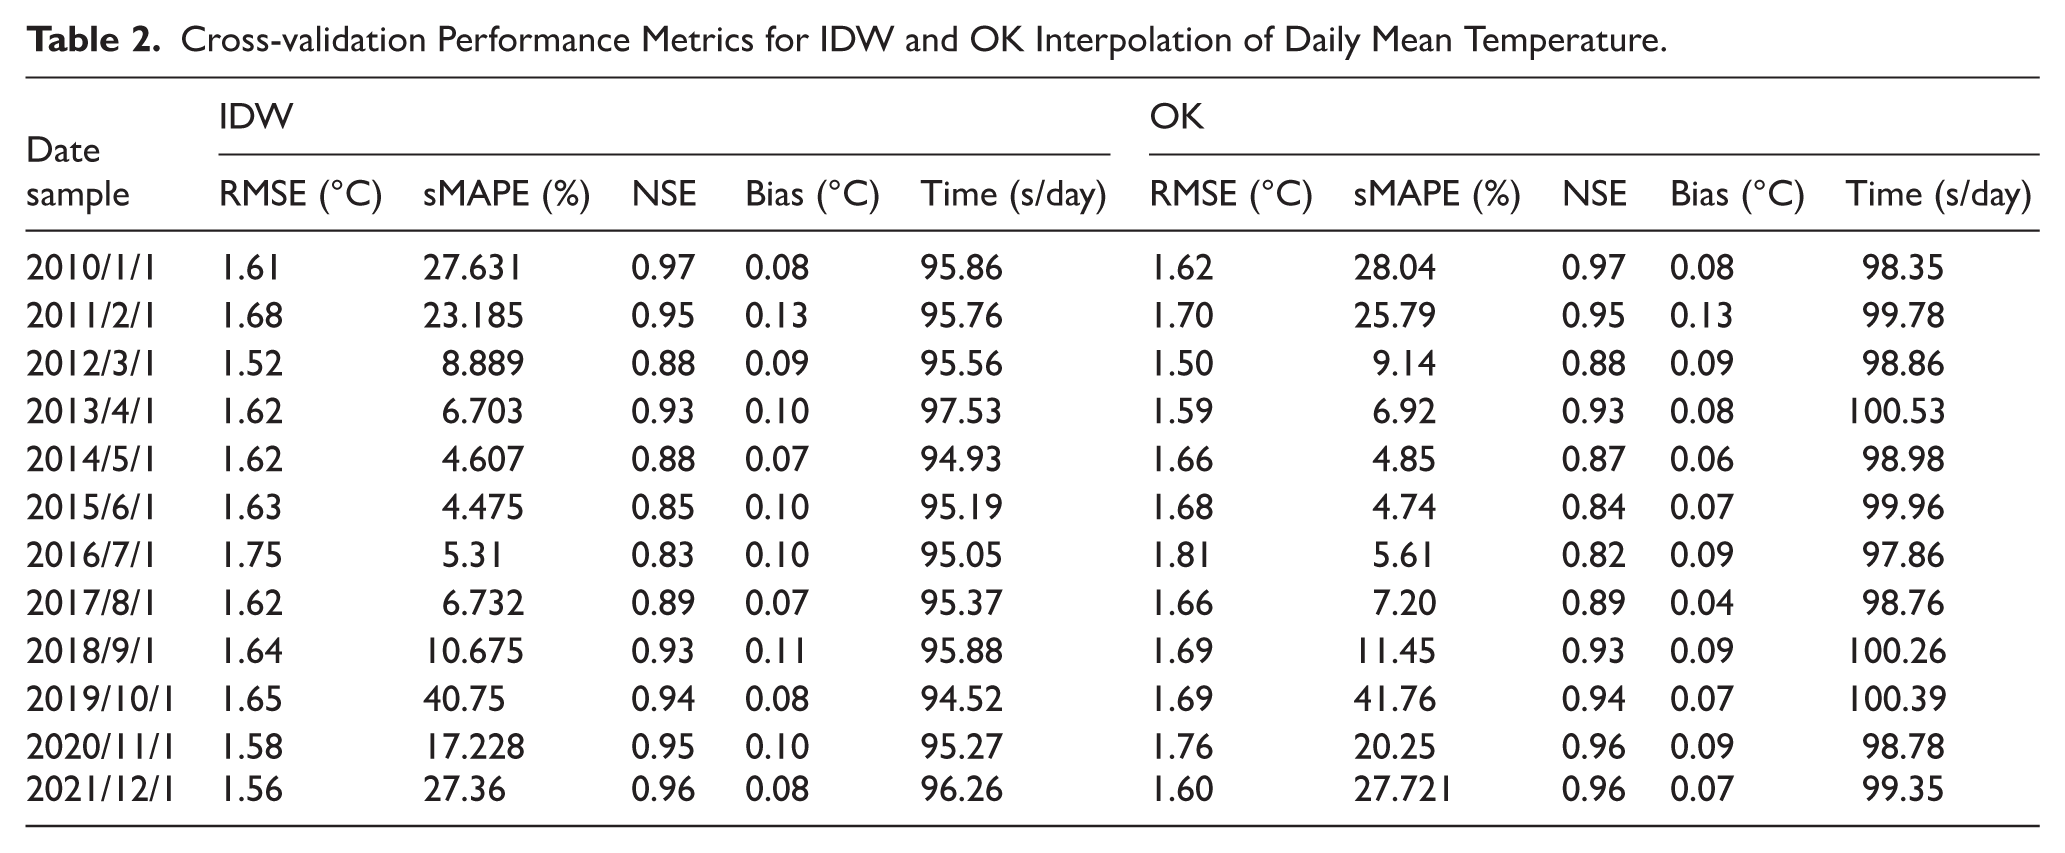
Ten-fold cross-validation across 12 representative days showed that IDW consistently achieved slightly better predictive performance than OK for both temperature and relative humidity (Table 2). Across validation sets, IDW yielded lower RMSE and sMAPE values and marginally higher NSE values, indicating improved predictive accuracy and variance representation relative to OK. Bias estimates were close to zero for both interpolation methods, suggesting minimal systematic over- or underestimation. Overall, IDW demonstrated modestly higher national-scale predictive performance compared with OK.
Cross-validation Performance Metrics for IDW and OK Interpolation of Daily Mean Temperature.
Spatial Characteristics and Computational Efficiency
The 2 interpolation methods produced distinct spatial patterns. OK generated smoother prediction surfaces with gradual spatial transitions, whereas IDW preserved stronger local gradients and fine-scale variability, including localized extrema near monitoring stations (Figures 2 and 3).
Spatial interpolation surfaces generated using ordinary kriging (OK): (a) daily mean temperature and (b) daily mean relative humidity.
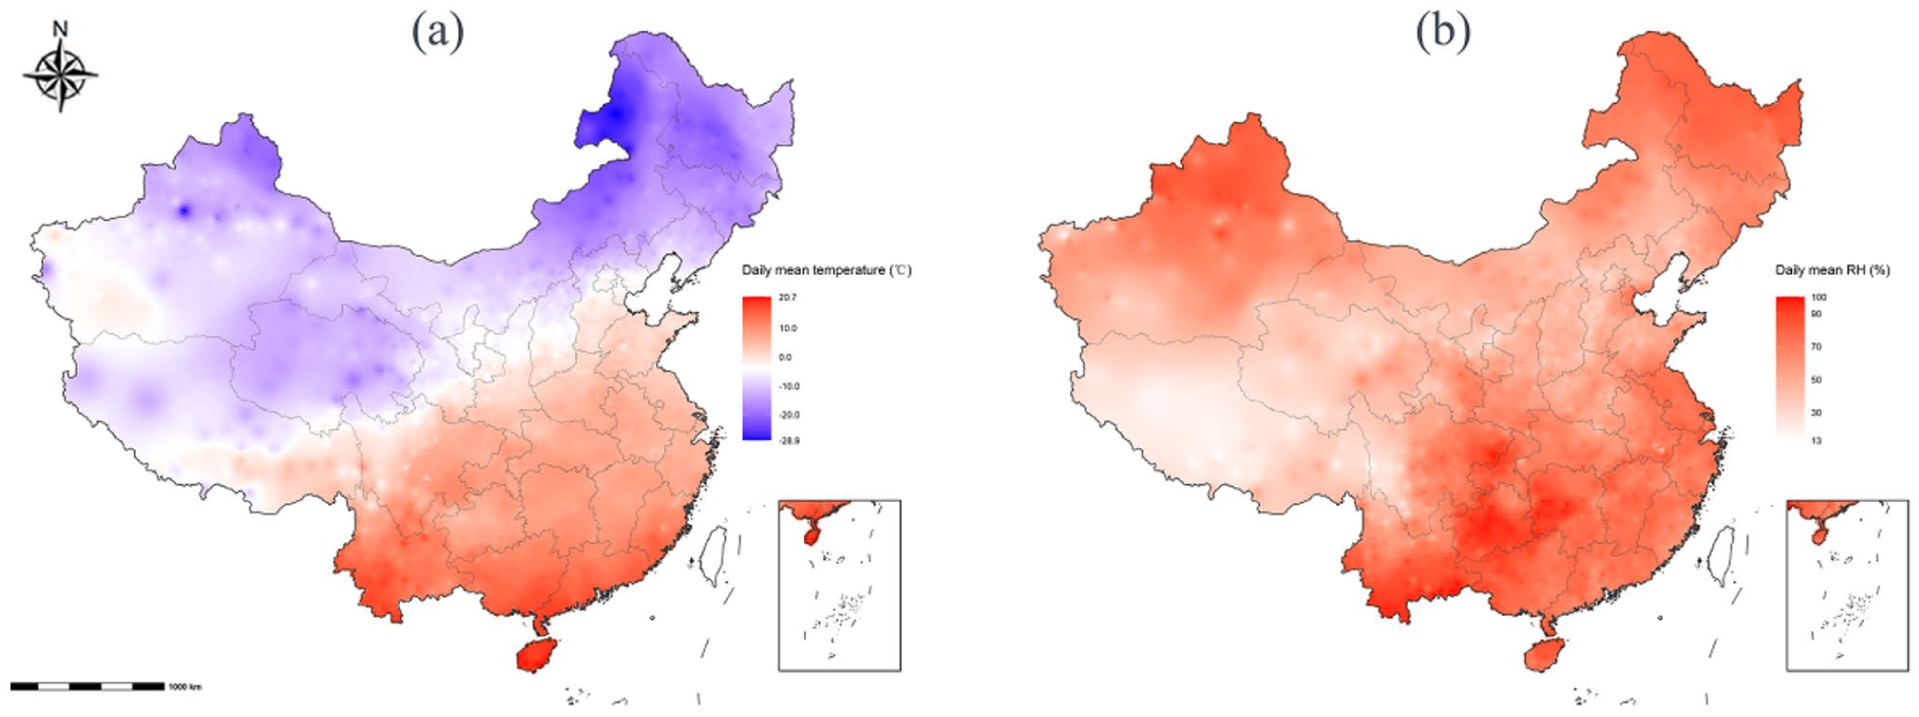
Spatial interpolation surfaces generated using inverse distance weighting (IDW): (a) daily mean temperature and (b) daily mean relative humidity.
IDW also showed slightly higher computational efficiency. For daily mean temperature, the mean processor fitting time was 95.60 ± 0.77 s/day for IDW compared with 99.32 ± 0.86 seconds for OK (Table 2).
Comparison of Interpolated Values and Zonal Statistics
For daily mean temperature, the observed station-level range exceeded that of IDW-interpolated surfaces, which in turn exceeded the range produced by OK, indicating progressive smoothing from observations to IDW and then to OK. A similar pattern was observed for relative humidity. These results suggest that IDW better preserves local spatial variability, while OK produces more attenuated surfaces.
Zonal statistics derived from IDW-interpolated surfaces showed decreasing ranges as administrative units became coarser, with the largest variability observed at district and county levels and the smallest at the provincial level (Figure 4). This pattern was consistent for both temperature and relative humidity, indicating that finer spatial aggregation yields exposure estimates closer to observed station-level values.

Zonal statistics of IDW-interpolated meteorological variables across administrative levels: (a-c) daily mean temperature and (d-f) daily mean relative humidity at the provincial, prefecture-level city, and district/county levels.
Discussions
This nationwide benchmarking study provides empirical evidence to inform the selection of spatial interpolation methods for meteorological exposure assessment in large-scale climate–health research. Although both methods demonstrated generally good performance, IDW consistently showed advantages in predictive accuracy, preservation of spatial heterogeneity, and computational efficiency. When evaluated from an individual-level epidemiological perspective, these factors make IDW more suitable than OK for interpolating daily mean temperature and relative humidity across mainland China. Therefore, this nationwide benchmarking study provides empirical evidence to inform the selection of spatial interpolation methods for meteorological exposure assessment in large-scale climate–health research.
Previous studies have similarly reported favorable performance of distance-based interpolation methods for environmental exposure assessment, especially for variables characterized by strong spatial continuity and relatively dense monitoring networks.10,17 -20 Unlike geostatistical approaches that rely on fitted variogram models, IDW does not require assumptions of stationarity or isotropy, which may be difficult to satisfy in geographically and climatically heterogeneous settings such as China.10,11,21 The robustness of IDW under such conditions enhances its applicability for nationwide exposure modeling.
From an environmental epidemiology perspective, the preservation of local spatial variability is of central importance. Excessive spatial smoothing of exposure surfaces can lead to exposure misclassification and attenuation of estimated exposure–response relationships, particularly in short-term studies employing case-crossover or time-series designs.22 -25 By retaining localized maxima and minima, IDW-generated exposure surfaces better capture small-scale exposure contrasts that are epidemiologically relevant for individual-level analyses.
Although OK is theoretically optimal when the underlying spatial covariance structure is correctly specified, it produced smoother prediction surfaces with reduced spatial variance in the present study. Similar observations have been reported in previous comparative analyses, where kriging methods were shown to underestimate local extremes when applied to meteorological variables influenced by complex terrain or nonstationary spatial processes.26 -28 While such smoothing may be advantageous for climatological mapping or regional trend analysis, it may be less suitable for estimating short-term exposure variability relevant to health outcome modeling.
Computational efficiency represents an additional practical consideration. Nationwide exposure reconstruction over extended study periods requires interpolation of tens of thousands of daily surfaces. The shorter computation time observed for IDW improves its feasibility for large-scale epidemiological applications, an issue that has been increasingly emphasized in recent climate–health studies utilizing high-resolution exposure datasets.29,30
Several limitations merit consideration. First, uncertainty quantification was not explicitly addressed, as IDW does not provide prediction variance estimates comparable to kriging-based approaches. Second, only classical interpolation methods were evaluated; hybrid or machine-learning-based approaches, such as random forest or deep learning models, may further improve predictive performance but often at the cost of interpretability and computational burden. 18 Third, this study focused on daily mean temperature and daily mean relative humidity, and findings may not be directly generalizable to other meteorological variables or regions with substantially sparser monitoring networks.
Conclusions
This nationwide benchmarking study provides critical methodological evidence for selecting spatial interpolation approaches in climate–health research. The key conclusions are summarized as follows:
Overall Performance Comparison: Both IDW and OK demonstrated good predictive performance at the national scale. However, IDW consistently achieved slightly higher predictive accuracy while maintaining comparable stability across diverse climatic conditions.
Preservation of Spatial Variability: IDW better preserved local spatial gradients and extreme values, whereas OK generated smoother surfaces. This distinction is vital for environmental epidemiology as excessive smoothing may lead to exposure misclassification.
Computational Feasibility: IDW exhibited meaningful computational advantages. Given the burden of long-term, nationwide reconstruction, IDW offers a more pragmatic solution for large-scale applications.
Guidance for Exposure Assessment: In dense but heterogeneous networks (like China’s), IDW provides an optimal balance between accuracy and efficiency, making it particularly suitable for individual-level exposure modeling.
Broader Relevance & Future Directions: These insights extend to environmental monitoring and risk mapping. Future work should explore uncertainty quantification and machine-learning-based approaches to further refine estimation.
Supplemental Material
sj-docx-1-ehi-10.1177_11786302261433113 – Supplemental material for Benchmarking Spatial Interpolation Methods for Long-Term Meteorological Exposure Assessment in China: Comparing Inverse Distance Weighting and Ordinary Kriging in Climate-Health Research
Supplemental material, sj-docx-1-ehi-10.1177_11786302261433113 for Benchmarking Spatial Interpolation Methods for Long-Term Meteorological Exposure Assessment in China: Comparing Inverse Distance Weighting and Ordinary Kriging in Climate-Health Research by Rui Zhang, Yonghong Li, Mulei Chen, Huan Zheng, Jia Zhao, Shaoqiong Li, Lizhu Jin, Xuejie Du, Chaonan Wang, Siyuan Wu and Songwang Wang in Environmental Health Insights
Footnotes
Author Contributions
RZ: Writing – original draft, Software, Methodology, Formal analysis. CM, ZH, ZJ, LS, JL, DX, and WC: Software, Methodology, Formal analysis. WSY: Writing – original draft, Visualization. YL and WSW: review & editing, Conceptualization, Funding acquisition. All authors approve the final version of the manuscript.
Funding
The authors disclosed receipt of the following financial support for the research, authorship, and/or publication of this article: This work was supported by the National Key Research and Development Program of China (2022YFC2602301) and the Science and Technology Fundamental Resources Investigation Program of China (2017FY101201).
Declaration of Conflicting Interests
The authors declared no potential conflicts of interest with respect to the research, authorship, and/or publication of this article.
Supplemental Material
Supplemental material for this article is available online.
Code Availability
The custom code used can be made available upon request.
References
Supplementary Material
Please find the following supplemental material available below.
For Open Access articles published under a Creative Commons License, all supplemental material carries the same license as the article it is associated with.
For non-Open Access articles published, all supplemental material carries a non-exclusive license, and permission requests for re-use of supplemental material or any part of supplemental material shall be sent directly to the copyright owner as specified in the copyright notice associated with the article.