
Abstract
Water pollution poses risks to health and livelihoods of communities that depend on river systems. The major rivers in Ghana have experienced significant pollution, but limited studies have examined water quality conditions and community perceptions of pollution sources. This study assessed water quality and community perceptions of major rivers in Ghana. Water samples from 6 major rivers were analysed for physical, chemical, and biological parameters based on APHA Standard Methods for Water Examination (22nd Edition). A survey was conducted on 400 residents using a stratified random sampling technique. ANOVA, Pearson correlation, PCA, and regression were employed to process the data. Analysis revealed arsenic (0.58-0.67 mg/L), lead (0.66-0.95 mg/L), mercury (0.10-0.14 mg/L), and E. coli (up to 1349.75 MPN/100 mL) concentrations. Nitrate increased from 15.12 mg/L upstream to 19.06 mg/L downstream, while E. coli was high midstream (1349.75 MPN/100 mL). Principal Component Analysis (PCA) identified arsenic, lead and mercury as major contributors to overall water pollution. Age, Education level, and gender influence pollution perceptions (R2 = .654-.69). Mining activities (59%) dominated water pollution compared to industrial discharges, agricultural runoff, and domestic sewage. Effective strategies identified included stricter regulations (97.14%), sustainable farming (97.14%), and community campaigns (95.71%). Findings revealed that river pollution contributes significantly to economic, health, and psychological issues. Public awareness and demographic characteristics shape pollution perception, behaviour and policy responses. The Environmental Protection Agency (EPA), the Ministry of Sanitation and Water Resources, and the Water Resources Commission (WRC) should prioritise stricter regulations, sustainable practices, and community engagement to protect rivers in Ghana.
Keywords
Background to the Study
River resources have become crucial in ensuring safe drinking water, good sanitation and hygiene, and promoting food production, economic growth and development. However, river pollution has become a major global, national and local issue due to industrialisation, human population growth, its root cause, and associated health risks. River pollution contributes significantly to about 80% of global waterborne diseases, including cholera, cryptosporidiosis, diarrhoea, and typhoid.1-3 According to the World Health Organisation, 3 it contributes to approximately 1.2 million deaths annually, specifically among children under 5 years old. This threatens the achievement of the United Nations Sustainable Development Goals (SDGs), particularly SDG 6 (Clean Water and Sanitation), SDG 14 (Life Below Water), and SDG 15 (Life on Land).4-7 Globally, laws and wastewater treatment plants have been designed to control the discharge of pollutants.8-10 Similarly, community-led programmes, including river clean-up campaigns, have been promoted to ensure environmental awareness.11,12 However, weak enforcement of regulations, lack of adequate and efficient wastewater treatment plants, and economic reasons, as well as sporadic and very short-lived efforts without adequate sustained support, have impeded the success of some of these efforts.13-15
Custodio et al 16 and Ouma et al 17 revealed that unregulated mining activities in regions such as South America discharge hazardous substances, heavy metals (mercury and arsenic), and sediments in nearby rivers. The Yangtze River in China and the Amazon Basin in South America, among the largest rivers in the world, have experienced a significant decline in water quality as a result of elevated human and industrial activities.18,19 The level of pollution in the Surabaya River, a major river of Surabaya in Indonesia, has increased greately beyond human consumption.20,21 This has significantly affected freshwater ecosystems, posing risks to biodiversity, human health, agriculture, and economic stability, particularly in regions with limited technological capacity. The World Health Organisation (WHO), 3 Inyinbor Adejumoke et al, 22 Ogidi and Akpan, 23 and Kay et al 24 claimed that the pollution of rivers affects agricultural productivity by reducing crop yield, as a result of toxic substances absorbed through contaminated rain irrigation, leading to food poisoning and economic losses among growers of the produce. 25 Moreover, the industrial sectors, especially those that rely on the use of freshwater for manufacturing and processing, face increased production costs due to water purification requirements. 25 The total global economic impact of health problems due to contaminated water exceeds $260 billion/year, particularly in developing nations. 3
Water pollution in Ghana has become an alarmingly serious issue with the presence of heavy metals, plastics and sediment entering the major rivers. 26 About 60% of rural Ghana rely on untreated surface water sources containing emerging pollutants.27,28 Ghana Water Company and the Ghana Health Service indicated that the remaining 40% of the rural water sources are unsafe for drinking purposes due to the presence of a considerable amount of microbial contaminants. 29 Industrialisation, unauthorised mining activities and farmland runoff also affect water quality of Ankobra, Pra, and Volta Rivers.30-32 Shockingly, studies have revealed high concentrations of mercury in both the Pra and Ankobra Rivers, exceeding WHO recommendations for safe drinking.33-36 According to the findings of these studies, this high concentration results in serious health risks, including mercury poisoning, for communities that depend on them for drinking and fishing.
Karikari et al 37 proved that river pollution in Ghana has contributed to the occurrence of poor bone and child formation, absence of body parts at birth, and respiratory, kidney, and cardiovascular diseases. Agricultural practices also exacerbate the problem of water pollution by releasing harmful Escherichia coli (E. coli), nitrates, and phosphates into water sources. This increases the likelihood of cholera, dysentery, and gastroenteritis outbreaks. 38 These health risks necessitate urgent interventions, as projections suggest that Ghana may be forced to import potable water by 2030 if pollution trends persist. 39 Farmers who use polluted river water for irrigation experience reduced soil fertility and lower crop yields due to contamination from nitrates, phosphates, turbidity, and industrial chemicals. Additionally, the elevated levels of turbidity caused by sedimentation and pollution in the waters not only affect the aquatic life but also lead to a decline in fish population, which plays a crucial role in the diet and economy of many Ghanaian communities.
The Ghanaian government introduced various initiatives to protect the river bodies. These include a media campaign launched in 2017 called “Stop Galamsey,” aimed at raising the level of awareness among the populace about the destruction caused by environmental degradation emanating from illegal mining activities.40-42 Nevertheless, such efforts criminalise and stigmatise artisanal small-scale miners rather than providing a solution to the water pollution created by such activities. Additionally, the government established the Minerals and Mining Act of 2006 and the Inter-Ministerial Committee on Illegal Mining to control small-scale miners and ensure that the country’s environment is properly governed. 43 Additionally, it has established the Community Mining Scheme and the National Alternative Employment and Livelihood Programme. These not only form the solution to providing minimal miners with the chance to mine legally, but it has further established socio-economic interventions such as the Youth in Agriculture Programme and Alternative Livelihood Projects.44,45 These projects train the involved miners to shift their roles to legitimate job opportunities. Nevertheless, the above-mentioned efforts have been hampered by inadequate law enforcement and corruption within the involved agencies.
Land and water resource restoration initiatives, such as the Ghana Landscape Restoration and Small-Scale Mining Project (GLRSSMP), focus on the restoration and rehabilitation of the affected land and water bodies but are also hampered by the sustainability of the project.46,47 Projections indicate that Ghana could face severe water scarcity by 2030 if current pollution trends persist. 48 However, the most important question at this juncture is how Ghana can sure that there is no water crisis in the future despite the water pollution and degradation of the environment at the current moment. Darko et al 49 examined water quality issues in urban rivers in Kumasi and found significant contamination by heavy metals such as arsenic (As), cadmium (Cd), and lead (Pb). Alhassan et al 50 and Yirenkyi-Fianko and Ottou 51 studied water pollution in Birim River in the Eastern part of the country, detecting a high concentration of arsenic, mercury, and lead elements in water sources around the mining communities. Egbi et al 52 assessed water quality in the Volta River and reported significant increase in mercury concentrations in water bodies near artisanal gold mining areas. Craswell 53 assessed water pollution level in major water bodies in the Western Region, measuring the contribution of agricultural runoffs to nitrate and phosphate concentrations. The findings indicated that water bodies in close proximity to farming communities exhibited significantly higher concentrations of these nutrients. However, these studies and others are usually centred on specific regions and rivers.
According to Amponsah et al. 54 Lima et al. 55 and Vasistha and Ganguly, 56 the lack of complete assessment of the physical, chemical and biological water pollution indicators across many rivers over extended periods makes it difficult to evaluate the full extent of water pollution and its impact on aquatic ecosystems. Additionally, Olisah et al 57 and Xu et al58,59 asserted that variability in approaches and the failure to consider seasonal variations significantly impact the concentration of pollutants. This could hinder policymakers and organisations from providing evidence-based policies to control and mitigate water pollution. There is a need to track changes in pollution levels, quantify the exact sources of pollution and their spatial distribution across major river basins (Ankobra, Bia, Densu, Pra, Tano, and Volta) in Ghana. Nonetheless, Anthonj et al, 60 Benameur et al, 61 and Mustafa et al 62 found that understanding public awareness and behavioural responses to water contamination is key to informing policy interventions and improving public health. Despite growing awareness of water pollution, traditional ecological knowledge and local perceptions about water resource management among Ghanaian communities are often given less attention in modern environmental management approaches. 63
Very few studies, according to the review, have investigated the local perception of water pollution as well as its impact on the health of local communities, as noted by Abraham et al, 46 Baffoe et al, 48 and Abanyie et al. 64 This implies that local perceptions of the major rivers in Ghana is very low. Therefore, studies are needed to integrate local knowledge into modern water management strategies and track shifts in public attitudes and behaviours regarding water quality, pollution prevention and conservation efforts. The purpose of the study is to examine the current state of water quality and identify pollution sources and perceptions of major rivers in Ghana. The study seeks to (1) assess the physical, chemical, and biological quality of water in the 6 major rivers, and (2) determine the primary sources of pollution affecting the rivers.
Furthermore, the study aims to (3) examine the views of local communities on water pollution and its effects. In addition, the study aims to explore the practical approaches towards improved water management and pollution control, based on local and international best practices for sustainable development. The findings of this study provide scientific information on health hazards associated with water pollution, hence providing a scientific basis for efforts aimed at improving water management, pollution control, and health education of the public. This study also contributes to the achievement of Ghana’s national development priorities and the Sustainable Development Goals (SDGs) and provides necessary data for policymakers to develop effective strategies for improving water quality and public health.
Materials and Methods
Research Design
A quantitative cross-sectional design was employed to assess the levels of pollution and perceptions influencing the pollutants in major rivers in Ghana. This design allows the collection of data at 1 point in time only. It measured pollutant concentrations, water quality indicators, and obtained data on community perceptions via structured surveys and the sampling of water (see Figure 1). Water samples were collected from 6 major rivers in strategically three (3) chosen sampling points: upstream, midstream, and downstream, to capture variations in pollution levels. Laboratory analysis measured pollutant concentrations, water quality indicators, presence of heavy metals and microbial contaminants. This provides an efficient impact on the assessment of pollution sources affecting the river ecosystems.

Method flowchart.
Community perceptions (households, fishermen, and farmers) regarding the water quality of rivers (for drinking water, fishing, agriculture and health risks) were measured using a structured questionnaire. The questionnaire consisted of closed-ended questions, including Likert-scale items assessing knowledge of sources of pollution, attitude towards water conservation, and awareness of health risks associated with the rivers. This method ensured that responses could be quantified and statistically analysed to determine how awareness and behaviours correlate with pollution levels in affected communities. However, the cross-sectional design allowed for the comparative assessment between pollution levels and public perceptions. This study design ensured that environmental and social data were simaltaneously collected, allowing statistical analysis of the relationships between pollution levels and community awareness and behavioural patterns. Additionally, the design was cost-effective and efficient in gathering data quick, which is particularly beneficial in rural areas where extended data collection could pose logistical challenges.
Population and Study Area
The study population included major rivers and communities (households, fishermen, and farmers) along the rivers. The rivers consisted of River Pra, Densu, Tano, Ankobra, Bia, and Volta. Pra River flows through Dunkwa on Offin, Twifo Praso, and Beposo, where mining activities have significantly affected water quality. Densu River sustains communities such as Nsawam, Amasaman, and Weija, which are endangered by urbanisation and mismanaged domestic waste. Tano River sustains communities including Ntotroso, Techiman, and Elubo, which have impaired quality of water due to agricultural runoff. Ankobra River supports Prestea, Ankwaaso, and Dominase communities that have been threatened by the mining activities. Ankobra River flows through Prestea, Ankwaaso, and Dominase, and is impacted by mining operations. Ankobra River is one of the sources of water for Prestea, Ankwaaso, and Dominase communities and its quality has been influenced by mining effluent. Bia River is close to Dadieso, Kwadwo Addaikrom, and Pomakrom and is threatened by pollutants from agricultural sources such as deforestation and pesticides. Volta River is a source of drinking water for Akosombo, Sogakope, and Kete Krachi and is exposed to pollutants from industries, agricultural runoff, and domestic sewage. These rivers are assessed to better understand the impact of human activity on their quality, as their deterioration poses risks to biodiversity, public health, agriculture, and economic development in Ghana (Figure 2).

Study area.
This study covered eighteen communties (Dunkwa on Offin, Twifo Praso, Beposo, Nsawam, Amasaman, Weija, Ntotroso, Techiman, Elubo, Prestea, Ankwaaso, Dominase, Dadieso, Kwadwo Addaikrom, Pomakrom, Akosombo, Sogakope and Kete Krachi). Dunkwa on Offin, Twifo Praso, and Beposo are positioned along the Pra River. Nsawam, Amasaman and Weija are located along the Densu River. Ntotroso, Techiman, and Elubo are situated along the Tano River, while Prestea, Ankwaaso, and Dominase are found along the Ankobra River. The Bia River communities include Dadieso, Kwadwo Addaikrom, and Pomakrom. Relevant towns along the Volta River include Akosombo, Sogakope, and Kete Krachi. Dunkwa on Offin has a population of approximately 33 379, while Twifo Praso is home to about 23 000 residents. Beposo has an estimated population of 5000, and Nsawam has about 93 799 inhabitants. Amasaman has approximately 30 000 residents, Weija has around 85 000 and Dadieso has a population of 12 000. Kwadwo Addaikrom has about 8000 residents, Pomakrom has around 6000, and Akosombo has a population of 10 000. Sogakope is home to roughly 5000 people, Kete Krachi has about 20 000, and Ntotroso’s population is estimated at 26 909. Techiman has the largest population among the selected areas, with approximately 243 335 residents. Elubo has about 23 952, Prestea has around 35 760, Ankwaaso has approximately 5000, and Dominase is estimated to have 5000 residents. These communities depend significantly on rivers for drinking water, fishing, and irrigation, yet they frequently face contamination risks from agricultural runoff, inadequate waste management, and industrial activities.
Pra, Ankobra, and Tano rivers serve as a source of drinking water but are highly contaminated with mining activities. Densu and Volta rivers are sources of livelihood for fishermen, while Bia River aids in irrigation of plantain and cocoa plantations. However, water pollution in these communities has led to severe health concerns. The Ghana Health Service reported that outbreaks of cholera, dysentery, and typhoid are common due to microbial pollution. Cases of mercury poisoning from artisanal mining have led to kidney, skin, gastrointestinal and neurological ailments in children and pregnant women. High nitrate content from fertilisers has led to Blue Baby Syndrome in infants.65,66 Consequently, this study evaluated the magnitude of this health concern and its relation to pollution and water use.67-69 Neverthless, a total population of 671 134 from rural communities along these major rivers was used for the study. This population was based on Ghana Statistical Service records and local administrative data. To assess how community perception influences pollution of the major rivers in Ghana, the study targeted individuals aged 18 years and above. This composed of farmers (40%), businessmen (25%), fisherfolk (15%), miners (10%), and civil servants (10%).
Sample Size
The study estimated sample size comprised respondents from Dunkwa on Offin, Twifo Praso, Beposo, Nsawam, Amasaman, Weija, Ntotroso, Techiman, Elubo, Prestea, Ankwaaso, Dominase, Dadieso, Kwadwo Addaikrom, Pomakrom, Akosombo, Sogakope, and Kete Krachi. The communities were chosen due to their reliance on the river resources and the exposure they have had to the river contaminants from industrial and agricultural operations. Furthermore, the sample size was calculated using Cochran’s formula, and this took into account the confidence level and error margin and proportion estimation influenced by river pollution. 70 With a 95% confidence interval, a 5% error margin, and 50% assumed prevalence rate, a total of 384 participants were identified for this study. Taking into consideration non-respondents and incomplete data, 400 respondents was used for this study. This was essential for dealing with low literacy rates and restricted mobility, along with a lack of willingness to take part. It enabled a higher level of study validity and reliability, as well as a higher level of subgroup interpretation and overall generalisation to a similar setting in rural Ghana. 71
Sampling Procedure
Purposive sampling method was employed first to identify the 6 major rivers (major basins, pollution hotspots, and hydrological importance) in Ghana affected by serious levels of pollution. This technqiue ensured that the research findings and results are relevant and applicable to environmental and health policies. Multi-stage sampling methods were employed for obtaining a representative and diverse sample from the desired population. A total of three (3) communities were selected along each of the 6 major rivers in the study. These include Dunkwa-On-Offin, Twifo Praso, and Beposo (Pra River), Nsawam, Amasaman, and Weija (Densu River), Techiman, Elubo, and Ntotroso (Tano River), Prestea, Ankwaaso, and Dominase (Ankobra River), Dadieso, Kwadwo Addaikrom (Bia River), and Akosombo, Sogakope, and Kete Krachi (Volta River). These communities were selected based on their proximity to the rivers and their dependence on river resources for drinking water, fishing and irrigation.
To additionally limit the possibility for selection bias and increase the level of representativeness in the surveys, individual respondents in each community were selected using simple random sampling technique. In this approach, each individual had an equal chance of being selected, thus preventing any particular group from being overly sampled. In addition to these technqiues applied to limit the possibility for any biases to occur in the survey, other factors specifically aimed at dealing with biases include oversampling for groups that are considered to be underrepresented and following up for better response rates. The combination of the approach for selecting respondents using purposive sampling and multi-stage sampling helped the study tap into the required environmental information and represented the characteristics of the major rivers and the community in Ghana affected by the phenomenon.
Research Instruments
The instruments used were Hach HQ2200 Portable pH/EC/TDS/DO Metre, Hanna Instruments HI-93102 Metre, Nephelometric Turbidity Metre (ISO 7027), Atomic Absorption Spectroscopy (AAS) with hydride generation (APHA 3114B) and Graphite Furnace AAS (APHA 3113B). Additional instruments comprised Cold Vapour AAS (APHA 3112B), UV Spectrophotometry (APHA 4500-NO3-), a calibrated electrode-based pH metre (APHA 4500-H+), and the Membrane Filtration Technique (ISO 9308-1:2014). These instruments were used to obtain quantitative measurements of physical, chemical, and biological parameters for analysing river pollution levels. Instrument calibration and standardisation, which is part of quality control in laboratories, ensured accuracy and consistency in the results.
Likewsie, structured questionnaire was designed and implemented for 18 communities. It consisted of 5 sections, including demographic information of the respondents, vulnerability to river pollution, socio-economic parameters, water quality perception, and health concerns. The determination of demographic information gathered were age, gender, education, and occupation. The health concerns captured skin conditions, respiratory infections, and waterborne diseases. Additionally, water quality perception and vulnerability to river water pollution were determined using a Likert scale. The scale identified river water pollution sources such as agricultural runoff, industrial effluent discharge, and domestic sewage.
Instrument Validity and Verification
Instruments were calibrated to ensure accuracy of readings. Specificlly, Hach HQ2200 pH/EC/TDS/DO Metre, pH metre, Hanna Instruments HI-93102, and Nephelometric Turbidity Metre were calibrated using certified buffer solutions of pH 4.0, 7.0, and 10.0. The calibration of the Hanna Instruments HI-93102 and the Nephelometric Turbidity Metre was done using Formazin turbidity standards. The Atomic Absorption Spectroscopy calibration was carried out using multi-point calibration techniques that used certified materials for metals such as arsenic, lead, and mercury. The calibration of the UV Spectrophotometry was carried out using prepared nitrate standards, while the Membrane Filtration Technique was calibrated using positive and negative controls, consisting of E. coli strain and sterile distilled water blank. This process ensured methodological accuracy and absence of contamination.
To ensure content validity, a panel of experts in environmental science and public health assessed the relevance, accuracy and comprehensiveness of the questionnaire items on river pollution and its effects on health. A pilot study was conducted with 30 respondents from Brewaniase (Volta Region), Jukwa (Central Region), and Beposo (Western Region), who share similar characteristics with the final test regions. The test helped verify the clarity and relevance of the items on the questionnaire, the validity of the methods of data collection and the feasibility of extracting the water samples. Minor revision were made to the wording of questionnaire items. The Cronbach Alpha coefficient (α = 0.72) indicated a strong internal consistency among questionnaire items, consistent with recommendation by Taber. 72 To increase the accuracy of the results, water quality data were validated using multiply analytical procedures the results for the quality of the water were checked on the basis of a set of analyses. This thereby made the questionnaires free from personal biases.
Data Collection Procedure
The collection of water samples was conducted from May 2024 to August 2024, representing the rainy and dry periods. This helped observe the maximum levels of pollutants as well as the probable dangers associated with the pollutants for aquatic life and human life. The collection of samples was conducted in accordance with the American Public Health Association (APHA) Standard Methods for Water and Wastewater Examination (22nd Edition), as recommended in Yasin et al, 73 Lukubye and Andama, 74 and Shigut et al. 75 The samples were collected from 6 rivers (Ankobra, Densu, Bia, Pra, Tano, and Volta Rivers). The 6 rivers in turn were systematically sampled at 3 points (upstream, mid-point, and downstream).76,77 This was based on the hydrological flow of the water bodies, as well as the land use and their closeness to the sources of pollution, helping account for the differences in the quality of the water at various points of study.78,79
A total of 162 water samples were collected from 6 rivers to ensure spatial representativeness. The water samples were collected from 3 communities in each of the 6 rivers. In each of the 18 communities, 3 sampling points were selected (upstream, midstream, and downstream), with 3 replications in each sampling point, totalling 9 water samples in each river. This aided in representing spatially representative variations in water qualities, as well as ensuring that water qualities in different spatial areas of the 6 rivers are dependable. The water samples were collected 0.5 m below the surface and about 1 metre away from the shoreline to avoid external interference in the water.2,80 The Grab Sampling Protocol (APHA 1060B) was followed in water sample collection, ensuring that parameters were measured instantly and preserved accordingly for further analysis in laboratories.81,82 The water samples used in determining physicochemical properties were collected in clean HDPE bottles, while glass bottles were used to store water samples used to determine microbiological properties. The process of preservation included acidification (for heavy metal ions), refrigeration at 4°C + 2°C, and ice storage. The water samples were handled to prevent compositional changes within 6 hours.
Analysis was conducted at both the Ghana Water Research Institute (WRI) and the Council for Scientific and Industrial Research (CSIR) Environmental Quality Laboratory. Calibration standards were used to establish the precision levels in each piece of equipment. pH, electrical conductivity, TDS, and DO were determined using the Hach HQ2200 Portable pH/EC/TDS/DO Metre, with an accuracy level of ±0.01 pH. Turbidity standards were measured using both Nephelometric Turbidity Metre (in accordance with ISO 7027) and Hanna Turbidity Instrument HI-93102, with an accuracy level of ±0.02. Arsenic, lead, and mercury levels were analysed using Atomic Absorption Spectroscopy (AAS), with hydride generation (APHA 3114B), graphite furnace (APHA 3113B), and Cold Vapour techniques (APHA 3112B), respectively. Concentrations of nitrate were evaluated using UV Spectrophotometry (APHA 4500-NO3−). Representations of Escherichia coli contamination were analysed using the Membrane Filtration Technique (ISO 9308-1:2014), with.
QGIS 3.34 was used to extract geographic coordinates of sampling locations and compute Euclidean distances between river sampling points and adjacent communities. This captured pollutant dispersion along upstream, midstream and downstream sections of the rivers. Assumptions were tested to ensure the validity of statistical tests include normality (Shapiro-Wilk Test), homoscedasticity (Levene’s Test), and independence (Durbin-Watson Test) to ensure the validity of the linear and correlation tests performed. Error sources, including drift, cross-contamination and sampling inconsistency, were controlled by triplicate sampling, recalibration, competence measurement, and data verification audit processes. 83 A structured questionnaire was formalised over a period of 6 weeks; validated through expert review; and pilot-tested in a rural setting. The questionnaire, which required 15 to 20 minutes for completion, was self-administered. Research assistants were employed to help respondents overcome any literacy limitations by providing translation in local dialects. The process of data collection added strength to the study as it helped in examining the link between water pollution of the river and health in the rural setting. Data collection was done over a period of 3 months.
Data Analysis Procedure
Data analysis was conducted using Python statistical environment, ensuring efficient data processing and statistical computations. The collected data from water quality analysis and field surveys were coded, cleaned, and transformed before analysis. Data cleaning procedures included the removal of duplicate entries, standardisation of units for water quality parameters, and handling of missing values through mean imputation for continuous variables and mode imputation for categorical variables. Outliers were identified and assessed using boxplots and z-scores, ensuring data integrity. Descriptive statistics, including frequencies, percentages, means, and standard deviations, summarised the water quality parameters and demographic characteristics of respondents. The water quality data were evaluated against the Ghana Standard (2021) and the WHO (2017) drinking water guidelines, assessing the suitability of each river for consumption, as shown in Table 1.
Acceptable Water Standards for Safe Drinking Water.

Distance analysis examined the impact of proximity to pollution sources on health outcomes. Communities’ geographic locations were used to estimate spatial proximity between communities and river sampling points. Euclidean distances to the nearest river sampling sites were calculated from community centroid coordinates. A distance analysis graph visualised these spatial patterns, showing the gradient of contamination levels across sampled areas.
The assumptions preceding statistical tests were checked before performing inferential statistical analysis. The Shapiro-Wilk tests were used to check for normality, Levene’s tests for homoscedasticity, and the Durbin-Watson test for independence among residuals for regression models. Pearson’s correlation analysis measured the strength and direction of relationships between water quality parameters. Multiple regression analysis was performed using a mutiple linear regression model, with pollution perception as the dependent variable and socio-economic factors, distance to pollution sources, and reported health issues as predictor variables. The model’s goodness-of-fit was assessed using R-squared and adjusted R-squared values, ensuring the robustness of findings. Analysis of variance (ANOVA) identified significant mean differences in contamination levels across sampling points. Significance levels for all tests were set at .05. Results were carefully presented using tables, figures, and geographical resource maps, each equipped with descriptions that linked test outcomes to existing scholarly work on environmental and health concerns. These methods helped to build a comprehensive understanding of river pollution behaviour, associated societal perceptions, and health risks associated with such phenomena in Ghana.
Results
This section presents results and discussions on the influence of community perception on pollution of the major rivers in Ghana. Table 2 and Figure 3 display the variation and distribution of the water quality parameters of Ankobra, Bia, Densu, Pra, Tano, and Volta Rivers. The 6 major rivers recorded mean Arsenic of 0.61 mg/L (SD = 0.05), lead of 0.83 mg/L (SD = 0.03), and mercury of 0.11 mg/L (SD = 0.02). Notwithstanding, the high levels of arsenic, lead, and mercury might be due to inputs from mining activities, industrial effluents and improper disposal of electronic waste in the surrounding communities.86,87 The small difference within the quartiles for lead and mercury illustrates that pollutants are prevalent within the 6 rivers. According to Tchounwou et al. 88 this is a serious issue, for chronic exposure to arsenic and lead contributes to neurological and developmental disorders, cancer and kidney damage.
Descriptive Statistics of Chemical Contaminants and Bacterial Levels of Rivers.

Abbreviations: As, arsenic; Pb, lead; Hg, mercury; NO3, nitrates; E. coli, Escherichia coli; EC, electrical conductivity; TDS, total dissolved solids.

Distribution of water quality indicators across rivers.
Studies carried out by Al-Sulaiti et al 89 and Liu et al 90 proved that the bioaccumulation of mercury affects aquatic life and food chains. These authors added that mercury builds up in the aquatic environment cause food poisoning from plants to the smallest prey and the top predator, and consequently human beings. Among humans, this results in diseases such as the Minamata disease, including tremors, seizures, and memory loss. The maximum mercury concentration (0.21 mg/L) implies localised contamination, possibly due to mining activities. 91 Anang and Lawson 91 documented mercury and lead contamination in Aboabo and Wiwi Rivers, 34 in groundwater for domestic and agricultural purposes, arsenic in Bonsa River and Gbogbo et al 92 in the shells of 7 species of fish. This demonstrates widespread arsenic, lead and mercury pollution in Ghana. There is the need to monitor and effectively manage these pollutants in the water bodies.
Similarly, the mean nitrate concentration (17.3 mg/L, SD = 1.9) found in Table 2 and Figure 3, which is lower than the Ghana Standard Authority 85 standard and the WHO 2 limit (50 mg/L) might result from the use of inorganic fertiliser along the rivers. Mishra, 93 who cautioned against a minimal increase in nitration, asserted that nitrate pollution influences eutrophication, as well as algal blooms that deplete oxygen and adversely affect aquatic life. pH level ranged from slightly acidic to neutral (SD = 0.25 and range = 5.45-7.65), with a mean value of 6.09 (SD = 0.25) and spanned from 5.45 to 7.65. These values, though, are within the Ghana Standard Authority 85 standard and the WHO 2 acceptable limits (from 6.5 to 8.5), they might influence the solubility and mobility of metals, such as mercury, in the rivers.94,95 Furthermore, mean E. coli (1243.75 MPN/100 mL, SD = 145.3), ranging from 1020 to 1420 MPN/100 mL, exceeded the Ghana Standard Authority 85 standard and the WHO 2 safe limits (0 MPN/100 mL) for potable water. This finding demonstrates that the water sources are being affected by untreated human or animal waste, likely due to open defecation, direct sewage discharges, and poor sanitation infrastructure.
However, the outliers of E. coli approaching 1420 MPN/100 mL show persistent microbial contamination, raising significant public health concerns. 96 High E. coli counts correlate with inadequate sanitation facilities and sewage discharge, a pattern found by Usang et al 97 and Dagher et al. 98 Furthermore, the high electrical conductivity (mean = 801.25 µS/cm, SD = 99.8, and range = 675-910 µS/cm) and total dissolved solids (mean = 1505.45 mg/L, SD = 95.34 and range = 1300 to 1760 NTU) reflect a high concentration of dissolved ions, likely from geogenic sources or anthropogenic pollution. The high turbidity concentration (mean = 1525.75 NTU, SD = 197.55) further demonstrates the presence of suspended particles, possibly organic pollutants and sediments, compromising water clarity and quality.
Table 3 and Figure 4 show the relationships among water quality parameters. The correlation coefficients show complex interactions among water quality parameters. According to Cohen’s (1988) guidelines, correlations can be interpreted as weak (r = .10-.29), moderate (r = .30-.49) and strong (r ⩾ .50). As presented in Table 3, there was a strong positive correlation between Arsenic (As) and nitrate (NO3-; r = .98), and this suggests that these pollutants have common sources such as agricultural runoff and mining waste. A strong correlation also occurred between arsenic and E. coli (r = .83). Solgi et al. 99 linked arsenic contamination to agricultural activity and nitrate accumulation. Arsenic also strongly correlated with turbidity (r = .74), indicating the influence of suspended particles in transporting heavy metals in water. Ofori et al 35 and Daud et al 36 reported that when heavy metals like Arsenic adsorb onto sediments and microorganisms, they can then move with the water flow, spreading contamination among aquatic life upon uptake. A strong association was also observed between arsenic (As) and turbidity (r = .74), indicating that suspended particles play a key role in the adsorption and mobility of heavy metals in aquatic systems. Similar observations have been reported by Ofori et al 35 and Daud et al, 36 who noted that heavy metals can attach to sediments and organic particles, facilitating their dispersion in water bodies.
Pearson Moment Correlation Analysis Showing Association Between Water Quality Parameters.

Abbreviations: As, arsenic; Pb, lead; Hg, mercury; NO3, nitrates; E. coli, Escherichia coli; EC, electrical conductivity; TDS, total dissolved solids.
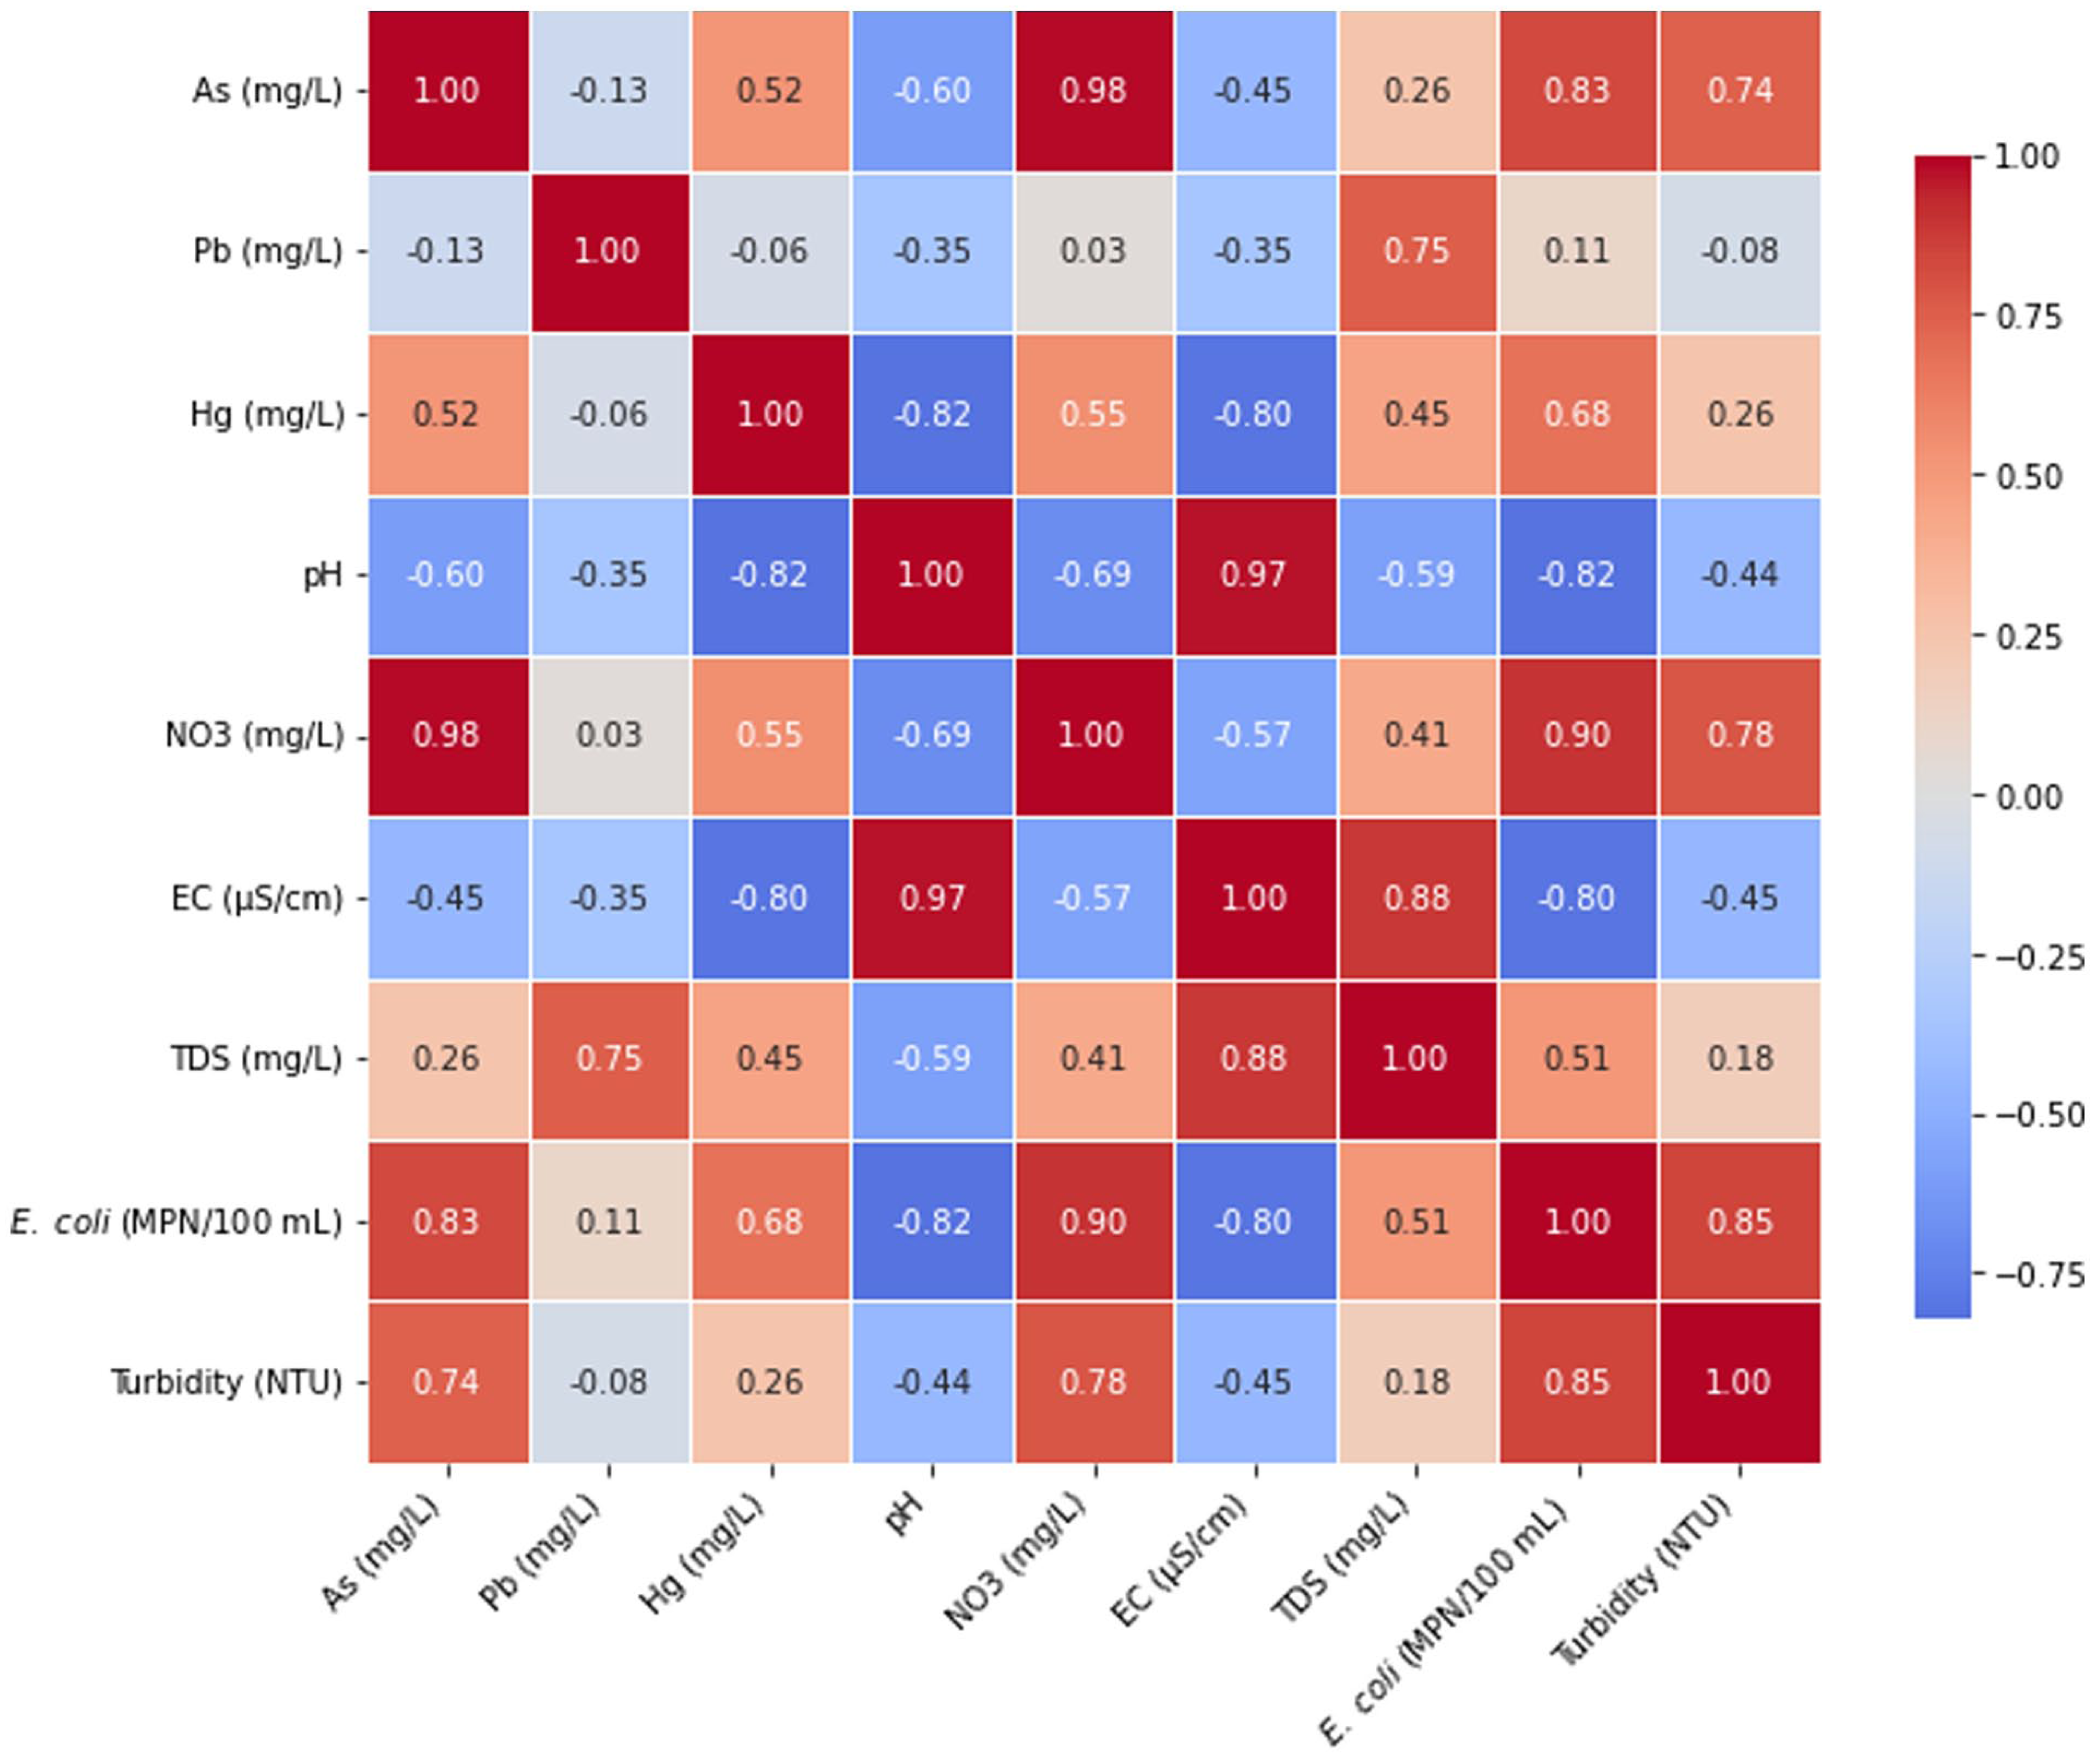
Pearson correlation coefficient matrix.
Nevertheless, EC correlated with TDS (r = .88) and pH (r = .97), and this indicates the presence of dissolved ions (Ca2+, Na+, Mg2+, Cl-, and HCO3-) in the rivers. Gqomfa et al 100 explained that dissolved minerals increase ion concentration, including TDS and EC. The very strong relationship between EC and pH (r = .97) further indicates that ion-rich waters are regulated by acid–base chemistry, where the presence of hydrogen, carbonate, and bicarbonate ions significantly alters conductivity. Such conditions are frequently encountered in areas affected by mining, improper waste disposal, or intensive farming, where chemical inputs disrupt natural buffering systems. Additionally, the moderate negative correlations between pH and mercury (r = −.82) and nitrates (r = −.69) affirm that acidic conditions enhance the solubility and mobility of these contaminants, increasing the likelihood of their spread in aquatic environments. Acidic waters can release mercury from sediments into the water column, facilitating its transformation into more toxic forms such as methylmercury, while also promoting nitrate persistence, which contributes to eutrophication and associated fish kills. The negative relationship between E. coli and pH (r = −.82) indicates that bacterial survival declines under neutral to alkaline conditions, implying that acidic, polluted waters may favour microbial persistence. In contrast, the weak correlation between lead (Pb) and E. coli (r = .11) confirms that these pollutants are from different sources and have transport pathways. Lead contamination is particularly associated with geogenic inputs, ageing plumbing systems, or industrial discharges rather than faecal contamination. 101
Table 4 and Figure 5 present water quality parameters that affect major rivers in Ghana. From PCA, the first 3 components (PC1, PC2, and PC3) explain 92.86% of the total variation in the pollution of the major rivers. PC1, consisting of arsenic (As) and Lead (Pb), explained 50% of this variation. This connotes that river pollution in Ghana is as results of mining and industry discharges. TDS and nitrates (NO3−) were identified for PC2, and they explain 25.71% of the variation. This level of variation might result from agricultural runoffs as well as domestic sewage or water waste with high levels of dissolved substances. 102 PC3 captured mercury (Hg) and explained 17.14%. This identified agricultural runoffs from small-scale gold mining activities as a water pollution factor for these water bodies. The Kaiser-Meyer-Olkin measure of 0.63 confirms data adequacy for further factor analysis. The presence of large eigenvalues shows that pollution of major rivers in Ghana is influenced by diverse sources.97,103
Principal Components Analysis (PCA) Showing Pollutant Loads in Major Rivers in Ghana.

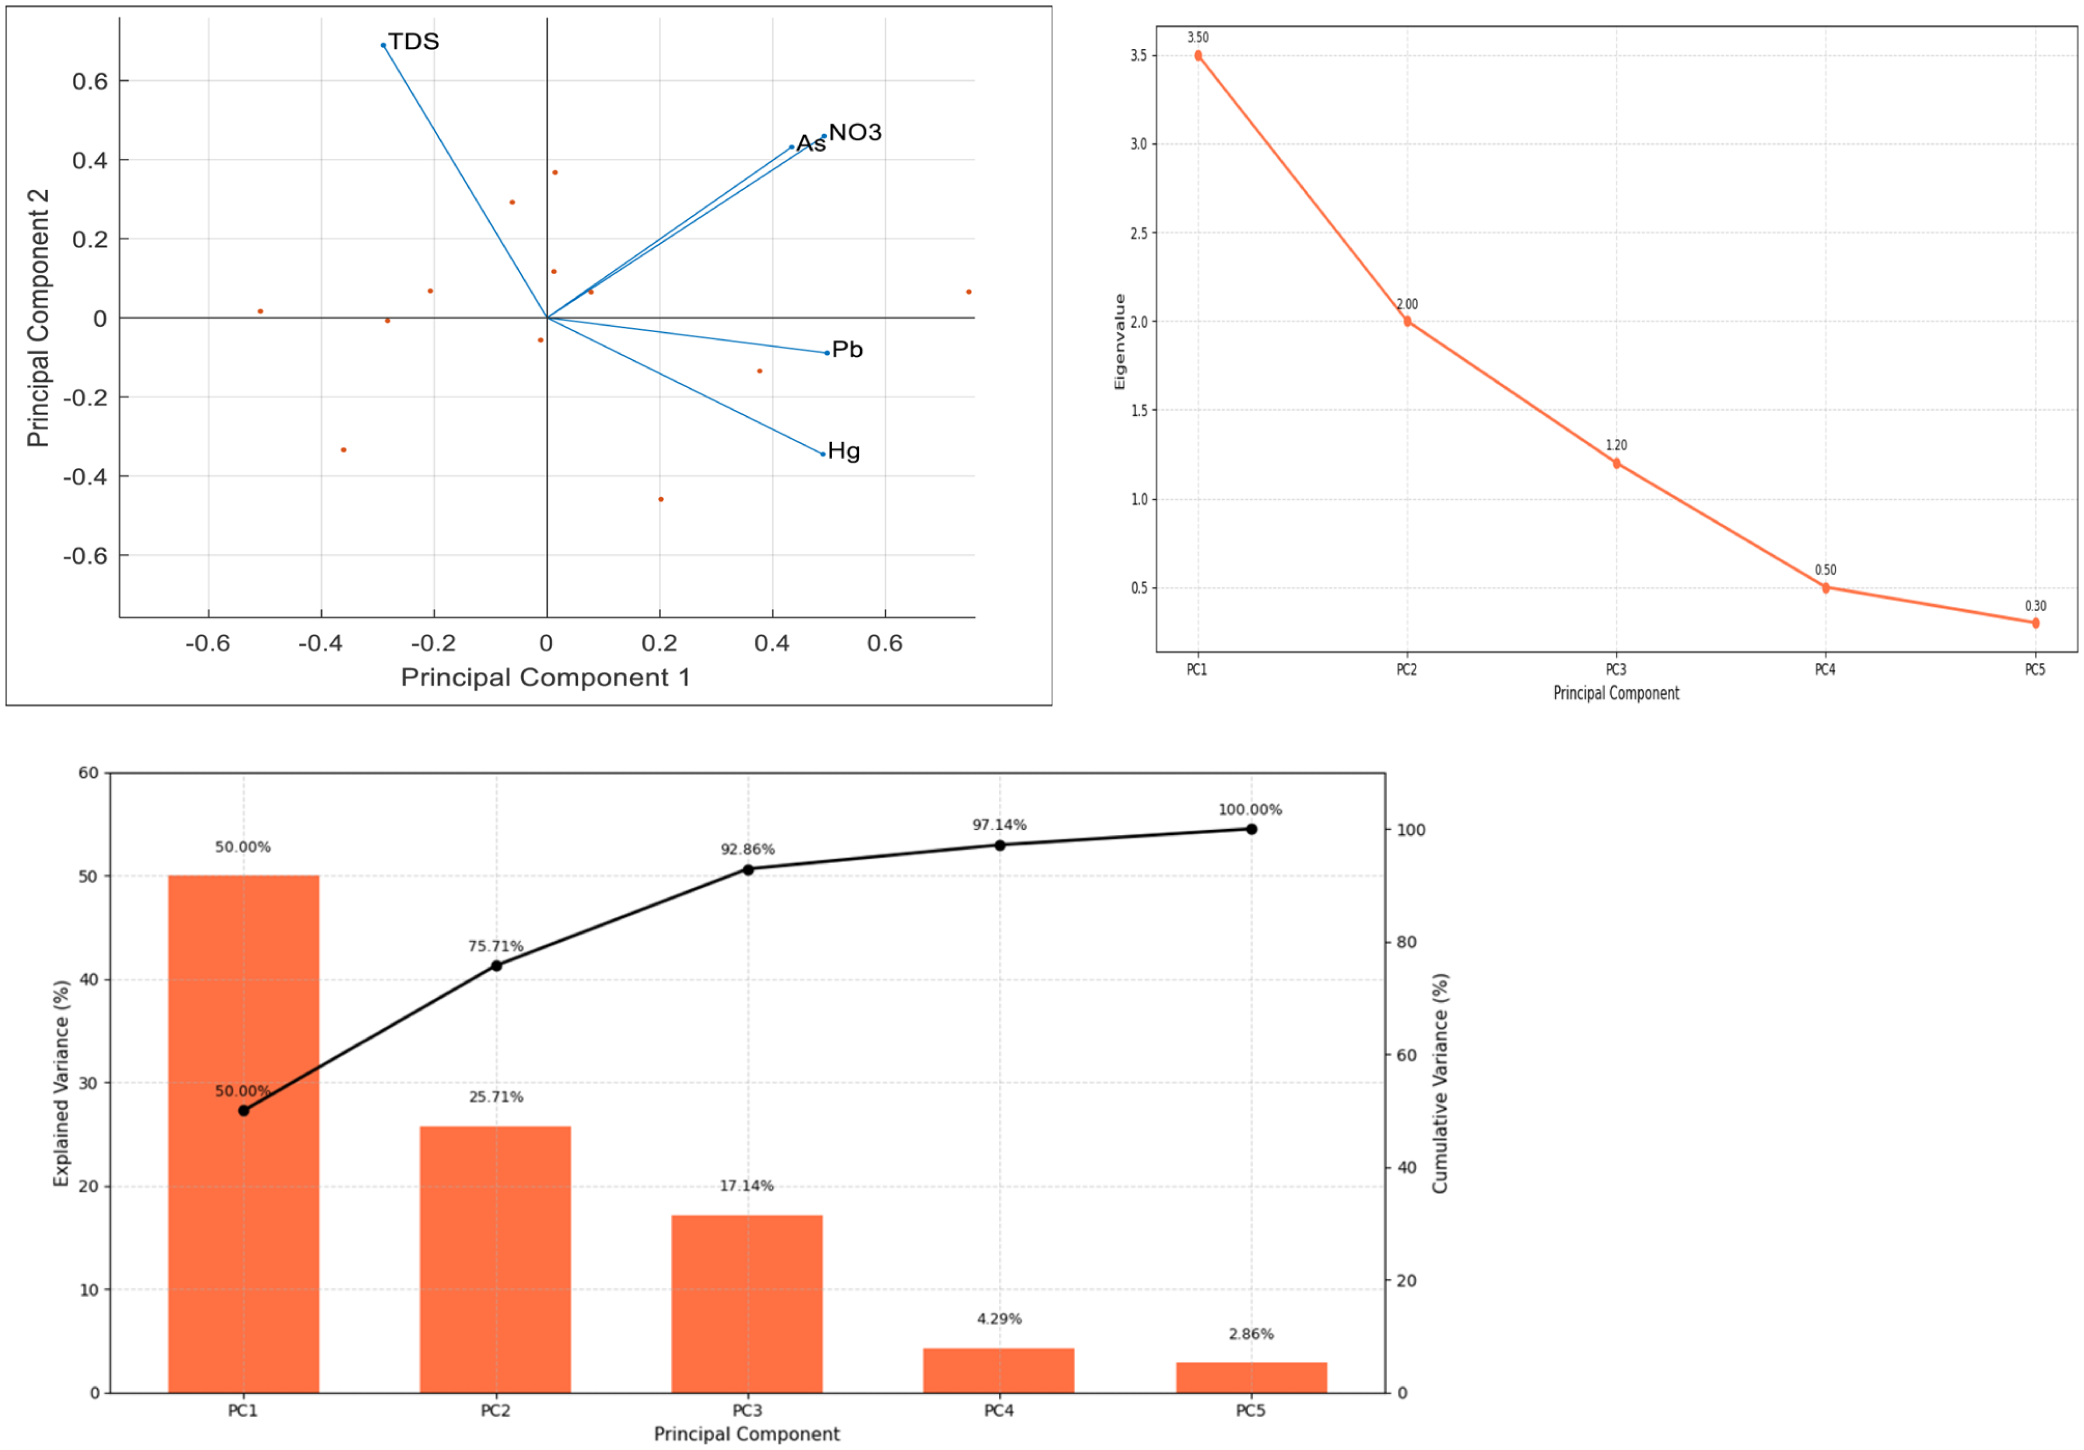
Scree plot of eigenvalues and variance explained by principal components.
Figure 6 displays the distance and pollutant concentration analysis of the 6 major rivers in Ghana. The figure shows that pollutant concentration inversely relates to pollutant distance downstream. The maximum value of arsenic (1.25 mg/L), turbidity (2499.9 NTU), E. coli (1780.5 MPN/100 mL), and total dissolved solids (2432 mg/L) was obtained within the 0.5 to 1 km range from the source and decreased gradually towards 2 km. This, therefore, indicates that pollutant sources are upstream and midstream of the rivers, most likely around villages, mining areas, and farm fields where wastes and untreated effluents directly enter the rivers. These findings are supported by Gwira et al 104 and Kusimi and Kusimi 105 who reported high arsenic and lead levels in rivers within mining and industrial areas, such as Tarkwa. Thus, the very high turbidity (2499.9 NTU) and arsenic levels of 1.25 mg/L at 0.5 km could arise due to small-scale mining activities or agricultural runoff. Downstream, however, natural processes such as sedimentation, dilution, and microbial breakdown may be involved in lowering the levels of contaminants.87,105

Cost concentration analysis of river quality parameters.
Conversely, pH levels showed slight variation across distances (ranging from 5.45 to 7.65), with lower pH values closer to 0.5 km, indicating mildly acidic conditions in upstream locations. Nitrate levels declined from 24.87 mg/L at 0.5 km to 10.43 mg/L at 2 km, demonstrating nutrient loading from agriculturally influenced watersheds. Nitrate concentrations peaked at 0.065 mg/L·km, consistent with Coka, 106 who linked nitrate presence to agricultural runoff in farming zones. In the current analysis, E. coli levels decreased from 1780.5 MPN/100 mL at 0.5 km to 850.25 MPN/100 mL at 2 km, reflecting reduced faecal contamination downstream. This is potentially due to natural die-off and dilution processes. Nevertheless, these findings imply that communities situated near upstream locations may face greater exposure to carcinogenic and pathogenic pollutants, resulting in waterborne diseases and chronic health conditions. This highlights the need for focussed monitoring and mitigation strategies at specific points along river systems.
Table 5 presents the mean differences in water quality pollution across major rivers in Ghana. The table captures the sum of squares, degrees of freedom, mean square, F-values, and P-values for each parameter. Significantly, arsenic (P = .049), lead (P = .039), nitrates (P = .001), turbidity (P = .001), conductivity (P = .001), total dissolved solids (TDS, P = .001), and E. coli (P = .001) are less than .05. This indicates that the rivers have different levels of contamination and pollution sources. Conversely, mercury and pH did not show significant differences among the rivers. This presages that these pollutants have similar impacts on the pollution of the rivers understudy.
Mean Differences Between and Within Water Quality Parameters Across Rivers.

Significant at .05.
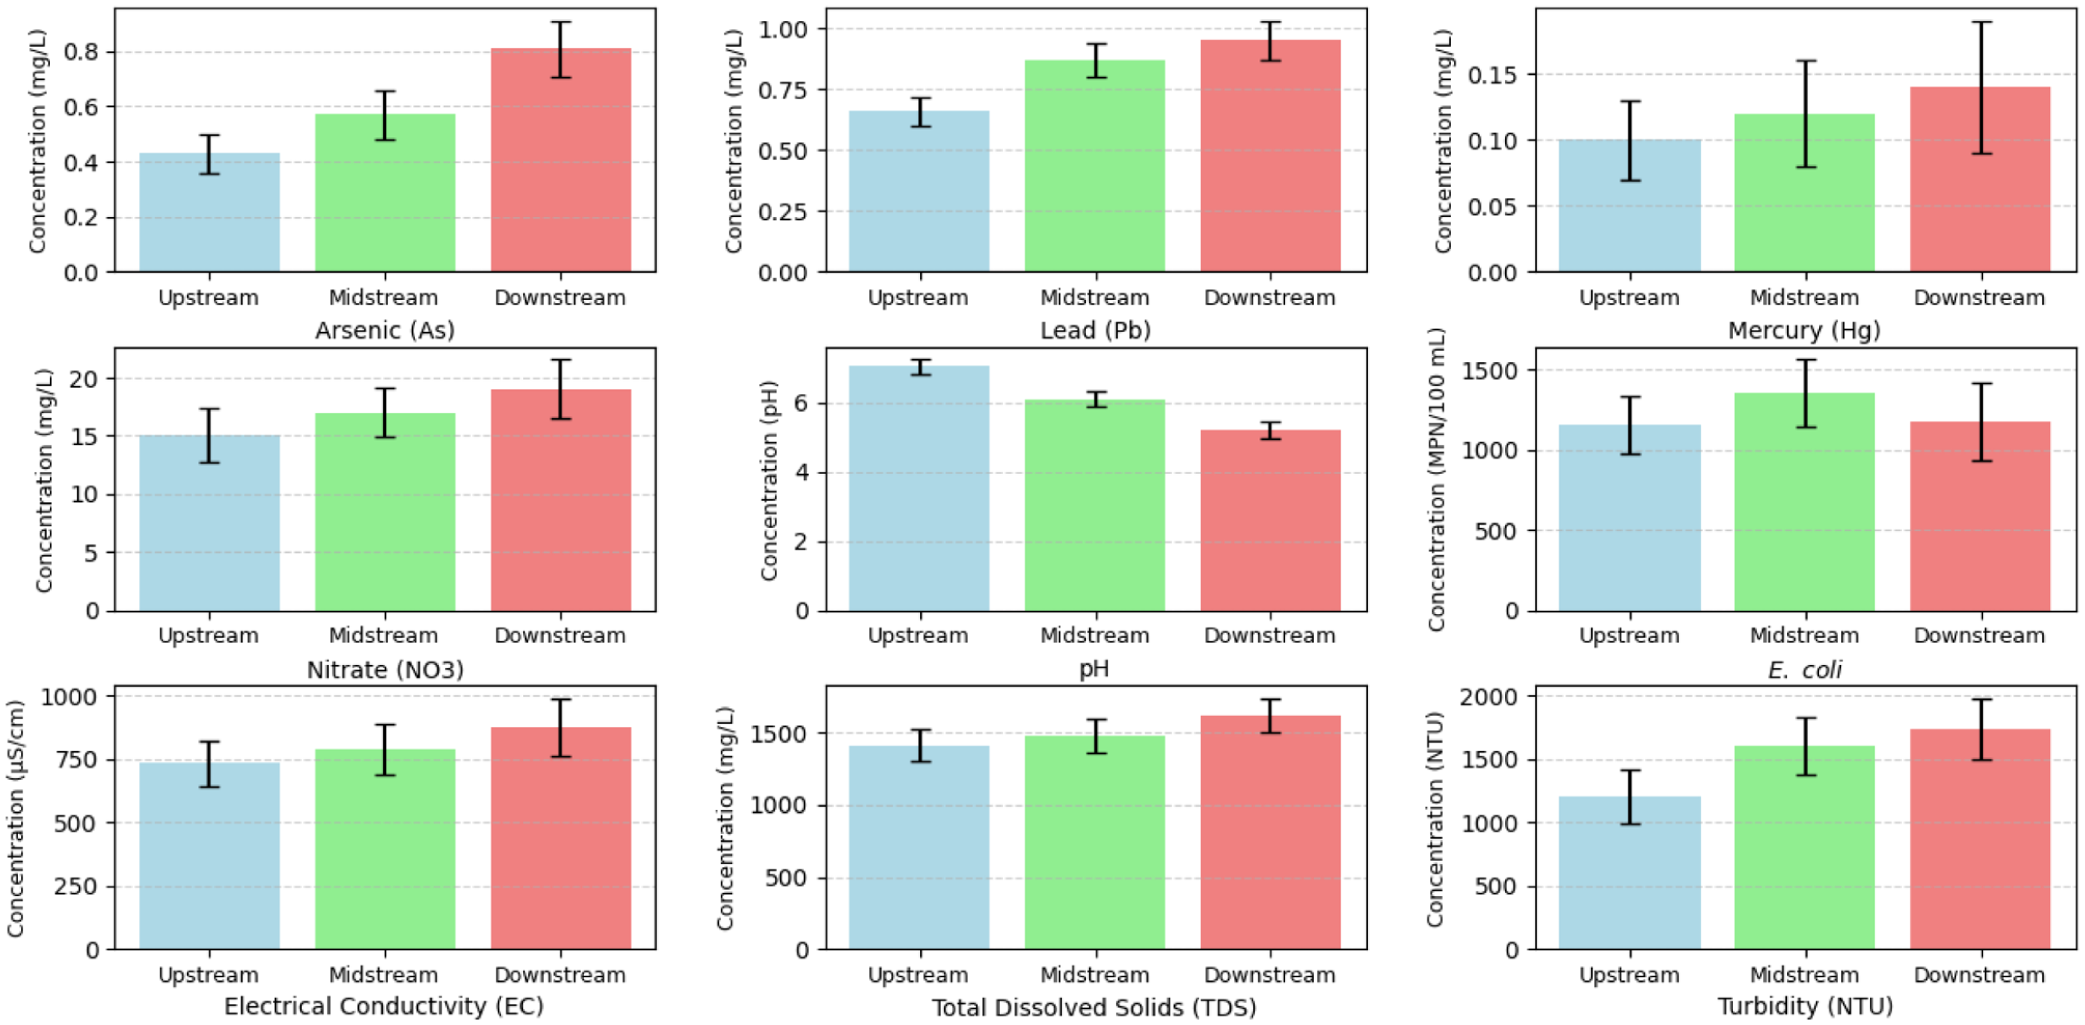
Figures 7 and 8 compare pollutant concentrations at downstream, midstream and upstream. From the figure, arsenic increased from a concentration of 0.43 mg/L upstream to 0.81 mg/L downstream, lead from 0.66 to 0.95 mg/L, mercury from 0.10 to 0.14 mg/L, and nitrate from 15.12 to 19.06 mg/L. Although arsenic, lead, and mercury showed moderate increases and remained within acceptable limits, gradual accumulation downstream suggests a long-term risk of heavy metal buildup. The increasingly heavy metal burden downstream could be linked to intensified illegal mining and effluent discharge from settlements along the riverbanks. 100 The electrical conductivity increased from 734.4 µS/cm upstream to 876.14 µS/cm downstream, total dissolved solids from 1413.18 to 1621.5 mg/L, and turbidity levels increased from 1203 NTU upstream to 1737.5 NTU downstream. The pH levels decreased from 7.03 upstream to 5.2 downstream. E. coli. was highest midstream at 1349.75 MPN/100 mL but decreased to 1174.50 MPN/100 mL downstream. Rapid population growth and poor sanitation practices in communities, including human or animal waste discharge, might have contributed to the increased E. coli levels. Usang et al 97 and Djagba et al 107 reported elevated nitrate levels downstream in the Niger River due to agricultural intensification and poor waste management. Likewise, turbidity doubled from 30 NTU to 60 NTU, potentially resulting from soil erosion, mining activities, and urban runoff and construction activities. This finding indicates water quality of river resources decreases from upstream to downstream. Therefore, the communities and authorities should reduce pollution by preventing direct dumping of waste and limiting agricultural runoff into the river to protect downstream water quality.
Comparison of pollutant concentrations across downstream, midstream, and upstream.

Pollutant concentration distributions across downstream, midstream, and upstream.
Table 6 presents gender, age group, marriage status, educational attainment, employment status, and duration in the community of 400 respondents. Most of the respondents are aged between 18 and 29 years old (33.89%), followed by the age bracket between 30 and 39 (24.44%). About 40% are married, and 35% are single, while 11.67% are divorced, with 8.06% widowed. This indicates diverse household dynamics that could influence water consumption practices as well as environmental health concern arrangements. Educational status of respondents indicates that 40.28% have attained tertiary education, while 28.61% secondary education. This educational level implies that major of the population is aware of the health risks associated with water pollution. Conversely, 17.50% of respondents have no formal education, and this connotes a lack of awareness concerning the risks associated with river pollution. Employment status and the tenure of residence revealed that 51.94% are unemployed, and the 34.44% are employed. A notwithstanding, 34.44% of the respondents have resided for over 10 years, indicating that they have an understanding of the changes in water quality over time and the effectiveness of past and present pollution mitigation strategies.
Demographic Information of Respondents (N = 400).
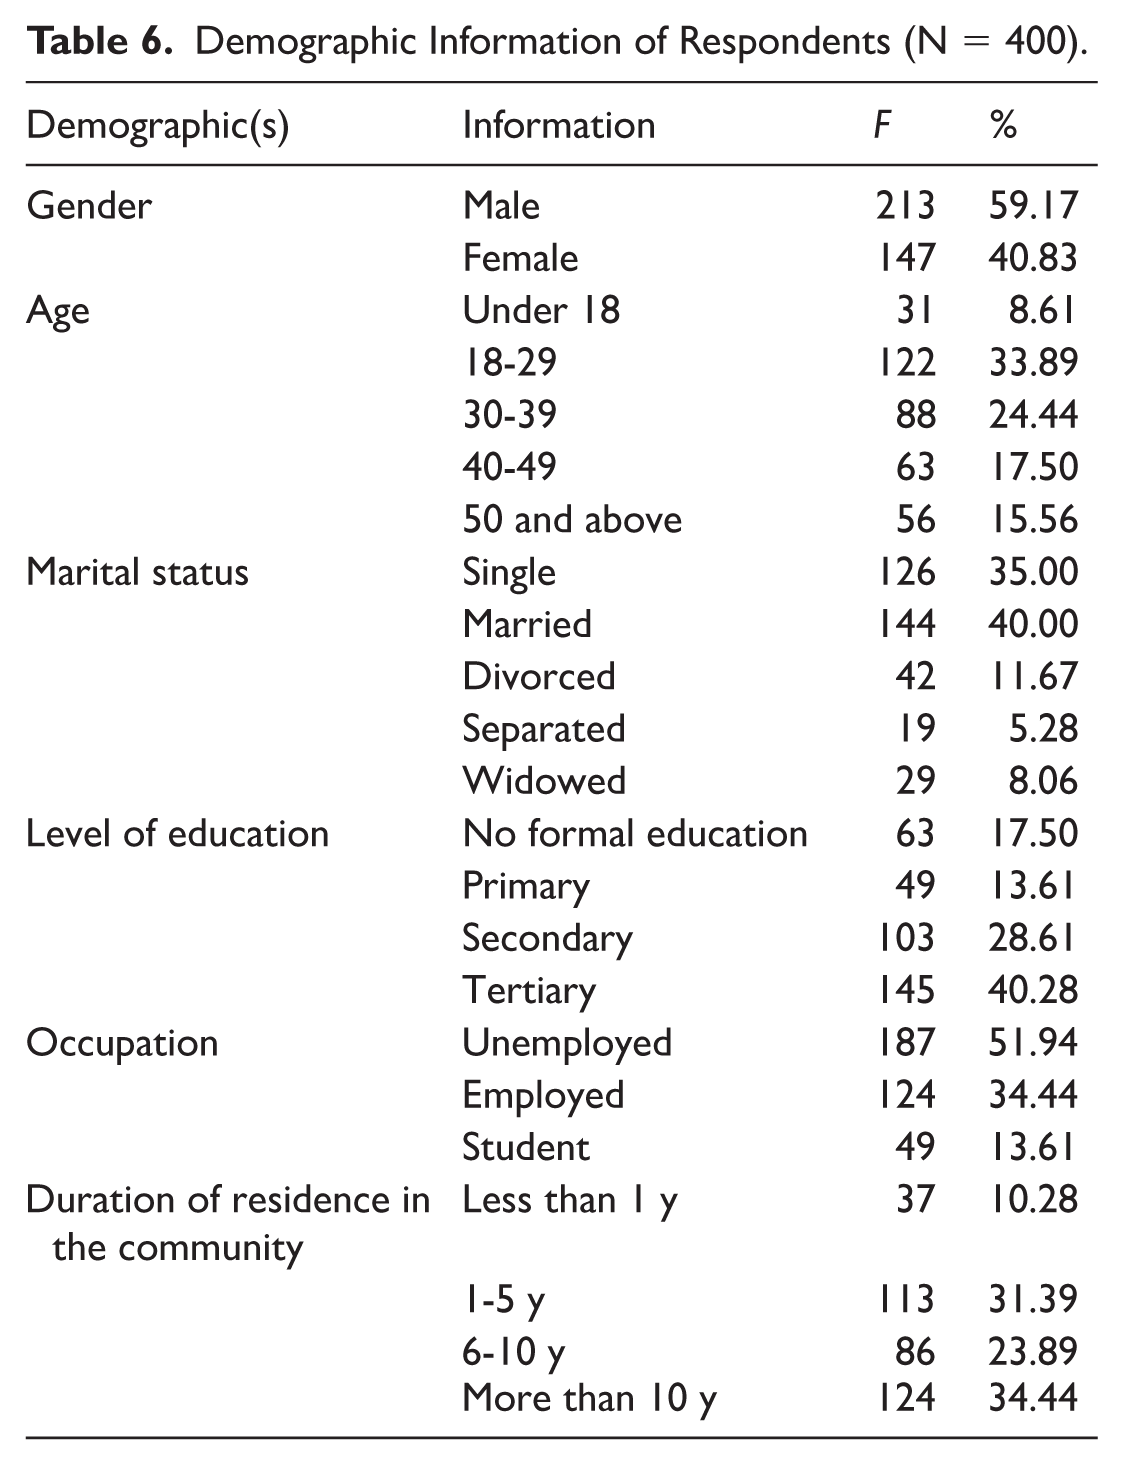
Table 7 presents the perception communities along Pra, Densu, Tano, Ankobra, Bia, and Volta have about river pollution. The Likert scaling method used a 5-choice system that included Strongly Agree (1 point), Agree (2 points), Neutral (3 points), Disagree (4 points), and Strongly Disagree (5 points). The average score was calculated for each statement, and the total points from all responses were summed and divided by the number of respondents as follows: [(1 + 2 + 3 + 4 + 5)/5] = 3 points. This gives a possible score range between 3 and 5, and any score above 3 indicates that it is mostly true or preferred and below 3 indicates something negative. From Table 7, the average scores for the overall water quality of all the rivers are 3.12, suggesting respondents generally accept that the water quality is poor. However, the standard deviation for this value is 0.87, and it indicates that some of the respondents are more strongly positive, while others are not. This perception reflects what Groh et al 108 found about rural communities, that they often undervalue pollution severity due to a lack of information and awareness about the actual water conditions. That is, in regions where information is scarce, residents rely on personal experiences or anecdotal evidence, leading to a skewed perception of river health. Regarding pollution levels, the responses indicated that pollution severity is lowly recognised. The majority of the residents recognise pollution existence and issues, while others downplay its seriousness. Perception of aquatic life biodiversity of the rivers appeared relatively optimistic, featuring a mean of 3.31. This is irrespective of the industrial discharge and agricultural runoff that have been observed to cause significant biodiversity decline. 109 Perceptions of a decline in the condition of the rivers appeared to be relatively lower, registering a mean of 2.85. This significant decline in the condition of the rivers is due to inadequate management of waste associated with rapid urbanisation. 110 Confidence level in the local administration was approximately 3.01, suggesting some level of trust in the administration. Jackson et al. 111 found that limited funding, lack of infrastructure, and regulatory oversight hinder effective water resource management in local communities.
Current State of Rivers in Ghana (N = 400).

Table 8 presents the influence of age, education, gender, marital status, occupation, and duration of residence on perceptions about the current state of rivers. The model explains 65.4% of the variation in perceptions about the current state of rivers. Gender, particularly men, influences perception about the current state of rivers. This shows that male respondents perceive the current state of rivers more negatively than their female counterparts. This aligns with Vicente-Molina et al, 112 who showed that men tend to have greater concerns about environmental pollutants. Education (tertiary) significantly predicts perception about the current state of rivers. This suggests that awareness and concern about river conditions increase with enhanced levels of education. Debrah et al 113 support this finding and stated that individuals acquire greater knowledge and understanding of river pollution through education.
Multiple Linear Regression Analysis Showing the Influence of Demographic Information of Respondents on the Current State of Rivers (N = 400).
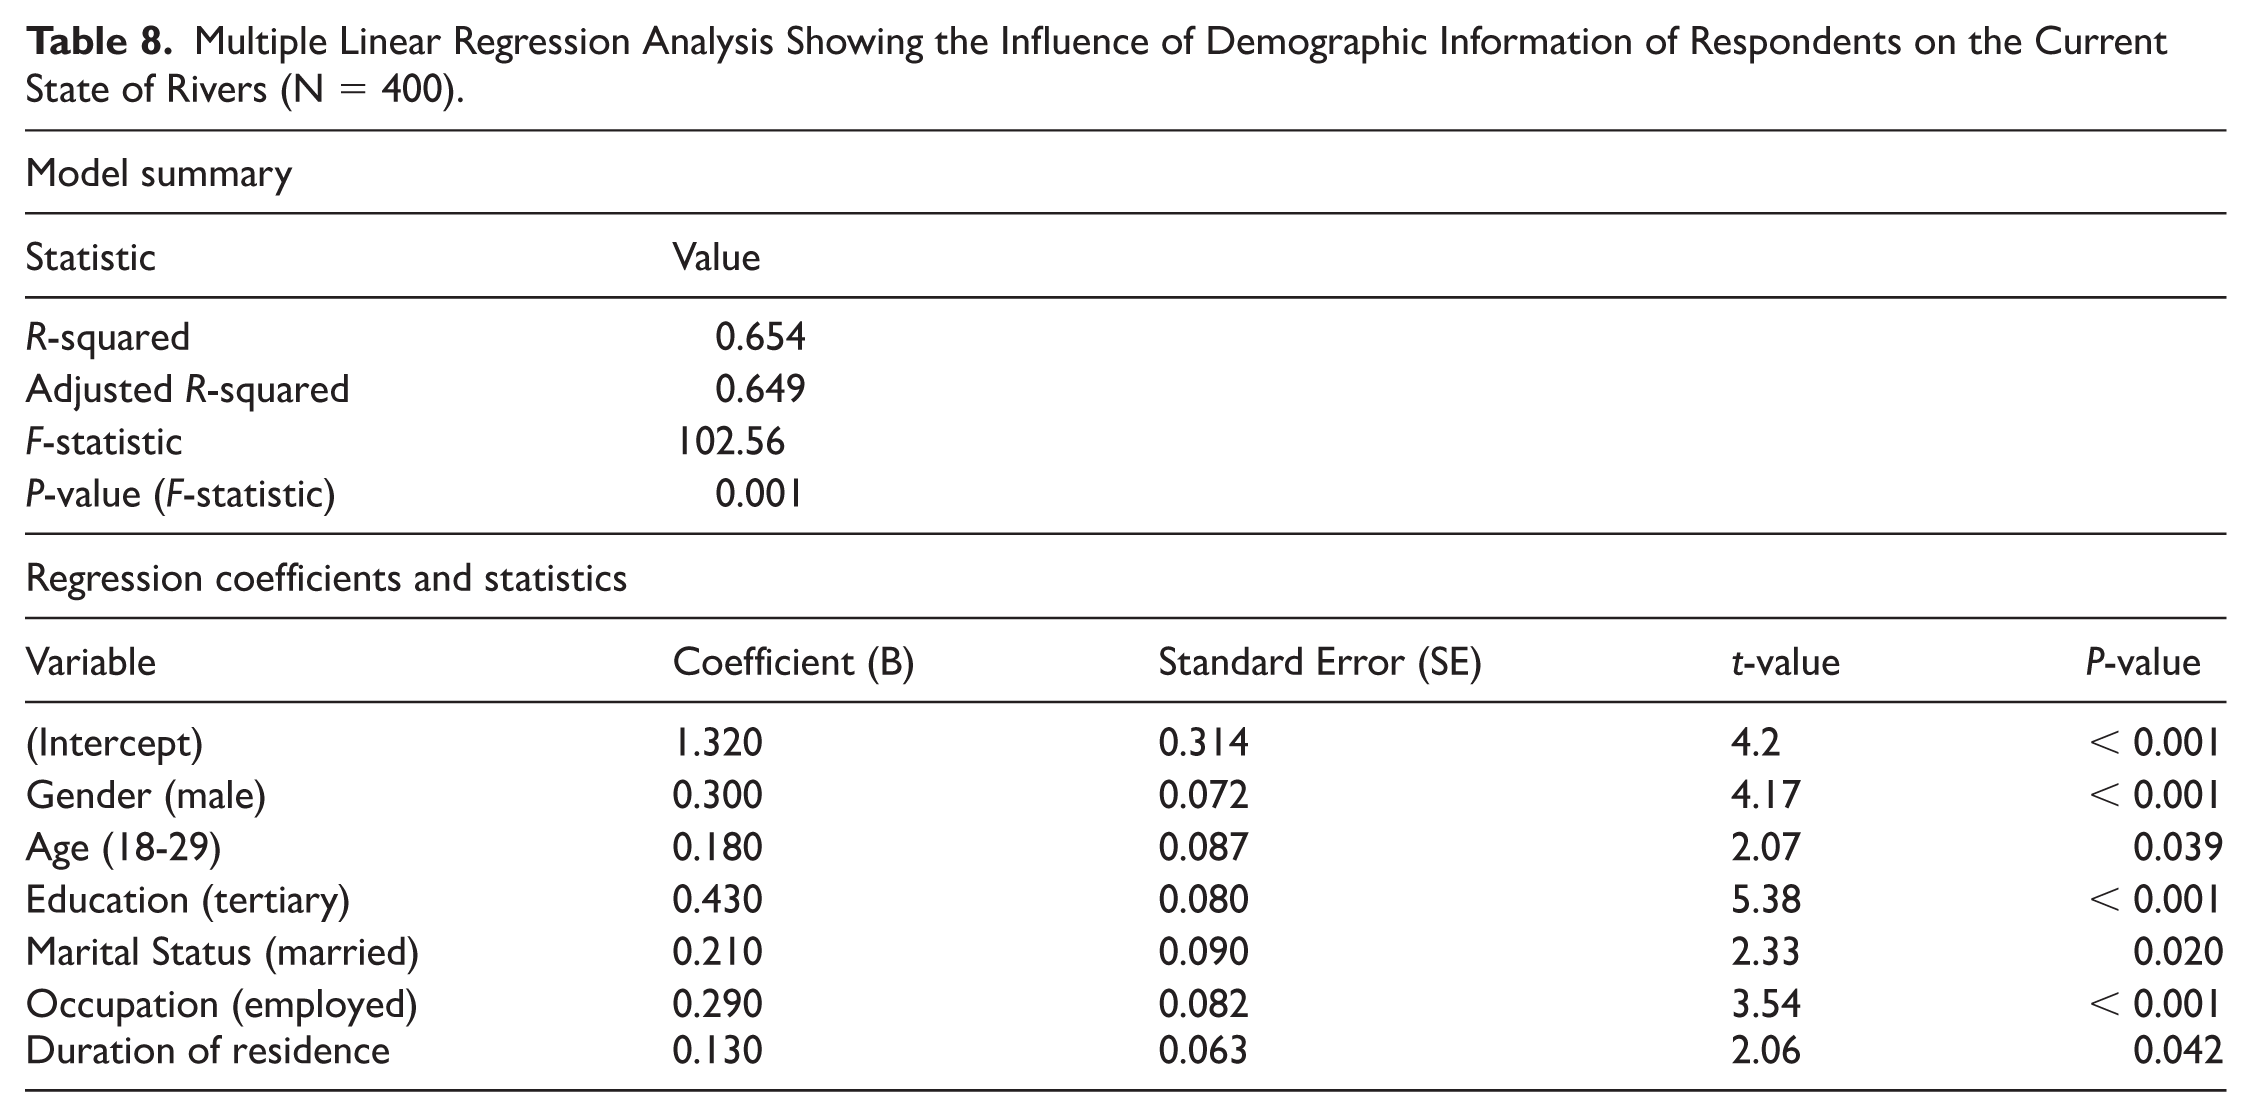
Furthermore, the age group between 30 and 39, and married persons, with coefficients 0.180 and 0.210, respectively, influence perception about the current state of rivers. This implies that certain ages and marital statuses are more aware of the impact of river pollution in their communities. This awareness, perhaps, might be due to past personal experiences and community responsibilities related to family health. Employment (0.290) also influences perception about the current state of rivers. Afsar and Umrani 114 and Liobikienė and Poškus 115 found that employment increases environmental awareness. Those who actively involve themselves in their jobs appear to notice and seek more information on environmental matters. This implies that increasing employment opportunities in Ghana would help improve environmental awareness and enforce pollution control policies and activities, helping reduce river pollution in Ghana.
Table 9 and Figure 9 present the key pollutants affecting the rivers of Ghana. As shown in the figure, 59% of the respondents chose mining as the main source of river pollution in Ghana. This percentage indicates the high environmental impacts associated with mining activities, especially where gold and other minerals are being mined. This is because research indicates that high levels of metals and other hazardous wastes associated with toxicity found in mining activities get concentrated in the ecosystems of the rivers. According to Adu, 116 the absence of control in mining activities results in the high diffusion of mercury and cyanide into the environment.
Pollution Sources in Rivers in Ghana (N = 400).


Major pollutants in Ghanaian Rivers.
Moreover, industrial discharges (8%) and agricultural runoff (7%) are the next perceived pollution sources. According to Lisetskii and Buryak 117 and Weldeslassie et al, 118 industrial discharges introduce toxic chemicals and heavy metals into water systems, while agricultural runoff often carries fertilisers and pesticides that contribute to nutrient pollution, leading to eutrophication and degradation of aquatic ecosystems. Domestic sewage and waste disposal were perceived by 5.5% and 4.5% of respondents, respectively, indicating waste management practices among communities along the rivers understudy. Tariq and Mushtaq 119 and Yohannes and Elias 120 asserted that in communities where there are the lack of efficient sewage and waste management systems, untreated waste is discharged directly into rivers. The relatively lower rates of oil spills (4%), urban runoff (3%), overfishing (2%), and erosion and sedimentation (1%) suggest that these pollution sources significantly degrade water quality and aquatic life. Therefore, the study recommends policy interventions that consider the multiple facets of pollution affecting Ghanaian rivers.
Table 10 presents perceptions of health, economic and psychological effects of river pollution associated with major rivers in Ghana. A high level of concern over waterborne diseases, especially cholera and typhoid (mean = 3.45). Adelodun et al 121 reported that polluted rivers serve as major sources of infectious diseases in low-income communities. A study conducted by Adelodun et al 121 revealed that polluted rivers with heavy flow of untreated sewage, solid waste, and industrial effluents become breeding places for disease-carrying pathogens. These pollutants reduce accessibility to clean drinking water, thereby compromising personal hygiene and increasing infection rates. In addition, respiratory infections (mean = 3.35) and skin conditions (mean = 3.15) also ranked high. Long-term health concerns, such as kidney and liver damage (mean = 3.2) and maternal complications (mean = 2.85) received lower scores. These are usually perceived as less acute because they take longer to manifest through regular exposure to lead, mercury, and arsenic, among other toxins. Bedu-Addo et al 33 noted that chronic contact with such pollutants can result in severe organ damage and developmental problems, especially in children. Relatively lower means indicate that the public may not be fully aware of such health consequences. Many individuals fail to connect these conditions to river pollution because the symptoms are slow to appear and less visible than acute infections. Lack of awareness may delay diagnosis and intervention, allowing problems to worsen silently.
Issues Associated with Pollution of Major Rivers in Ghana (n = 400).
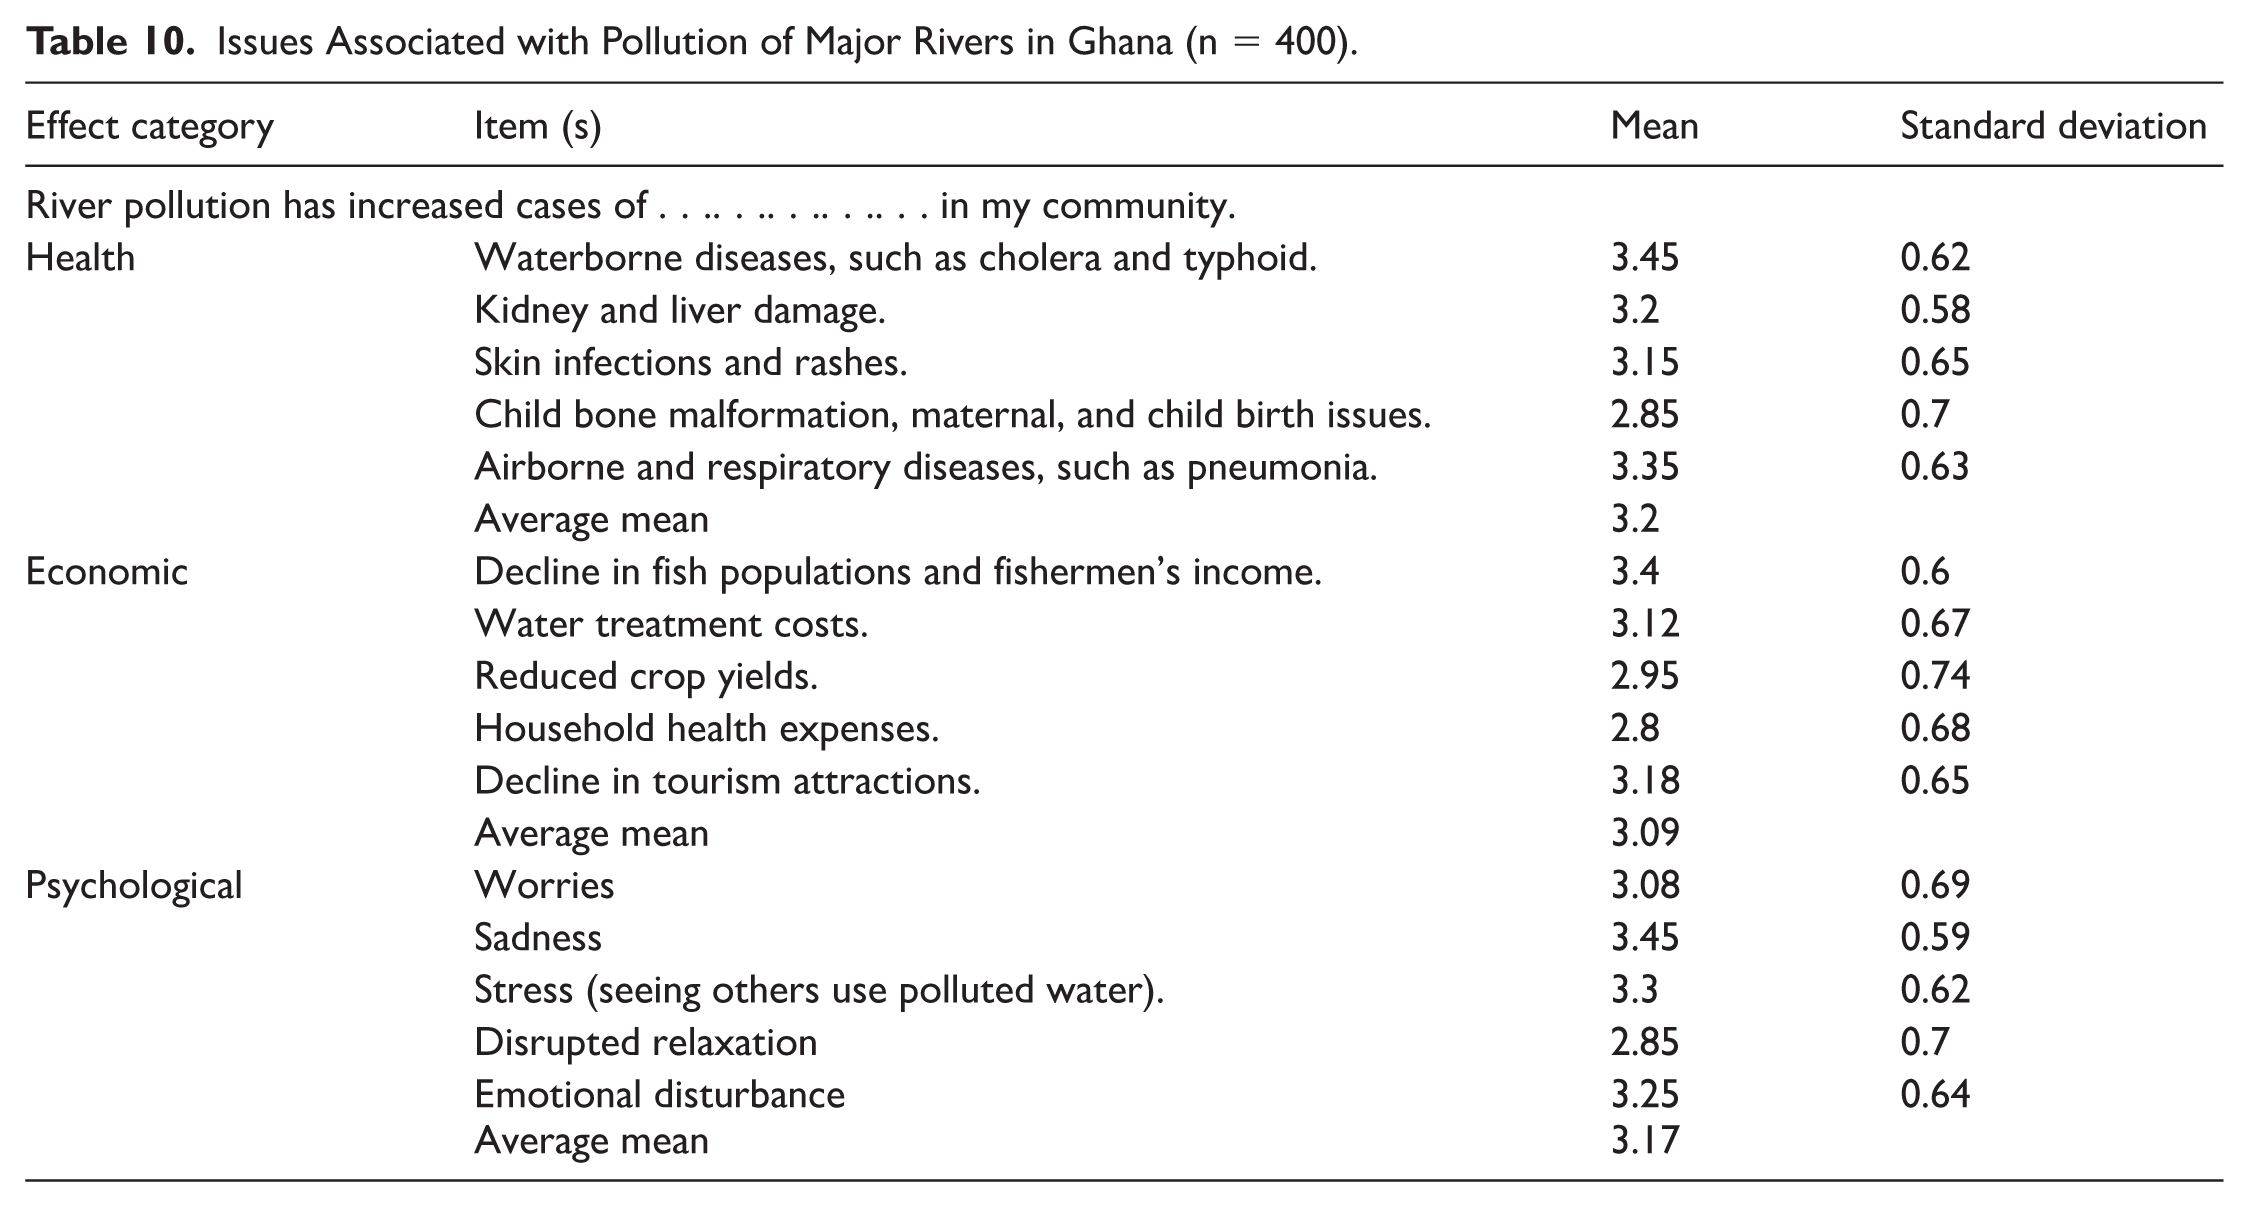
Respondents expressed strong concern about the economic effects of river pollution. The decline in fish populations and reduced income for fishermen ranked highest (mean = 3.4). This reflects that water pollution has an immediate impact on people’s economic activities, most particularly those living near the rivers. Prip 122 establishes that water pollution reduces biological diversity as well as fish production, hence undermining the economic activity of fishing households. Industrial effluvia as well as plastic waste reduce river water levels of oxygen and destroy fish environments, giving rise to poor fish harvests. This impacts rivers directly and makes people pool money for water treatment (mean = 3.12). Dirty rivers mean that people invest more in cleaner water for drinking, cooking, or bathing. Water pollution also negatively impacts agricultural production. Farmers using polluted river water for irrigation often obtain low yields and produce crops that may be contaminated and unsafe for consumptioners can neither harvest much nor ensure that the food is clean from polluted water (mean = 2.95). Chemicals in polluted water degrade soil quality and transfer toxins into crops, harming both local consumption and market sales.
Additionally, tourism has declined (mean = 3.18). Visitors avoid polluted rivers due to bad odours, unattractive scenery, and health risks. This decline reduces income from eco-tourism, recreation, and hospitality. Sompolska-Rzechuła et al 123 emphasised that environmental degradation severely limits Ghana’s tourism potential. River pollution not only affects subsistence but also hampers broader economic development in affected regions. Besides, results further show that river pollution has also created widespread psychological stress. Sadness ranked as one of the most intense emotional response (mean = 3.45). People feel defeated by watching their living rivers become polluted and lifeless. Rivers not only have economic uses but also cultural and spiritual significance to people’s lives. Adding to this community stress are people observing children suffering from polluted water (mean = 3.3). People feel hopeless because there are no other safe employment alternatives and are frightened by the absence of solutions to their economic hardship. Emotional disturbance (mean = 3.25) and general worry (mean = 3.08) highlight the mental toll of constant exposure to environmental degradation. These emotional responses stem not only from health concerns but also from uncertainty about the future. Yirenkyi-Fianko and Ottou 51 found that environmental degradation increases depression and anxiety, particularly when individuals feel incapable of addressing the problem. In polluted communities, residents witness the slow destruction of natural resources and live with the daily stress of illness, financial instability, and ecological loss. Images of dirty water, dead fish, and struggling children serve as constant reminders. This psychological distress calls for urgent mental health support, alongside environmental remediation and public education campaigns.
Table 11 presents possible strategies for river protection in Ghana. The majority (97.14%) in Table 9 strongly agree that establishing stricter regulations reduces the impacts of industrial discharges and safeguards the waterways of the rivers. Stricter regulations force industries to adopt and implement measures that mandate waste treatment before discharge. As reported by Bataineh et al 124 and Lah and Kotnik 125 stricter regulations make companies operate within environmental laws, ensuring that businesses compete on innovation and efficiency rather than externalising environmental costs. However, 95.71% believed community awareness campaigns can raise public consciousness about river pollution. Commodore et al 126 found that increasing awareness among communities helps to better understand the consequences of pollution, encouraging individuals and groups to participate in environmental protection initiatives actively. Respondents (94.29%) believe that regular monitoring and assessment of river water quality can reduce the concentration of pollutants in the rivers. This suggests that regular monitoring and assessing the quality of water bodies ensure that sources of pollution are identified in time, leading to the development of targeted interventions aimed at ensuring effective management of water quality.
Strategies for Effective Rivers Protection (N = 400).

Abbreviations: SA, strongly agree; A, agree; N, neutral; D, disagree; SD, strongly disagree.
Furthermore, community engagement in river clean-up initiatives (95.71%) indicates that local communities cannot be excluded from protecting the rivers understudy. This finding implies that communities should exhibit responsible behaviours such as proper waste disposal, improved sanitation and reduced pollution of water sources. Lema 127 reported that local stewardship and shared responsibility help to sustain the protection measures of water and enhance long-term water resource management. This study also found that promoting sustainable agricultural practices (97.14%) and investing in wastewater treatment facilities (97.14%) protect rivers in Ghana. Xia et al 128 and Zhu et al 129 indicate that sustainable agricultural methods, including conservation of trees around water bodies, significantly reduce runoff pollution into water bodies. Another aspect observed from the study was the role of governance and accountability in managing rivers (92.86%). This emphasises the significance of a transparent and participatory process in decision-making if rivers are to be preserved. Accountability and governance help communities have trust and confidence in the effectiveness of river conservation initiatives by the government. 130
Conclusion and Recommendation
This study examined water quality of 6 major rivers in Ghana and how socio-economic, health, psychological, and environmental impact water pollution in rural communities besieging the rivers. Arsenic, lead and mercury levels of the major rivers in Ghana have increased. Notwithstanding, arsenic, lead, mercury, total dissolved solids, and nitrates primarily influence the water quality of the rivers. Moreover, mining activities contribute more to the pollution of the 6 major rivers in Ghana than industrial discharges, agricultural runoff and domestic sewage. There are significant concentration differences among water quality parameters such as nitrates, turbidity, electrical conductivity, total dissolved solids, and E. coli. Community perceptions influence the pollution and impacts of major rivers. Multiple regression analysis demonstrates that education, gender and age significantly influence community perceptions of river pollution. Pollution of major rivers in Ghana significantly contributes to emotional distress, financial hardship, and waterborne diseases among affected communities. Therefore, campaign efforts that strengthen regulations, promote sustainable farming practices and support community-based initiatives are necessary to maintain the health of the rivers, and educate the community about the dangers of river pollution and the significance of sustainable water resource management. Consequently, this would contribute to the achievement of the Sustainable Development Goals (SDGs) 6 (Clean Water and Sanitation) and 3 (Good Health and Well-being).
Footnotes
Acknowledgements
The authors acknowledge every respondent who participated in this study.
Consent to Participate
The authors, with written informed consent prior to their involvement, understand the study’s aims and procedures, and the right to withdraw at any time without facing any costs.
Author Contributions
Michael Aboah: Conceptualization, Methodology, Data Collection, Funding, Rriting - Review, Editing, Formal analysis and Writing - Original Draft. Emmanuel Agbo Tei: Funding, Data Collection, Data Analysis, Writing – Review, Editing and Formal Analysis. Michael Miyittah: Funding, Data Anakysis, Writing - Review & Editing. Writing - Review and Editing. Christian Julien Isac Gnimadi: Data Collection and Data Analysis.
Funding
The authors received no financial support for the research, authorship, and/or publication of this article.
Declaration of Conflicting Interests
The authors declared no potential conflicts of interest with respect to the research, authorship, and/or publication of this article.
Data Availability Statement
Access to the data is available upon request.