
Abstract
Exposure to ambient air particulate matter (PM2.5) pollution presents a significant public health and economic challenge in Addis Ababa, Ethiopia. This thesis used the Environmental benefits mapping and analysis program-community edition (BenMAP-CE) software tool to estimate health and economic impact of ambient air PM2.5 pollution. The study evaluated the impact of decreasing the annual average PM2.5 concentration in 2019 (32.8 µg/m3) to different international and national air quality standards, including World health Organization’s guidelines and the Ethiopian National Ambient Air Quality standard (NAAQS). Results showed that Addis Ababa exceeded both WHO’s and Ethiopia’s ambient air quality standards in 2019. The study estimated the attributable deaths from cardiovascular, ischemic heart disease (IHD), stroke, chronic obstructive pulmonary disease (COPD), and lower respiratory infection (LRI) due to PM2.5 exposure across 3 reduction scenarios. Additionally, economic benefits associated with avoided deaths were quantified using the Organization for Economic Cooperation and Development (OECD) Value of Statistical Life (VSL) methodology. The finding demonstrated that reducing PM2.5 pollution levels led to a notable decrease in mortality rates from various health conditions in Addis Ababa. Moreover substantial economic benefits, amounting to millions of dollars, were observed across all health endpoints, indicating significant societal savings. This study underscores the importance of implementing interventions to mitigate PM2.5 pollution for improved public health and economic well-being in Addis Ababa and similar urban settings.
Introduction
Air pollution stands as the world’s most significant environmental health threat, responsible for millions of deaths and illnesses each year. 1 It imposes an economic burden of over $8 trillion annually on the global economy. 2 The World Health Organization (WHO) reported that in 2016, exposure to ambient particulate matter with an aerodynamic diameter of less than 2.5 µm (PM2.5) contributed to an estimated 4.2 million premature deaths globally, primarily linked to respiratory illnesses, cardiovascular diseases as well as cancer. 1
In 2019, more than 90% of the global population was exposed to annual average PM2.5 levels exceeding the WHO’s recommended Air Quality Guideline (AQG) of 10 µg/m³, established in 2005. 3 Long-term exposure to PM2.5 has been linked to increased mortality risks for several health conditions, including all causes (4%-14%), cardiopulmonary diseases (6%-13%), cardiovascular diseases (6%-26%), ischemic heart disease (10%-24%), chronic obstructive pulmonary disease (COPD) (17%), lung cancer (5%-37%), among others.4 -7
Economically, air pollution increases government expenditures on health insurance, treatment, and rehabilitation. 8 Non-communicable diseases like cardiovascular and respiratory illnesses impose significant financial burdens on low- and middle-income countries. 9 , 10 Therefore, effective air pollution management can yield substantial health and economic benefits.
Exposure to air pollution poses a significant risk in urban areas, where high population densities and numerous emission sources intensify health risks. 11 Traffic emissions are a primary contributor, 12 with urbanization further compounding the impact through increased energy consumption, construction activities, industrial operations, and vehicle usage. 13
In Addis Ababa, the capital of Ethiopia, PM2.5 pollution is a major concern due to its health and economic impacts. Daily PM2.5 levels are 1.7 times higher than the WHO-recommended 24-hour guideline, and the annual mean PM2.5 concentration significantly exceeds the WHO annual standard of 10 µg/m3, resulting in a considerable burden of attributable deaths. 14 PM2.5 pollution is known to cause respiratory and cardiovascular diseases, leading to increased healthcare costs and reduced productivity.
The impacts of ambient air pollution on health have been estimated using various methods, including logistic regression, linear models, and concentration-response functions. Software tools such as BenMAP-CE, AirQ
Despite the known adverse effects of PM2.5 pollution, comprehensive data on its health and economic impacts in Addis Ababa is lacking. To address this gap, this study aims to use the Environmental Benefits Mapping and Analysis Program-Community Edition (BenMAP-CE) model to estimate the health and economic impacts of ambient PM2.5 pollution in Addis Ababa.
A novel aspect of this study is the calculation of financial benefits and the evaluation of avoided deaths from cardiovascular diseases, ischemic heart disease (IHD), stroke, COPD, and lower respiratory infections (LRI) under various regulatory scenarios for PM2.5 pollution in Addis Ababa. These aspects have been overlooked in previous studies. Given that the COVID-19 pandemic began in Ethiopia in 2020, this study utilizes the 2019 data to avoid potential confounding effects.
Materials and Methods
Software tool
The Environmental Benefits Mapping and Analysis Program-Community Edition (BenMAP-CE) version 1.5.8 was used to calculate the health and economic effects of ambient air PM2.5 pollution in Addis Ababa. It is a Geographic Information System (GIS)-based tool that generates exposure surfaces at the population level, assessing changes in various health outcomes linked to ambient air pollution. 18 It is sophisticated, user-friendly, and capable of measuring both the quantity and economic value of health effects resulting from changes in air pollution concentrations. 19
Study area
Addis Ababa, the capital city of Ethiopia, is located at an elevation of 2355 m (7726 ft) above sea level and covers an area of approximately 527 km2. As of 2019, the city’s population was estimated to be 3.6 million, based on projections made in 2013 by the Central Statistics Agency 20 making it one of the Africa’s most dense populated urban centers, with a population that continuous to grow steadily. However, rapid urbanization has led to challenges such as increased automobile emissions, resulting in issues like air pollution. The climate is divided in to 2 seasons based on the amount of precipitation. The months from June to September are rainy; while the months from October to May are dry. 21
The PM2.5 data source was the 2 monitoring stations within the city. One at US embassy premises located at a latitude 9°3′29.1″N and a longitude of 38°45′49.1″E. the second was at the Black Lion Hospital (BLH) with a latitude of 9°1′13″N and a longitude of 38°44′58″E (Figure 1).

Study area map.
PM2.5 ambient air concentration data
To assess air quality in Addis Ababa, this study used data from 2 operational Beta Attenuation Monitors (BAMs): 1 located at US Embassy and another at Black Lion Hospital (BLH). These BAMs are part of monitoring network in the city that include a third BAM device at the International Community School, also managed by the us embassy; however data from this site were unavailable for 2019. 22 The Addis Ababa University PM2.5 monitor, operated in collaboration with the East Africa Geo Health hub, i is situated within the College of Health Science at BLH. PM2.5 concentration Data from the US embassy BAM, acquired through the Air Now website, ii provided hourly measurements, which were modified to exclude any negative concentration and subsequently averaged to derive daily PM2.5 values. In contrast, the BLH BAM data were pre-validated and provided in daily averages.
To maximize the data for analysis, missing daily values were filled by averaging the PM2.5 concentration of the preceding and following days. For gaps of 2 to 5 consecutive days, linear interpolation method was applied, while periods with 6 or more consecutive days of missing data were left blank to maintain data integrity. For this analysis, 312 days of BLH BAM data (85.5%) and 300 days of US Embassy BAM data (82.2%) of possible daily averages were used. Both BAM devices followed routine calibration and quality assurance protocols, with checks on sensor functionality. The US Embassy BAM typically undergoes calibration every 6 to 12 months, with specific records maintained by the Embassy. Additional quality control procedures include both automatic and manual checks to identify any address anomalies, such as negative values, which may result from low particulate conditions or equipment malfunctions. This combined data set provides a comprehensive foundation for assessing PM2.5 pollution levels and trends in Addis Ababa.
To estimate the air quality in unmonitored sites in the city, the Voronoi neighborhood averaging (VNA) approach was applied, it is a spatial interpolation technique utilized in the BenMAP-CE. This approach creates a Voronoi diagram of the available monitors and, based on the distance, allocates each population grid cell to the closest monitor or a weighted average of the closest monitors.
The VNA approach was used to calculate the population-weighted exposure at the neighborhood level based on the mean yearly and daily PM2.5 concentrations. 18
Health impact assessment
BenMAP-CE
The model calculates the number of affected individuals by analyzing changes in concentration between control and baseline scenarios, using population and health concentration-response functions. Additionally, it evaluates the cost-effectiveness of these concentration changes. 23
In order to compute health impacts, BenMAP-CE uses a health impact function that takes into account population data, baseline incidence rates, monitoring air quality data, and an effect estimate.18,24
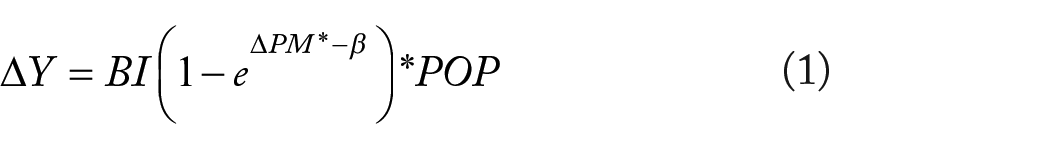
The mortality reduction from an ambient value to a target or standard can be calculated using ΔPM2.5. Equation (1) is utilized in BenMAP-CE to determine the change in incidence rate as a function of ΔPM2.5:
Where:
ΔY = the number of estimated premature death,
β = the risk estimate (or Beta coefficient) from an epidemiologic study,
ΔPM = the defined change in concentration of air pollutant to some target or health standard value,
BI = the baseline (incident) rate of deaths,
POP = the population affected by air pollution. 25
Exposed population
In this study, the exposed population is defined as the residents of Addis Ababa in 2019. Age-specific population data for Addis Ababa were derived from the Central Statistics Authority’s (CSA) 30-year projection (2007-2037) based on Inter Central Population Survey (ICPS) 2012 Projection Report. 20 According to this projection, the population of Addis Ababa in 2019 was estimated to be 3.6 million, with approximately 58.7% of residents aged 25 years and older.
Baseline incidence rate (BI)
The baseline incidence rate (BI) refers to the annual number of deaths due to all natural causes in each sub-region. 19 It is the ratio of death to population size over a given time period. 26 Cause-specific mortality data for Addis Ababa, focusing on cardiovascular diseases, stroke, ischemic heart disease (IHD), chronic obstructive pulmonary disease (COPD), and lower respiratory infections (LRI), were sourced from the Global Burden of Diseases website. 27 This dataset provides annual age-specific estimates across various 5-year age groups. The incidence rate of selected health endpoints per 100 000 Population was indicated in the Table 1.
Baseline incidence used in this study.

Abbreviations: COPD, chronic obstructive pulmonary disease; IHD, ischemic heart disease; LRI, lower respiratory infection.
The risk estimate (β coefficient)
The β coefficient represents the relationship between PM2.5 exposure and specific health outcomes. It is derived from concentration-response functions or health effect models, 28 quantifying the risk of adverse health effects associated with a unit change in ambient air pollution. Models such as the Integrated Exposure Response (IER) and the Global Exposure Mortality Model (GEMM) are used to estimate these β coefficients. 29
In epidemiological studies, β coefficients can also be inferred from relative risks (RR), odds ratios (OR), or hazard ratios (HR). The equations for computing β and its standard error (βse) are as follows. 18

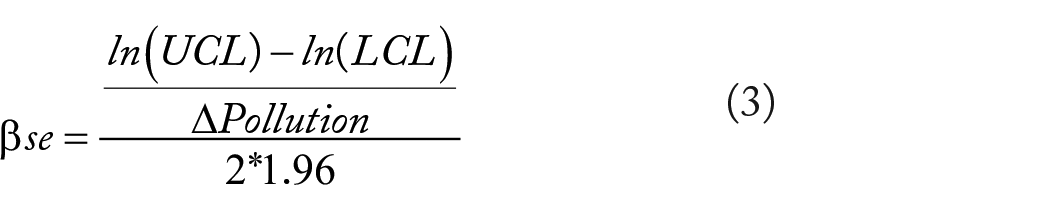


Where ln is the natural logarithm, LCL is the lower confidence limit, and UCL is the upper confidence limit.
To generate concentration-response function, it is ideal to use local population exposed to PM2.5 with similar levels and chemical composition. However, there are no specific studies available for Ethiopia that can be utilized. Consequently, this study utilized international β coefficients (see Table 2).
Beta function for each health endpoint and the studied age group.

Abbreviations: COPD, chronic obstructive pulmonary disease; IHD, ischemic heart disease; LRI, lower respiratory infection.
The β coefficients used in this study, while derived from robust epidemiological studies in high-income countries, may have limited applicability to the Addis Ababa population due to distinct differences in exposure levels, baseline health conditions, and socioeconomic and environmental contexts. In Addis Ababa, PM2.5 exposure arises from unique sources such as biomass burning, older vehicle fleets, and unregulated industrial activities, which differ from the regulated and often more homogeneous sources in high-income regions. These variations can result in differences in the chemical composition and toxicity of PM2.5, potentially altering the magnitude or nature of health impacts, as the β coefficients from international studies may not fully capture these regional characteristics. Furthermore, the population in Addis Ababa faces limited access to healthcare, which could amplify the health impacts of PM2.5 exposure compared to population in high-income countries. To address this, the study utilized β coefficients derived from multiple high-quality international studies to account for a broader range of potential outcomes. The study by Krewski et al. 5 utilized β coefficients derived from the American Cancer Society (ACS) extended follow-up cohort study, involving 552 138 individuals aged 30 years and older across all 50 US states from 1982 to 2000. This study found significant associations between increased PM2.5 exposure and mortality from all causes, cardiovascular diseases, ischemic heart disease (IHD), and lung cancer.
Additionally, the Harvard 6 Cities (H6C) study, which included 8096 participants from 6 eastern US cities aged 25 to 74 between 1974 and 2009, highlighted strong links between PM2.5 exposure and lung cancer, cardiovascular diseases, and overall mortality. 4
Moreover, So et al. 30 in Denmark reported positive correlations between PM2.5, NO2, black carbon, and mortality from lung cancer, respiratory diseases, and natural causes among 4.4 million participants aged 30 to 85.
Pope et al. 31 demonstrated a 12% increased risk of cardiovascular and cardio metabolic mortality per 10 μg/m3 increase in PM2.5 exposure in the US, underscoring the significant cardiovascular health risks associated with PM2.5.
Lastly, Cesaroni et al. 6 emphasized significant associations between PM2.5, NO2, and the risk of lung cancer, ischemic heart disease, stroke, and chronic obstructive pulmonary disease in Italy.
Economic valuation
Improvements in air quality can significantly reduce adverse health effects in communities, such as mortality and morbidity. In economics, the value of preventing a death is quantified through various methods. BenMAP-CE, for instance, calculates the economic value of health benefits by estimating the number of deaths prevented and multiplying it by the economic value per case. 32
BenMAP-CE employs 3 key financial metrics to assess the economic impact of air quality improvements: willingness to pay (WTP), Cost of illness (COI), and value of statistical life (VSL). The COI encompasses expenses related to treatments, hospital stays, and other direct costs, including lost wages. However, it does not account for intangible costs such as pain and suffering. 33 WTP extends beyond COI to include costs associated with suffering, dissatisfaction, and the value of leisure time.
The VSL represents the amount individuals collectively agree to pay to marginally reduce the population’s risk of premature death due to environmental factors. 32 It is a commonly used metric in BenMAP-CE for estimating economic impacts compared to COI and WTP. Importantly, VSL does not assign a monetary value to individual lives but rather reflects societal preferences regarding risk reductions from environmental hazards.
In the absence of a specific VSL value for a country, references such as the Organization for Economic Cooperation and Development (OECD) or guidelines from the US EPA can be used to derive an appropriate VSL. 34
To estimate the economic impact of excess mortality, the avoided mortality rate is multiplied by a locally applicable VSL estimate. Ideally, national or regional studies should determine the economic value of life years lost. In cases where such data are lacking, equation (6) can be used, employing a “benefit-transfer” approach as suggested by Narain and Sall, 35 which adapts unit health costs from external studies to local conditions. This adjustment aims to scale VSL considering income disparities.
Ethiopia currently lacks a domestic value of a statistical life (VSL) estimate. Consequently, OECD’s VSL values, which are widely recognized and used in policy contexts, serve as a credible and research based benchmark for health economic valuations. 36 Therefore, VSL data from OECD countries were applied to derive preliminary VSL estimates suitable for Ethiopia. According to recent estimates, 35 the VSL for OECD nations was USD 3.83 million at 2011 purchasing power parity (PPP). This was adjusted using the following equation:
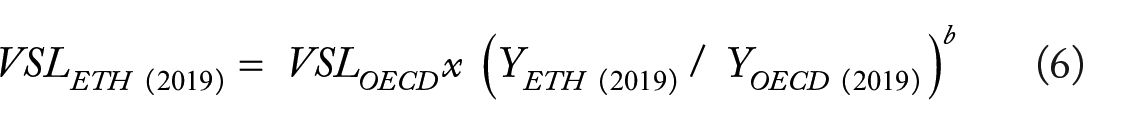
Where VSLETH is the VSL for Ethiopia, Y is the Gross domestic product (GDP) per capita, and b is the income elasticity of the VSL, which captures the typically observed increasing willingness to pay for health with higher incomes. For low- and middle-income nations, b ranges from 1.0 to 1.4, with average estimate of 1.2. 35 (Table 3).
VSL calculation for Ethiopia.

World Bank website https://data.worldbank.org/indicator/NY.GDP.PCAP.CD.
Economic research website https://fred.stlouisfed.org/series/ETHNGDPRPCPPPT.
While the OECD VSL of USD 3.83 million (2011 PPP) was scaled to Ethiopia based on relative GDP per capita and an income elasticity of 1.2, several contextual factors suggest that VSL values for Addis Ababa would like differ from those of OECD countries. Given Ethiopia’s significantly lower GDP per capita, the absolute willingness to pay for risk reduction and thus the VSL is expected to be lower in Addis Ababa. However, in low-income settings like Addis Ababa, where healthcare access is limited and the disease burden is high, individuals and societies may place a relatively higher value on risk reductions, reflecting the greater urgency of addressing health risks. While the adjusted VSL provides a credible starting point, it remains a proxy and may not fully capture the local socioeconomic and cultural realities of Addis Ababa. This underscores the need for Ethiopia-specific studies to refine health economic valuation and better represent local preferences and priorities.
Counterfactual scenarios
The difference between the initial air pollution level (baseline) and concentration following an intervention, such as a new regulation (control), is the change in air quality (ΔPM). The annual average PM2.5 concentration in this study for 2019 (32.8 µg/m3) baseline scenario: 3 control scenarios were considered to be surveyed.
Scenario I: Rollback PM2.5 concentration to meet the Ethiopian yearly average standard (NAAQS) of 15 μg/m3. 37
Scenario II: Rollback PM2.5 concentration to meet the WHO’s yearly average air quality guideline 10 µg/m3 (introduced in 2005 and updated to Interim Target 4 in 2021). 3
Scenario III: Rollback PM2.5 concentration to the annual average air quality guideline value of 5 µg/m3 set by World Health Organization (WHO) (introduced in 2021). 3
The number of death that would have been prevented as a result of changes in annual average PM2.5 concentration between the control scenarios and the baseline was determined using BenMAP-CE (Figure 2).

Workflow of the study procedure.
Uncertainty analysis
In this study comprehensive approach that combines data verification and assumption testing was used to address the uncertainty of estimating health and economic impact. The study examines data from reliable sources such as World Health Organization (WHO) and national statistics services (ESS) to ensure their validity and sustainability for the analysis. These techniques help the thesis to provide more detail and accurate understanding of the uncertainty involved in the estimation process, and to increase trustworthiness the relevance of the study findings.
Ethical consideration
The study relied on secondary data and did not involve the collection of personal information such as names or contact details. As a result the use of a consent form was not necessary.
Results and Discussion
PM2.5 concentration
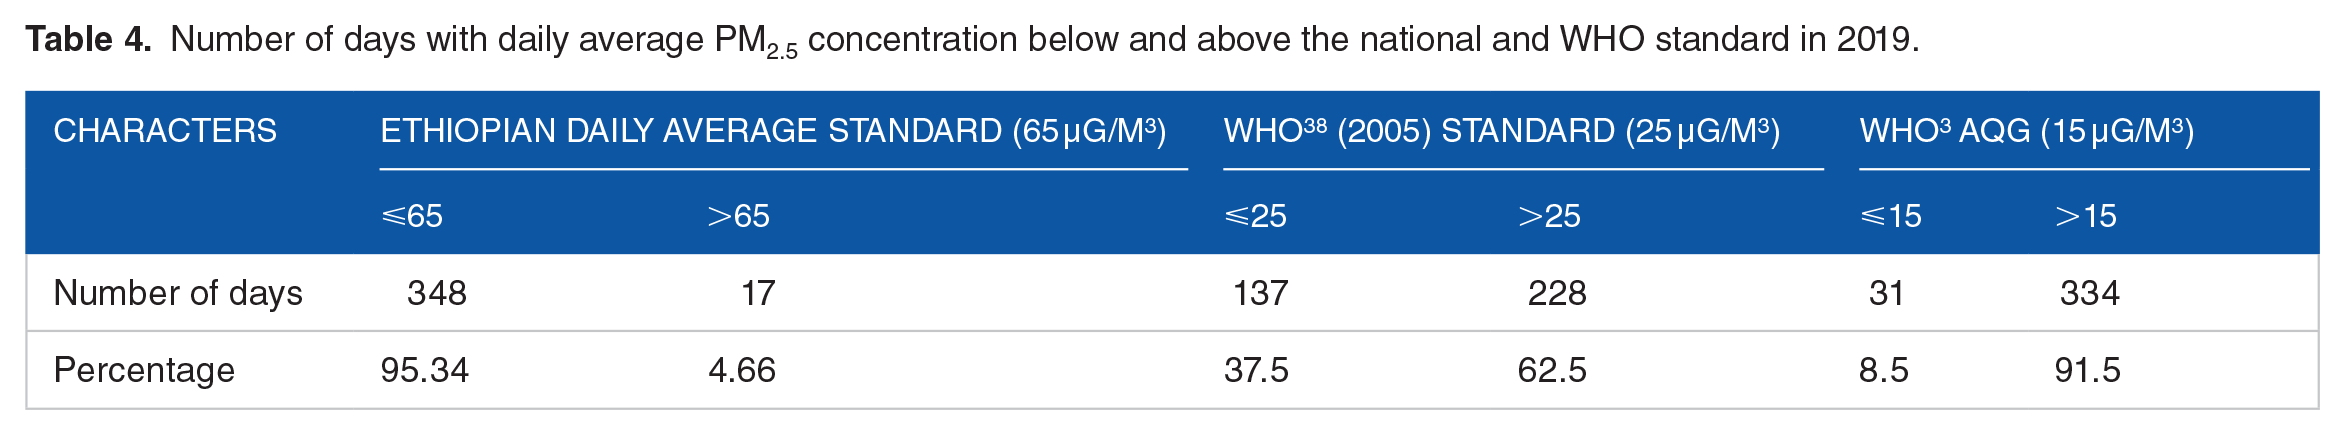
The quality of air in Addis Ababa in 2019 was within acceptable limit based on Ethiopian daily standards for 95% (348 days) below 65. However, there were a significant number days in the city where the daily PM2.5 level was higher than the World Health Organization (WHO) recommended daily average air quality guideline (AQG); 91.5% (334 days) were higher than 15 µg/m3, and 62.5% (228 days) were higher than 25 µg/m3 (Table 4). Such frequent exceedances of the WHO daily PM2.5 guideline highlights persistent pollution levels, putting residents at prolonged health risks from exposure to hazardous air.
Number of days with daily average PM2.5 concentration below and above the national and WHO standard in 2019.
The Average PM2.5 concentrations of the different months in 2019 are shown in Figure 3. The highest PM2.5 concentration was recorded in July (87.42 µg/m3) and June (82.17 µg/m3) followed by September (68.35 µg/m3) and August (61.58 µg/m3). On the other hand, the lowest was recorded in November (9.7 µg/m3) and April (9.88 µg/m3) followed by October (10 µg/m3) and March (11 µg/m3). In the rainy season (June to September), highest PM2.5 concentration was recorded. Elevated humidity levels and frequent cloud cover during this period can limit the vertical mixing of air, contributing to higher ground level concentration of PM2.5. High relative humidity dampens solar heating which reduces the conviction current needed to disperse fine particles. Additionally, water droplets suspended in the atmosphere due to persistent cloud cover provide a medium for PM2.5 to accumulate, leading to increase local concentrations.39 -41 The lower PM2.5 concentrations observed from October to April, compared to other months, may be attributed to the higher daily temperatures during this period. Ongoing emissions from vehicles and households may be less concentrated due to more effective air mixing, which is enhanced by higher temperatures. Elevated temperatures increase atmospheric instability, promoting vertical mixing that disperses PM2.5 particles over a large air volume, thereby reducing their concentrations near the surface.42 -44
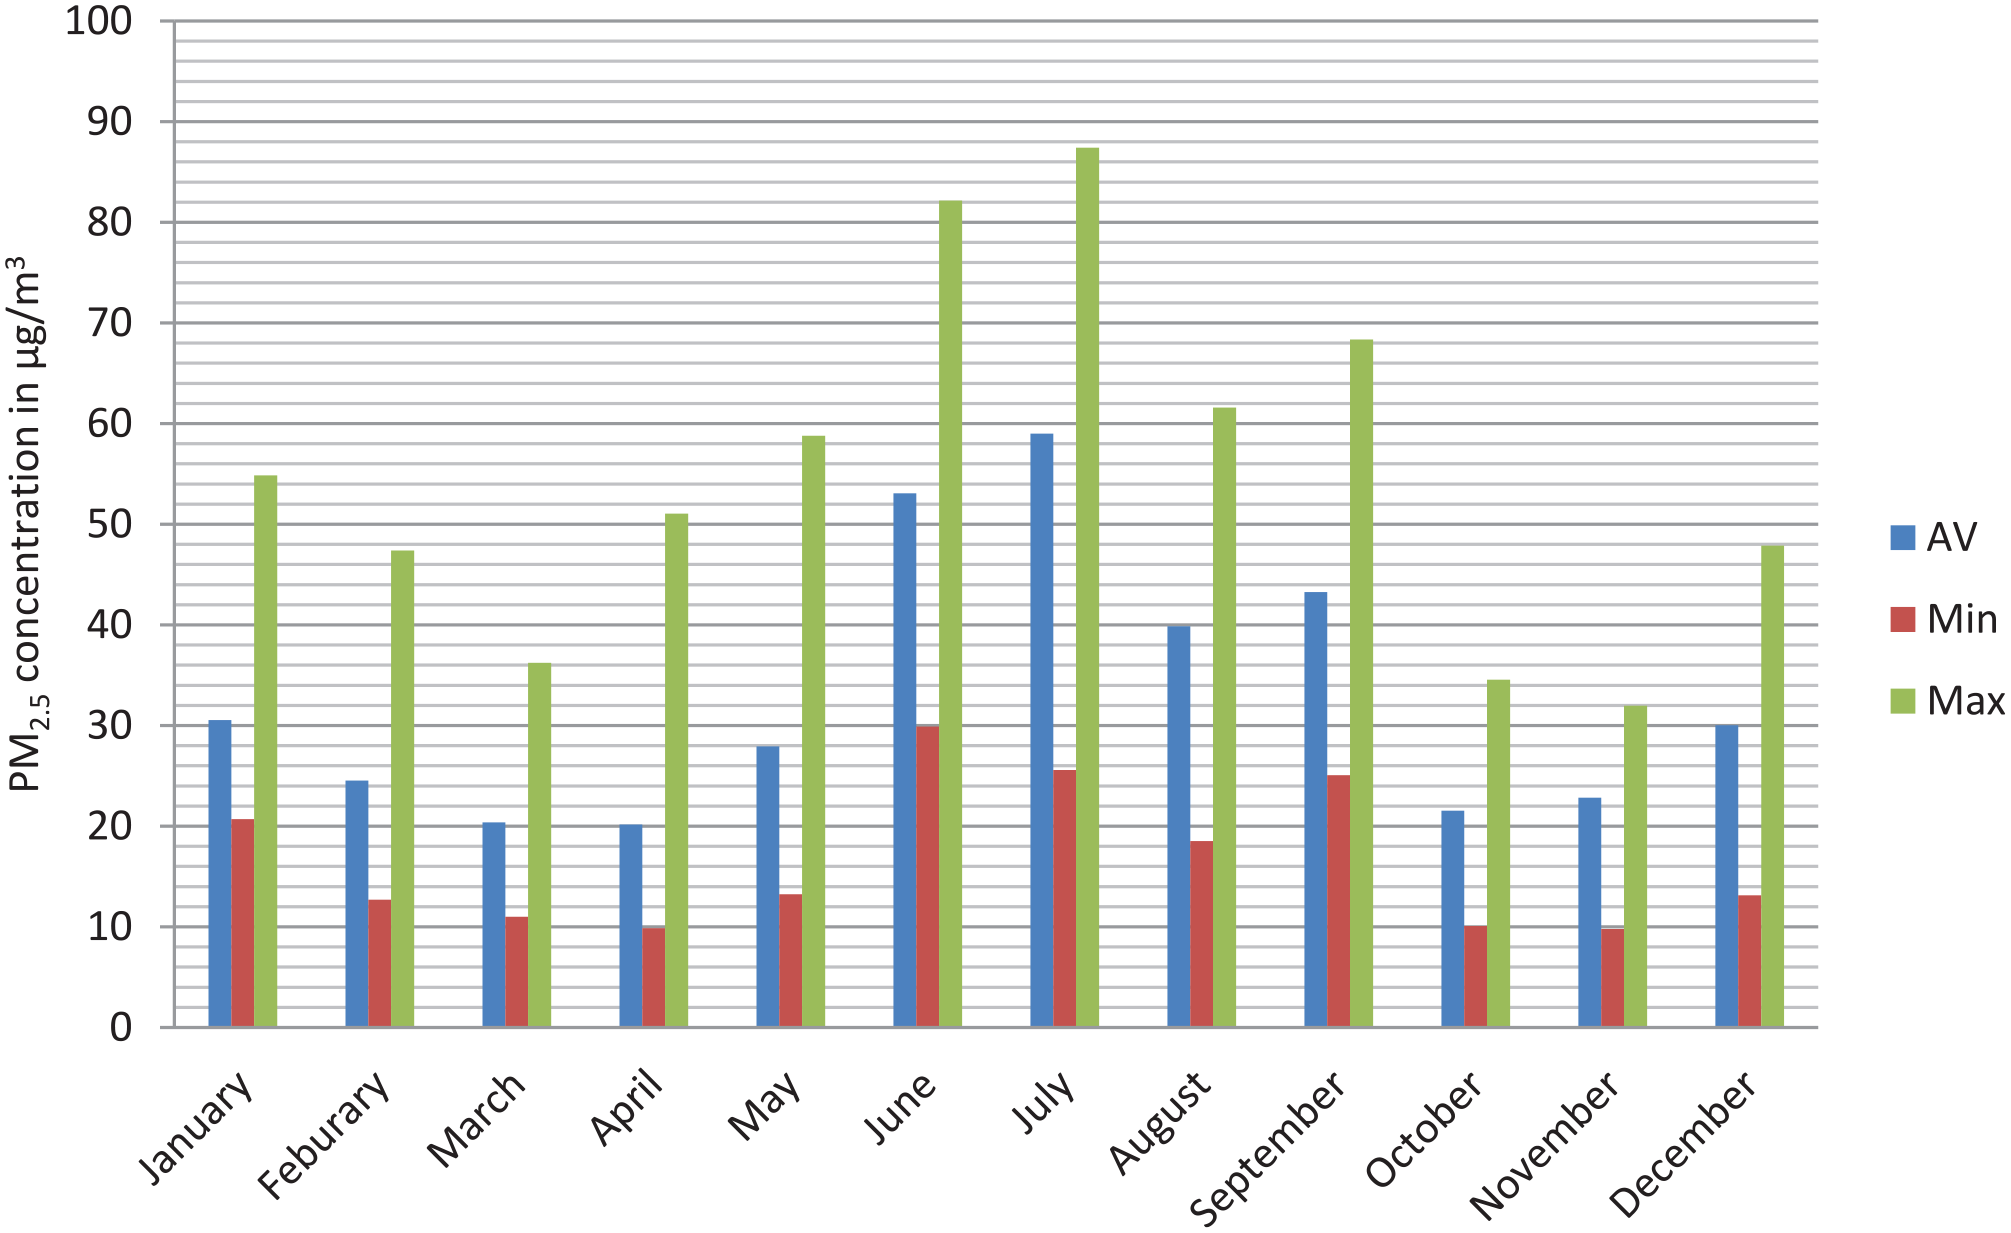
Monthly average, minimum, and maximum of PM2.5 concentration in 2019.
This study provides further evidence to support the conclusion drawn from the previous study conducted in 2021. 14 Research conducted in India, 45 Mongolia, 46 and California/US 47 demonstrated similar variability in PM2.5 concentration, with higher levels in colder season due to restricted atmospheric mixing and increased local emissions, and lower levels in warmer, dry seasons where enhanced air mixing aids pollutant dispersion.
In 2019, the yearly average PM2.5 concentration in Addis Ababa was 32.8 µg/m3. This value was notably higher than the recommended air quality guidelines set by the World Health Organization (WHO), being approximately 6.5 times the WHO annual average guideline, 3.3 times the WHO interim target 4, and 2.2 times the National Ambient Air Quality Standard (NAAQS). These levels were higher than the latest WHO annual average PM2.5 guideline established in 2021 (5 µg/m3), as well as the previous guideline set in 2005 (10 µg/m3). 3 Furthermore, the PM2.5 surpassed the Ethiopian Annual Ambient Air Quality standard (NAAQS) of (15 µg/m3). 37 This indicates that the air pollution in the city caused health hazards to the population exposed to it, such as respiratory issue, cardiovascular problems, and other adverse health effects.
Impacts of PM2.5 reduction on health
According to the defined scenarios using BenMAP-CE, the number of deaths that may have been prevented in 2019 if the 3 control scenarios for PM2.5 concentration had been met is shown in Table 5.
The number of avoided death in 2019 attributable to PM2.5 among the Addis Ababa population.
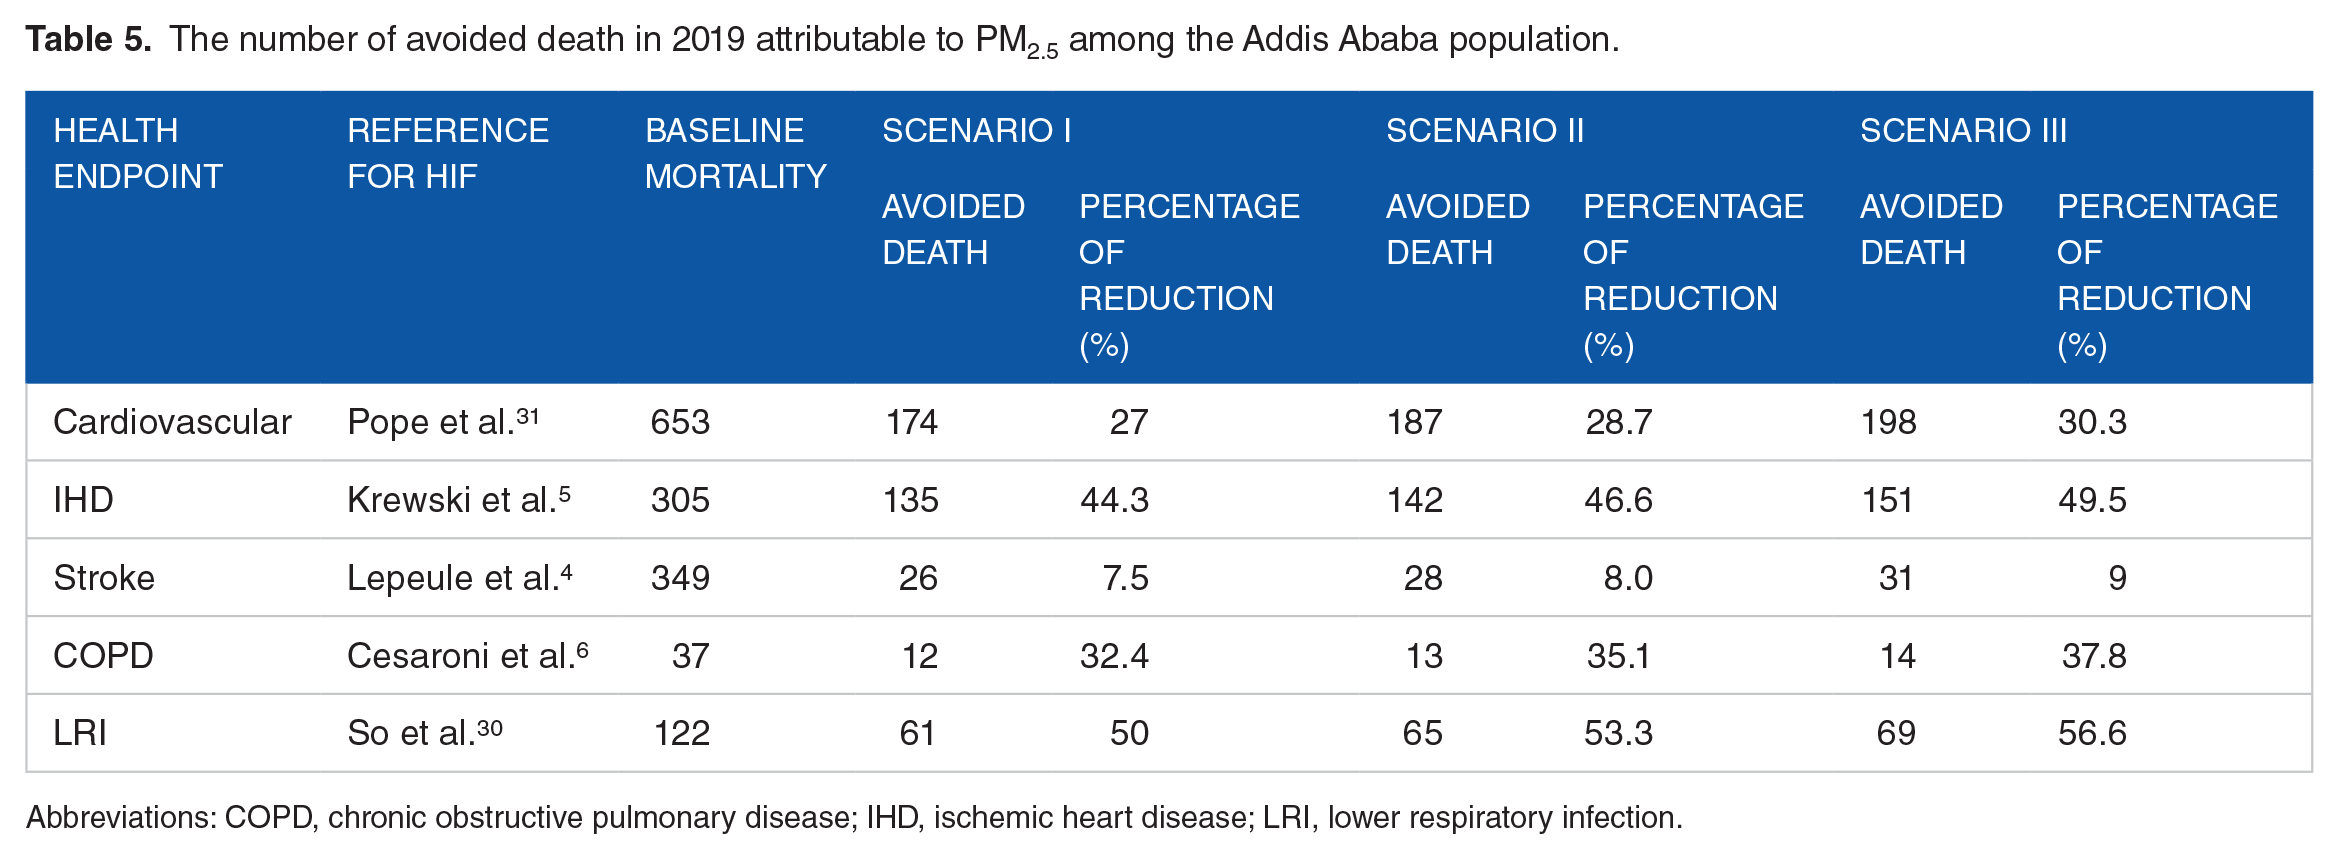
Abbreviations: COPD, chronic obstructive pulmonary disease; IHD, ischemic heart disease; LRI, lower respiratory infection.
Achieving the National Ambient Air Quality Standards (NAAQS) of 15 µg/m3 (scenario I) could have potentially led to a reduction of 174 (27%), 135 (44.3%), 26 (7.5%), 12 (32.4%), and 61 (50%) premature mortalities for Cardiovascular, Ischemic heart disease (IHD), Stroke, chronic obstructive pulmonary disease (COPD) and lower respiratory infection (LRI) respectively in 2019. Further improvement to the WHO annual average guideline interim target 4 of 10 µg/m3 (scenario II) could potentially have led to a reduction of 187 (28.7%), 142 (46.6%), 28 (8%), 13 (35.1%), and 65 (53.3%) premature mortalities for Cardiovascular, Ischemic heart disease (IHD), Stroke, chronic obstructive pulmonary disease (COPD) and lower respiratory infection (LRI), respectively.
Additional Adherence to meet the WHO’s more stringent yearly average air quality guideline of 5 µg/m3 (scenario III) might have resulted even in greater benefits, with estimated reduction 198 (30.3%), 151 (49.5%), 31 (9%), 14 (37.8%), and 69 (56.6%) premature mortalities in the same health categories.
The assessment of health impacts are first computed at district levels, which are then aggregated to the city level. This aggregation can be illustrated in maps that highlight geographic variation in health benefit resulting from reduced PM2.5 levels (refer to Figures 4-6).

Estimated avoided PM2.5-related premature mortality in 2019 across Addis Ababa districts if scenario I (15 µg/m3) for PM2.5 were achieved. Maps (a-e) show avoided death by health endpoints: (a) CVD (11.467-27.885), (b) IHD (8.776-21.286), (c) stroke (1.751-4.272), (d) COPD (0.841-2.041), and (e) LRI (4.086-9.881). Dark green indicates districts with highest reduction in mortality, while darker brown represent districts with lower reduction in mortality.

Estimated avoided PM2.5-related premature mortality in 2019 across Addis Ababa districts if scenario II (10 µg/m3) for PM2.5 were achieved. Maps (a-e) show avoided death by health endpoints: (a) CVD (12.262-29.756), (b) IHD (3.307-22.502), (c) stroke (1.888-4.596), (d) COPD (0.895-2.169), and (e) LRI (4.309-10.401). Dark green indicates districts with highest reduction in mortality, while darker brown represent districts with lower reduction in mortality.

Estimated avoided PM2.5-related premature mortality in 2019 across Addis Ababa districts if scenario III (5 µg/m3) for PM2.5 were achieved. Maps (a-e) show avoided death by health endpoints: (a) CVD (13.037-31.589), (b) IHD (9.804-23.667), (c) stroke (2.025-4.923), (d) COPD (0.948-2.293), and (e) LRI (4.521-10.893). Dark green indicates districts with highest reduction in mortality, while darker brown represent districts with lower reduction in mortality.
The avoided deaths associated with PM2.5 are predominantly higher in areas dense population, designated air quality priority areas, and regions with high pollution levels. Generally, the total number of avoided deaths in any given region is influenced by a mix of factors: the size of population, the reduction in air pollution required to achieve the standard (delta concentration value), the initial mortality rate (POP, ΔPM, and y0, respectively in equation (1)).
In Summary, lowering the PM2.5 concentration to meet both the WHO guidelines and NAAQS in 2019 could prevent approximately 408 deaths in scenario I, 435 deaths in scenario II, and 463 deaths in scenario III for cardiovascular diseases, Ischemic heart diseases (IHD), stroke, chronic obstructive pulmonary disease (COPD) and lower respiratory infections (LRI) in total. These findings underscore the health benefits escalates with more aggressive PM2.5 reduction scenarios, emphasizing the importance of air quality improvement in Addis Ababa for public health.
Comparing the health benefit across countries using BenMAP-CE might present challenges due to varying input factors. These includes differences in PM2.5 level between the baseline and control scenarios, the beta coefficients the mortality rates associated with specific health outcomes. A study conducted in Qom city, Iran using BenMAP-CE model reveled that a reduction in PM2.5 levels from 16.39 to 2.4 in 2019 could potentially avert 1498.6 cases of premature mortality from stroke, 711.57 from Chronic obstructive pulmonary disease (COPD), 27.74 from lung cancer (LC), and 2456.59 from ischemic heart disease (IHD). Furthermore, lowering PM2.5 levels to 10 could altogether prevent 2475.94 premature deaths associated with these 4 health outcomes. 48
In a study from China, the reduction in PM2.5 concentration to 35 μg/m3 (NAAQS) in 2014 would have prevented 47 000, 89 000, and 32 000 deaths from heart disease, respiratory conditions, and lung cancer, respectively. 24 Furthermore, a Wuhan, China study’s findings revealed that a 43.6% decrease in PM2.5 concentration prevented 21 384 premature deaths. 49 Reducing the yearly PM2.5 concentrations from 23 to 10 μg/m3 in 2017 would prevent 64, 715, and 357 premature deaths from LC, IHD, and COPD, respectively, according to the other study conducted in Ho Chi Minh City (HCMC), Vietnam. 34
Economic impacts of PM2.5 reduction
Improving the yearly average PM2.5 concentration produce a considerable financial benefit for Addis Ababa, as indicated in Table 6. Using the Ethiopian VSL, which was estimated to be 124 567.4 USD (Table 3), according to the OECD VSL reference associated with each cause of death in scenario I (15 μg/m3) for Cardiovascular, IHD, stroke, COPD and LRI were 21 674 727.6, 16 816 599, 3 238 752.4, 1 494 808.8, and 7 598 611.4 USD, respectively. In scenario II (10 μg/m3), the economic benefit amounted to 23 294 103.8, 17 688 570.8, 3 487 887.2, 1 619 376.2, and 8 096 881 USD for Cardiovascular, IHD, Stroke, COPD, and LRI, respectively. In scenario III (5 μg/m3), estimated to be 24 664 345.2, 18 809 677.4, 3 861 589.4, 1 743 943.6, and 8 595 150.6 USD in the same health categories.
Estimated economic benefits in 3 PM2.5 reduction scenarios using OECD VSL in Addis Ababa in 2019.
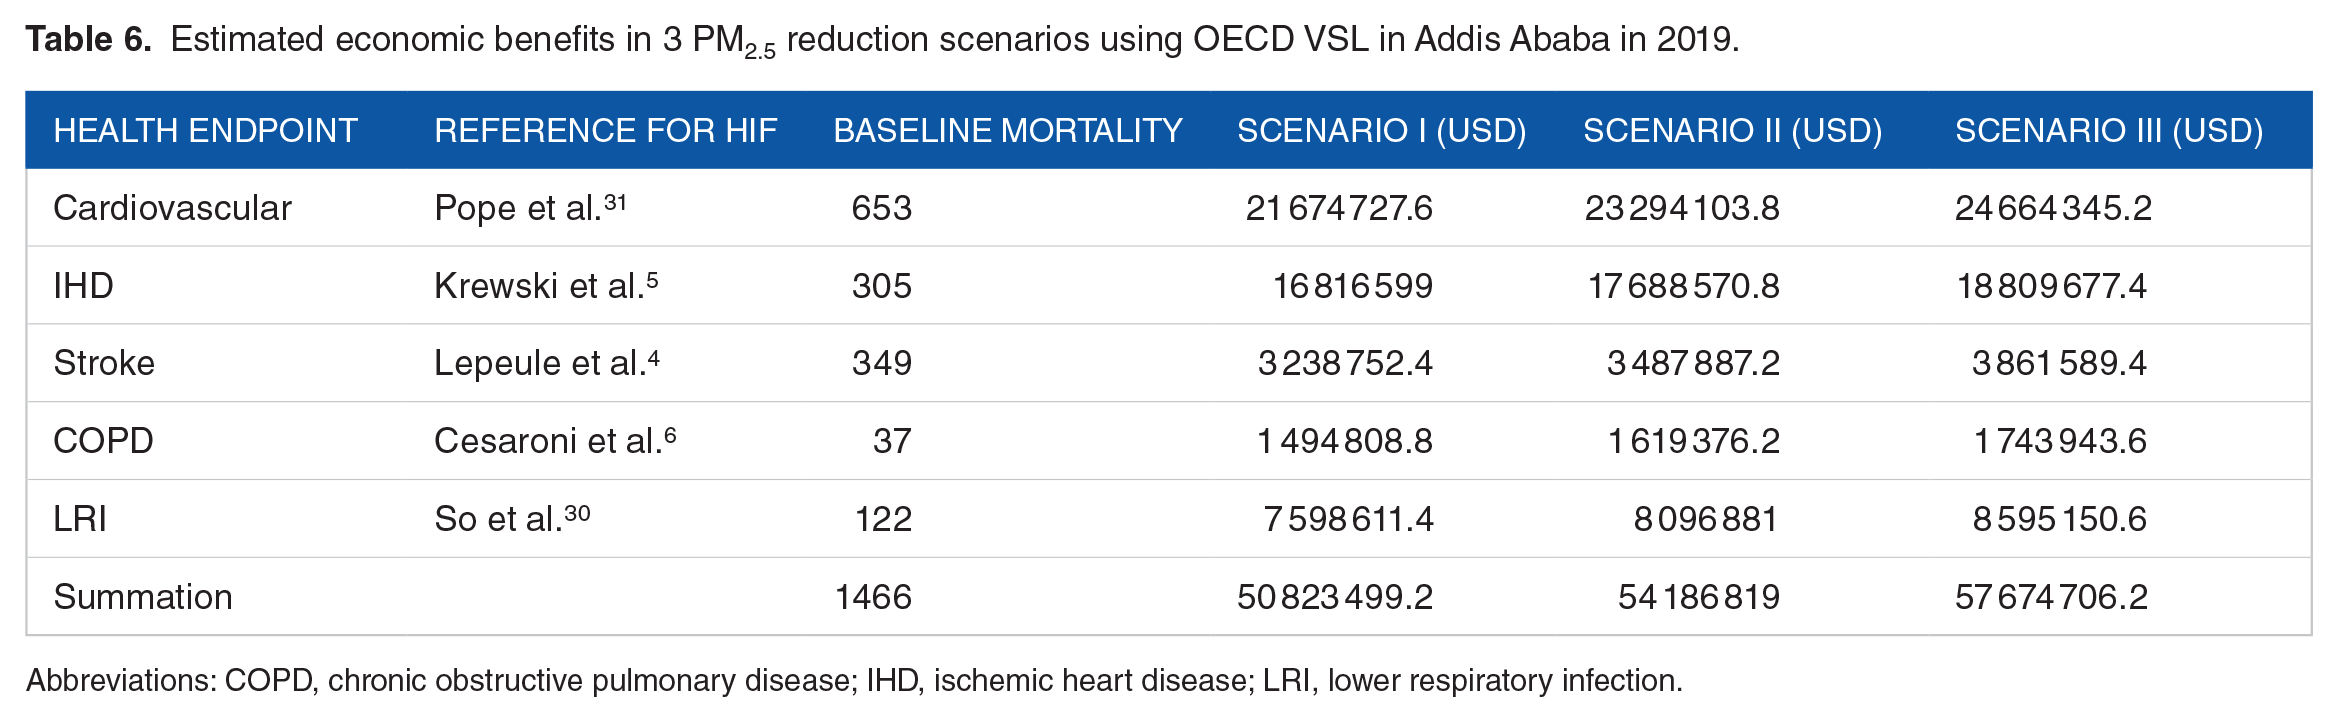
Abbreviations: COPD, chronic obstructive pulmonary disease; IHD, ischemic heart disease; LRI, lower respiratory infection.
The economic benefits in total for these health categories was estimated to be 50.8 million USD in scenario I (15 μg/m3), 54.2 million USD in scenario II (10 μg/m3), and 57.6 million USD in Scenario III (5 μg/m3). The result of this analysis showed that reducing PM2.5 concentration in Addis Ababa has a significant positive economic impact. As the scenarios demonstrate progressively lower PM2.5 concentration targets from 15 to 5 μg/m3 the estimated economic benefits also increase correspondingly. This suggests that more stringent air quality improvement could lead to greater economic savings, likely due to the health-related costs and the enhancement of public health.
Numerous researches have highlighted the substantial economic impacts linked to PM2.5, and this analysis confirms those estimates. The economic advantages of reducing the annual average PM2.5 to 35 µg/m3 in Tianjin, China, were estimated by Chen et al. 50 to be between 18 and 480 million Yuan of China in the 2015. Additionally, a study in South Africa demonstrated lowering PM2.5 to 20 and 10 µg/m3 could yield economic benefits of 14 and 29 billion USDs, respectively. 51
Uncertainty analysis
The health benefits analysis in this study incorporated diverse input data, including air quality metrics, population exposure levels, health impact functions (HIFs), and mortality rates. Each of these variables carrying varying degree of influence on the final out comes. The interpretation of result accuracy approached with caution in subsequent discussions. Reliable data sources were used to derive the population and death incidence rates such as Ethiopian statistical service (ESS) and Global burden of disease (GBD) websites. The reliability of health impact assessments primarily hinges on the selection of health impact functions (HIFs). Notably quantitative investigations in to the relationship of air pollution, particularly PM2.5 and health impacts in Addis Ababa are lacking, constituting a significant source of uncertainty. To mitigate potential errors, HIFs were chosen based on associations between health endpoints and factors like age group and population type. Despite employing various strategies to minimize uncertainty, it remains unavoidable.
To establish the non-anthropogenic background concentration of PM2.5, we adopted a methodology that relied on data from US Embassy PM2.5 monitoring stations. These stations, particularly 1 situated in a relatively “clean site” in Addis Ababa, recorded the lowest PM2.5 concentration of 1.0 µg/m3 over the period 2016 to 2023. Due to the absence of a formally established background concentration of PM2.5 in Addis Ababa, we employed this approach as a means to determine a baseline value.
The concentration of PM2.5 derived from the 2 city-based stations for monitoring could be considered the representative estimate of population exposure, since transportation being identified as the primary contributor of total emission in Addis Ababa. 52 Pervious researches suggests that pollutant concentration measured at fixed monitoring stations can serve as acceptable proxy for estimating individual exposure among residents residing within approximately 40 km of the monitoring station.53-56 All 10 districts of Addis Ababa were located within 40 km radius of the monitoring stations, insuring the reliability of our result.
Strengths and limitations
The primary strength of this study lies in its novelty. To our knowledge, no prior research has been carried out to examine the effects of ambient PM2.5 pollution on health and economy in Addis Ababa. Furthermore, the study incorporated rigorously validated data obtained from EPA-approved air quality monitors and mortality statistics sourced from the website of Global Burden of Disease, Institute for Health Metrics and Evaluation, 2021. This approach not only enhances the reliability of our findings but also underscores the significance of the relationship between air quality levels and their impact on economy and public health outcomes.
A limitation of this research is the application of beta coefficients derived from other countries. Since there are no Ethiopian cohorts that link PM2.5 to different health outcomes, we therefore utilized concentration-response coefficient values that were obtained from international cohorts. These coefficients may not be adequately representative of Addis Ababa Population. Furthermore, our estimations of the health benefits do not take composition into account; they only depend on PM2.5 mass. The age-specific baseline incidence rate available for the entire city, but district level age-specific data is not available. Therefore, in the future, our estimate could be improved by using district level baseline incidence rates and concentration-response coefficients derived from Ethiopian cohorts. Another limitation is the reliance on data from only 2 BAM monitoring sites, located at US embassy premises and BLH premises. While these sites provide valuable insights into PM2.5 concentration in Addis Ababa, relying on just these 2 monitoring points may not fully capture the spatial variability of PM2.5 levels in across the entire city. This constraint arises due to the lack of additional BAM equipment across the city. Additionally the approach of Voronoi neighboring approach (VNA) to estimate PM2.5 concentration in regions without BAMs introduces potential uncertainties. There for the accuracy of these estimations could be enhanced through the installation of monitoring stations in currently unmonitored areas.
Conclusion
In this study, the impact of PM2.5 on health and economy in Addis Ababa was estimated using BenMAP-CE software. Analysis of the air quality data for 2019 revealed that the yearly average PM2.5 concentration in the city was 32.8 µg/m3. This figure significantly exceeds both international standards set by the World Health Organization (WHO) and the Ethiopian ambient air quality standard. The high level of PM2.5 pollution posed serious health risks to the residents of Addis Ababa, as evidenced by the majority of days surpassing the WHO standards for both yearly and daily averages.
The finding underscores that, PM2.5 concentration reduction to meet the international standards set by the World Health Organization (WHO) and the national ambient air quality standard (NAAQS) across 3 scenarios (I, II, III), leads to the notable decrease in mortality attributed to Cardiovascular disease, ischemic heart disease (IHD), Stroke, Chronic obstructive pulmonary disease (COPD), and Lower respiratory infections (LRI) in Addis Ababa. The economic benefits based on the avoided deaths as a result of reduction in PM2.5 levels are considerable. Using OECD VSL methodology, the economic valuation of these benefits in terms of millions of dollars indicates significant societal savings across all health end points. These benefits are particularly prominent in scenarios with more aggressive PM2.5 reduction targets. To support its institutional transformation, Addis Ababa must establish updated criteria for ambient air quality and emission standards, prioritizing alignments with international guidelines. This initiative should include revising current PM2.5 concentration limits to meet the latest WHO recommendations, promoting healthier air quality standards and sustainable urban growth. For future health impact analysis, it is essential to investigate the particular concentration-response function and determine the value of statistical life (VSL) specific to the Ethiopian population.
Footnotes
Acknowledgements
We express our gratitude to the US embassy in Addis Ababa and East Africa Geo Health Hub for providing free access to the PM2.5 dataset. Additionally we extend our thanks to the Center for Environmental Science at Addis Ababa University for their valuable financial support.
Funding:
The author(s) received no financial support for the research, authorship, and/or publication of this article.
Declaration of conflicting interests:
The author(s) declared no potential conflicts of interest with respect to the research, authorship, and/or publication of this article.
Author Contribution
Mulugeta Getachew: Conceptualization, Methodology, Data Analysis, Visualization, Writing-Original Draft, Writing-Review and Editing.
Andualem Mekonnen: Supervision, Validation, Resources, Writing Review and Editing.
Desta Fitsum: Software, Visualization, and Supervision.