
Abstract
Background:
The decline in wheat output in Ethiopia is widely attributed to pests, which has led to a rise in the usage of pesticides to boost productivity. The degree of pesticides sorption and degradation which influence the likelihood of environmental contamination from pesticides seeping into water bodies from soil has not yet been published for Ethiopian soils. The study aimed at to quantify the levels of pesticide residues, assess glyphosate’s adsorption capabilities and degradation rate in the soils.
Materials and methods:
QuEChERS method of extraction was employed to determine the concentration of the respective pesticides. The adsorption capacities of glyphosate in agricultural soils of Cheha and Dinsho districts were measured using batch adsorption techniques.
Results:
Six pesticide residues were found in 12 soil samples at varied quantities. Glyphosate (24.00-219.31 µg kg−1), s-metolachlor (23.67-220.67 µg kg−1), chlorpyrifos (27.74 202.67 µg kg−1), pyroxulam (14.67-50.65 µg kg−1), florasulam (78.00-250.67 µg kg−1), malathion (15.00-49.67 µg kg−1). The experimental results showed that glyphosate was slightly sorbed at SD10 soil (18.91 μg−1−n mLn g−1) in comparison to SC1 soil (114.66 μg−1−n mLn g−1). Organic matter and clay content proving to be the principal factors influencing the process. According to adsorption experimental data, chemisorption is the major process in glyphosate adsorption, with the pseudo-second order kinetic model providing the best fit (R2 = .99). The soils in the study area exhibit notable variations in glyphosate rate of degradation (0.0076-0.0221 week−1). The findings show that the main soil variables affecting the half-life (glyphosate degradation) were clay concentrations (R2 = .48; P = .013), pH (R2 = .55; P = .0055), Organic matter (R2 = .74; P = .00027), Feox (R2 = .50; P = .0105), and Alox (R2 = .73; P = .00046).
Conclusion:
The weak glyphosate adsorption capabilities of soils can be a good indicator that the pesticide residues in the soil are poised to endanger soil organisms and contaminate nearby water bodies through runoff and leaching.
Introduction
Ethiopia has an estimated population of 115 million, making it the second most populous nation in Africa. The majority of the population still relies heavily on agriculture, which employs pesticides. 1 The effects of pesticides on the environment and public health have recently gained significant attention in Ethiopia due to the country’s continuous agricultural transformation. 2 Similar to other sub-Saharan African countries, Ethiopia has also been the subject of reports linking incorrect usage of pesticides to health and environmental issues. 3 Once in the soil, pesticide molecules transition between the aqueous and solid phases; this affects a number of other aspects of their behavior. Comprehending the trajectory of a pesticide in soil is essential for precisely evaluating its behavior in the environment and ensuring the safety of many items. On the other side, the use of agricultural pesticides to soils, contaminates surface and ground water, and has become a major global environmental concern. 4
Overuse and misuse of agrochemicals pollutes soil and water, posing an immediate risk to human health and the environment. 5 It can be challenging to evaluate the combined effects of many exposure routes and calculate their relative contributions to total exposure, which creates uncertainty about the whole impact. However, they have a wide range of effects on the environment and human health 6 ranging from minor ecosystem perturbations to the extinction of entire species. They can cause immediate death as well as chronic negative effects. 7 In 2015 for example, glyphosate was classified as a “probable human carcinogen” by the International Agency for Research on Cancer (IARC), a specialist agency of the World Health Organization (WHO).8,9
Strong evidence from the literatures10 -12 indicates that sorption is a crucial process influencing herbicide fate in soils. The most critical input parameter in pesticide fate models is the molecule’s affinity for soil. 13 As indicated in 14 and 15 this value is dependent on the type of pesticide molecule and a few specific soil characteristics like pH, organic carbon, clay, cation exchange capacity (CEC), and texture. A growing body of research indicates that the relationship between adsorption and degradation is far more complex, depending on a number of factors, such as the characteristics of the chemical itself, microorganisms, and soil properties. 16
For example most of the applied glyphosate ends up in the soil in its original form. After entering the soil, it could be taken up by clay minerals, 17 organic soil matter, 18 or iron oxides.19,20 Moreover, glyphosate may be broken down by soil microbes. 21 It interacts with peptides/proteins and organic compounds in the soil through the presence of carboxyl and phosphonate groups. 22 Moreover, glyphosate might interact with metals found in soil due to the formation of metal-glyphosate complexes (chelation). 23 On the other hand, glyphosate may be adsorbed, washed into rivers or groundwater, and ultimately wind up in the ocean.24,25 Depending on the soil’s iron oxide level, glyphosate may be extracted from it more easily.19,20 However, the interaction between glyphosate and iron oxides is very complex since it binds to each goethite surface plane with variable intensities. 18 Therefore it is necessary to test the impact of soil properties on the sorption and degradation of a particular pesticide’s active ingredients within the context of the study area’s current agroecology.
Glyphosate is thought to be a low mobility molecule and has a high capacity for adsorption in clay and organic matter found in soils, it is believed to pose little risk of contaminating water sources. 26 It sticks to soil quickly after application and can remain there for a few days to a year. The active functional site in the soil and the functional groups of the glyphosate molecule (−COOH, −NH2, and −PO(OH)2) interact physically and chemically to cause the glyphosate adsorption process. 27 Nonetheless, glyphosate can enter water bodies due to its high solubility and has a half-life of up to 3 months.28 -30
Given that the fate of pesticides in soils varies substantially depend on soil type, climate, and agricultural practices 31 it is crucial to know the concentration level of these pesticides in the soils under study in order to maintain environmental safety. Thus, in order to preserve ecological integrity and biodiversity, a potent technique for removing pesticide contamination may be required, such as microbe-based bioremediation employing organic matter, which speeds up the soils’ natural biodegradation processes. 32 Furthermore, according to 33 boosting soil’s adsorption capacity using an inexpensive adsorbent like biochar could aid in lowering the level of pesticide pollution in the study area.
The only focus of this investigation was to scrutinize the residue status of 7 pesticides and glyphosate’s adsorption capability and degradation. A 2018 study 34 discovered glyphosate residues in soil samples from multiple EU member states, with concentrations ranging from 0.5 mg/kg to over 1000 mg/kg. 35 indicates that glyphosate concentrations in groundwater samples range from 0.7 to 2.5 µg/L, and in surface water samples from different nations in Europe, North America, and South America, they range from 0.1 to 328 µg/L. Therefore, detecting any pesticide residue is equally important for targeted area to fully detoxify. 36 Furthermore; examining sorption properties of the other pesticides, the leaching of glyphosate from fields and the effects of soil additives on adsorption and degradation of these pesticides in the soil would have been helpful.
Although the degradation and sorption kinetics of herbicides in a variety of terrestrial soils is well known37 -39, information on this topic has not yet been published for Ethiopian soils. Since pesticide sorption behavior in soil greatly influences pesticide leaching, this investigation would provide baseline information for researchers investigating the pesticide status of the country’s water resources. Furthermore, it would alert pertinent parties to look into alternative farming practices, like adding low cost, easily accessible organic substrates to agricultural soils to support environmentally sustainable chemical management and lessen the harmful effects of pesticide residues on this ecosystem. 40 Thus, the study aimed to evaluate glyphosate’s adsorption capacity and rate of degradation, as well as to look into the relationship between these factors and other soil physicochemical parameters.
Materials and Methods
Study area description
The investigation was carried out in Dinsho district in Bale zone and Cheha district in Gurage zone of the southern Ethiopian highlands. The districts typically have an agricultural economy, which makes a significant contribution to the nation’s food supply. As per 41 , agriculture provides the majority (82%) of the region’s jobs. The production of cattle and the cultivation of cereal crops like wheat and barley are the main economic activity in the areas.
Dinsho district is located between 39° 44’ 0″ and 40° 26’ 40″ east and between 60 58’ 40″ and 70 20’ 0″ north. According to physiography, the majority of the district’s land area is located at over 2000 meters above sea level (masl). Three agro-climatic zones are used to categorize the district: highlands (2300-2600 masl), midlands (1500-2300 masl), and lowlands (1200-1500 masl). With a mean annual rainfall of roughly 1150 mm, the district has a bimodal rainfall distribution. The district’s typical annual temperatures range from 6°C to 17.5°C. The Pellic Vertisols, Eutric Cambisols, Nitisols, and Chromic Luvisols are the 4 main reference soil categories in the district. 42
At a height ranging from 900 to 2812 masl, the Cheha district is located between 8° 32’ 0″ and 8° 20’ 0″ N and 37° 41’ 20″ and 38° 2’ 40″ E. Based on the bimodal rainfall system, 43 divided the region into 3 agro-ecological zones: highlands (2300-3200 masl), midlands (1500-2300 masl), and lowlands (500-150 masl). The district’s average yearly rainfall over the past ten years has been 1268 mm. The average annual high and low temperatures are 24.97°C and 10.69°C, respectively. Nitisols, Leptisols, and Pellic Vertisols are the 3 main forms of soil. 42
Site selection, soil sampling
Topographic maps of the research region at a scale of 1:50,000 were used to conduct a preliminary soil survey and field observation. The selection of soil sampling sites was based on soil pH, altitude, and slope. To create a composite sample, 15 sub-samples were taken from each sampling location. In accordance with this, 12 composite soil samples (0-15 cm) were collected, 7 from the Cheha district; Goha 1(SC1), Goha 2(SC2), Goha 3(SC3), Aftir(SC4), Abret(SC5), Kechot(SC6), and Moche(SC7), and 5 from the Dinsho district; Doyomarufa 1(SD8), Doyomarufa 2(SD9), Tulu(SD10), Weni(SD11), and Ketasire(SD12).
Experimental soils
The Bouyoucus hydrometer method was used to analyze the distribution of soil particle sizes. 44 The pH of the soil was measured potentiometrically in H2O solution at a ratio of 1:2.5 for the soil: water solutions. 45 The 46 method was used to determine the soils’ Cation Exchange Capacity (CEC). The dichromate oxidation method 47 was used to estimate the amount of organic carbon. Mehlich III P, which involved shaking the soil samples for 5 minutes with an extracting solution of 0.2 M CH3COOH + 0.25 M NH4NO3 + 0.015 M NH4F + 0.013 M HNO3 + 0.001 M EDTA was, used. 48 Using 0.05 M ammonium oxalate ((NH4)2C2O4.2H2O, pH 3.3) in the dark, the oxalate extractable, Al and Fe (Alox and Feox) were ascertained. 49 The method 50 was used to determine the Fe and Al (Fed and Ald) that are extractable from citrate bicarbonate dithionite. Three undisturbed soil samples were taken with a core sampler in accordance with the method outlined by, 51 and the bulk density of the soil was then determined. The pressure plate apparatus method was used to assess the moisture retention at field capacity (FC) of −0.33 bar and permanent welting point (PWP) of −15 bar. 52 As per, 53 exchangeable acidity was determined by soaking the soil samples with a 1M KCl solution and titrating them with 0.02 M NaOH (Table 1).
Physicochemical properties of soil samples.

Abbreviations: Alox, oxalate extractable aluminum; AWHC, available water holding capacity; CEC, cation exchange capacity; exAc, exchangeable acidity; Fc, field capacity; Feox, oxalate extractable iron; OM, organic matter.
Determination of pesticide residues in soils samples
Chemicals and reagents used
Herbicides (glyphosate, s-metolachlor, pyroxulam, florasulam), insecticides (chlorpyrifos, malathion) and fungicide (propiconazole), were the pesticides that were investigated in soil samples. The pesticides reference standards were obtained from Dr. Ehrenstorfer GmbH (Augsburg, Germany). Dichloromethane and pesticide-grade acetonitrile were bought from BDH (England). Silica gel adsorbents were brought from Phenomenex in the USA. All other chemicals, including analytical-grade acetone, ethyl acetate, saturated sodium chloride, anhydrous magnesium sulfate, and anhydrous sodium sulphate, were also used. The derivatization reagent FMOC-Cl, also known as 9-fluorenyl-methyl-chloroformate was used. Acetonitrile of HPLC grade, sodium hydroxide (NaOH), potassium hydroxide (KOH), sodium phosphate (Na3PO4), sodium bicarbonate (NaHCO3), sodium tetraborate (Na2B4O7), and phosphoric acid (85%), were supplied by Nanjing Chemical Reagent Co., Ltd (Nanjing, China). Distilled water was provided by Madda Walabu University and used in entire research undertakings.
Standard solutions
The 6 pesticide standards’ stock solutions (100 mg mL−1) were prepared by pipetting the appropriate aliquot of the chemicals into 50 mL volumetric flasks, and then dissolved and diluted to the marks with ethyl acetate with the aid of a vortex mixer. These were kept in a refrigerator at −20°C. After aspirating various quantities of each stock solution, the combined working standard solution in acetonitrile was diluted down to 10 mg/L. Working solutions of standards were freshly prepared through dilution of an appropriate aliquot of the stock solutions with ethyl acetate. Double distilled water was used to prepare all aqueous solutions.
Extraction of soil samples
As mentioned in, 54 the QuEChERS method was used to extract the soil samples. Each soil sample was weighed and then quantitatively placed into 250 mL separating flasks at a rate of 10 g. A vial containing the sample received 2 mL of deionized water first, then 10 mL of ACN, and was vortexed for 1 minute. A sample containing 4 g of anhydrous MgSO4 and 1 g of NaCl was vortexed for 30 inches per minute, placed in an ultrasonic bath for 2 inches per minute, and the contents were centrifuged for about 5 inches per minutes at 3800 rpm. A 1.5 mL micro-centrifuge vial containing 50 mg of primary secondary amine (PSA) and 150 mg of MgSO4 was then filled with a 1 mL aliquot of the upper acetonitrile layer during the extract’s clean-up stage, and it was immediately vortexed for 1’. 0.5 mL of the extract was then put into an auto-sampler vial for high performance liquid chromatography (HPLC) analysis after being centrifuged for 5’ at 6000 rpm to remove the solids from the solution. The analytical standard for s-metolachlor with a purity of 99.5% was acquired from Dr. Ehrenstorfer GmbH located in Augsburg, Germany. In the herbicide extraction process, sodium chloride (Sigma-Aldrich, Netherlands) was utilized in the herbicide extraction process. Methanol, n-hexane, and ethyl acetate HPLC-grade purity were provided by Riedel de Haen, Germany. C18cartridges (1000 mg, 6 mL) used for solid-phase extraction (SPE) were obtained from Thermo Scientific, Finland.
HPLC analysis
In order to precisely measure the pesticides that are currently in soils with different properties, a multi-residue trace analytical approach is given. An optimized approach known as Quick, Easy, Cheap, Effective, Rugged, and Safe (QuEChERS) was used to extract pesticides, and liquid chromatography coupled with mass spectrometry was used for chemical analysis. Matrix-matched internal standards calibration served as the basis for quantification. A 10 mg of the chemical was weighed into a glass beaker (100 mL), and 10 mL of methanol was used to dissolve it (50/50 v/v). A concentrated stock solution (100 ppm) of the glyphosate, chlorpyrifos and malathion standard were prepared and consequently standard solutions with concentrations ranging from 0.005 to 0.5 mg/L were arranged by diluting the stock standard solution with an appropriate amount of ethyl acetate. 55 An Agilent fluorescence detector (FLD: Agilent 1046A) with an Agilent 1260 Infinity HPLC set to Excitation of 242 nm and Emission of 388 nm. The QuEChERS procedure coupled with high-performance liquid chromatography-mass spectrometry 56 was also used to determine Florasulam and pyroxulam pesticide residues. Similarly for s-metolachlor the soil samples were extracted using the QuEChERS technique. 54 The HPLC measurement for s-metolachlor concentration was carried out using a Hewlett-Packard 1100 HPLC system (Agilent Technologies, Santa Clara; USA) equipped with a UV variable wavelength detector set at 210 nm. Acetonitrile plus 0.1% phosphoric acid (pH 2.30) (70 + 30 by volume) was the mobile phase, and it was injected at a volume of 70 μL at a flow rate of 1.0 mL min−1. Wakosil reversed-phase column (C18, 4.6 mm ID × 250 mm; Wako Pure Chemical Industries, Ltd., Osaka, Japan) with a diameter of 5 μm was used.
Quality assurance and quality control
The reliability of the results was determined to be warranted by applicable quality assurance methods. Through the examination of solvent blanks, procedural matrix blanks, and duplicate samples, the purity of pesticides was ensured. The same extraction processes were applied to the reagents used in the analysis, and afterward, tests were conducted to check for potential interference-causing compounds. Throughout the extraction process, no blanks contained any pesticide residue. Each series’ sample was examined in 3 separate analyses. Until quantification was finished, the entire batch of extracts was stored at 4°C. With each batch of samples, calibration curves were run to ensure that the correlation coefficient was maintained at or near R2 = .99. Recovery rates of an internal standard were used to determine the effectiveness of the extraction and cleanup techniques. For every pesticide analyzed, the internal standards were recovered between 88% and 97% of the time. The concentration was estimated from the peak regions whose retention durations matched the standards on the relevant calibration curves.
Kinetic experiments
The most commonly found pesticide in the examined soils, glyphosate, was the subject of an adsorption kinetics research conducted on 2 soils with different properties. The adsorption kinetics were analyzed using the parabolic diffusion model, the pseudo-first order kinetic model, the pseudo-second order model, and the Elovich equation. 57 Kinetic tests were conducted at room temperature (25°C) and standard atmospheric pressure. Using a constant temperature shaker, a 2.0-g soil sample was mixed with 10 mL of glyphosate solution at a concentration of 30 mg L−1 in a 50 mL bottle. Samples were collected at predetermined intervals, and each treatment was run through 3 times. After 5 minutes of centrifuging at 8000 rpm, the supernatant was filtered through a 0.45-µm micron filter in preparation for further use.
The pseudo first order model
The rate equation given by 58 , in 59 can be broadly characterized by the following equation:

Equation (2) becomes: after integration by applying the criteria, qt = 0 at t = 0 and at t = t, qt = q.

Where qe is the quantity of pesticide adsorbed at equilibrium in mg g−1, and K1 is a constant (hr−1). By utilizing the slope and intercept from the plot of log (qe − qt) versus time (t), 1 may compute the constants K1 and qe.
The pseudo second order model
The pseudo second-order kinetic model is expressed as follows:
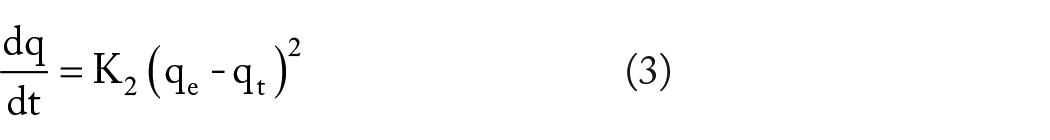
Integrating equation (3) for the boundary conditions t = 0 to t = t and qt = 0 to q = qe gives


Where K2 is the second order rate constant (mg mg−1 hr−1); by plotting t/qt versus t in a linear relationship, values of K2 (mg mg−1 hr−1) and qe (mg g−1) were calculated from the intercept and slope of the plots.
The Elovich model
The Elovich or Roginsky-Zeldovich equation is generally expressed as follows 60 :

Where qt is the amount of pesticide adsorbed by soil at a time t, α is the initial pesticide adsorption rate (mmol g g−1 hr−1) and β is desorption constant (g mmol−1) during any 1 experiment. It has been assumed that αβt >> 1, and on applying the boundary conditions qt = 0 at t = 0 and qt = qt at t = t, equation (7) then becomes 61 :

The parabolic diffusion model
The parabolic diffusion model can be described as follows:

Where Kp is diffusion rate constant [(mg P kg−1) × hr−1/2], q0 and qt are the amount of P adsorbed (mg kg−1) at time zero and t (hr), respectively.
Batch adsorption experiment
Glyphosate was the most prevalent pesticide in the soils under investigation, out of the 7 pesticides that were examined in this study. The sorption characteristics of glyphosate was studied in 12 soil samples that were classified as Eutric Cambisols, Nitisols, Leptisols, or Pellic Vertisols, and had varying pH, OM, and oxyhydroxide of Fe and Al contents.
As stated in, 62 batch sorption tests were carried out to determine the glyphosate kinetics and isotherms in 12 agricultural soils. In 50 mL polypropylene centrifuge tubes, 2.0 g of air-dried soil samples were obtained in triplicate to estimate sorption kinetics. 10 mL of aqueous 0.01 M CaCl2 containing 4.0 mg L−1 of glyphosate was then added. The control tubes were those holding soil samples free of glyphosate. After being physically shaken (end-over-end) for 5, 15, 30, 60, 180, 360, 720, 1440, and 2880 minutes at 21 ± 1°C, all of the capped tubes were removed. After that, the soil suspensions were centrifuged for 15 minutes at 5000 rpm. After being run through a 0.45-um micron filter, a 2.0 mL supernatant was utilized for HPLC residue analysis. For each 2.0-g sample, in triplicate, contained in 50 mL centrifuge tubes, 10 mL of an aqueous 0.01 M CaCl2 background solution of glyphosate with different doses (0.5, 1.0, 2.0, 4.0, 8.0, 16, and 32 mg L−1) was added in order to calculate the sorption isotherms for the 12 soils that were chosen. The soil samples were centrifuged at 5000 rpm, filtered for 15 minutes, and an aliquot of 2.0 mL supernatant was used to analyze glyphosate using HPLC after they had been shaken for 24 hours at 21 ± 1°C. After collecting the supernatant and filtering it through a 0.45-um micron filter, the amount of glyphosate was determined using HPLC. Equation (9) was utilized to compute the equilibrium adsorption capacity, or qe (mg kg−1).

Where V represents the volume of solutions (L); C0 is the initial concentration of pesticide; Ce (μg mL−1) is the equilibrium concentration of the adsorbate at time t (min); m is the mass of adsorbent (g); qe (μg g−1) is the amount of glyphosate adsorbed on soil.
The Freundlich equation, which is associated with non-ideal, reversible, multilayer adsorption with non-uniform distribution of adsorption heat and affinities over the heterogeneous surface, was then used to test the experimental results. 63 Equation (10) was applied in its log-transformed form.

Where Kf (μg−1-n mLng−1) is the adsorption coefficient characterizing the adsorption capacity and Nf is the slope of an isotherm related to the adsorption intensity, which is employed as an indicator of the adsorption isotherm nonlinearity.
The Langmuir model has also been tested against the experimental results. According to, 64 the model holds true when adsorption entails the attachment of a single layer of molecules to the surface and the surface has a certain number of places where the solute molecules can be attached. Equation (11) (the Langmuir model) is as follows:

Where Ce is the equilibrium pesticide concentration (µg pesticide L−1), Q = amount of pesticide adsorbed (µg pesticide kg−1), Qmax = maximum amount of pesticides adsorbed (µg pesticide kg−1 soil), and KL is the affinity coefficient between the surface of soil particles and the pesticide residue, which is correlated with the bonding energy (L mg−1).
The standard error of estimate (SEE) and the coefficient of determination (R2) were used to assess how well the isotherm models fit. The SEE value was determined using:

Where n is the number of measurements and qm and qe are the measured and calculated amounts of pesticide adsorbed in soil, respectively.
Degradation experiment
Using laboratory incubation procedures as reported in, 65 the degradation process of glyphosate in the studied soil was investigated. The residual amounts of the spiking herbicide following incubation were used to calculate the rate of glyphosate breakdown in soils. A 50 ml flask containing 10 g of soil sample was spiked with 1 mL of the 6 mg kg−1 glyphosate stock standard solution. To get the water holding capacity (WHC) down to 60%, sterile distilled water was supplied. The soils containing glyphosate were mixed thoroughly and acetone was evaporated using a reciprocating shaker. The soils were then incubated at 25°C. On days 0, 7, 14, 30, and 60, sample solutions were taken out and the amounts of glyphosate in the soil were measured. The soil samples were mixed for 2 hours with 30 mL of acetone-water (25:5, v/v), and then they were extracted for 20 minutes at 20°C. Two milliliters of the solution were then removed for further analysis.
The degradation rates of the glyphosate under different compositions were analyzed according to the pseudo-first order kinetics as mentioned in. 66

Where Ct represents the amount of glyphosate at time t (mg kg−1), Co denotes the amount in mg of soil at time 0 (mg kg−1) and k is the rate constant (week−1).
The glyphosate’s half-life for dissipation (DT50) in each surface soil was determined using the following formula:

Single and multiple linear regression analysis
A relationship between the sorption parameters and the soil’s characteristics (Kf, CEC, sand, silt, clay, OC, pH, Feox, Mehlich III P, and exAl) was determined using single and stepwise multiple linear regression analyses. We used the most basic assumption possible for this purpose: that Kf depends linearly on the combinations of the measured attributes. Stepwise multiple regression analysis was carried out with the R software’s default “step” function. Using the following equation, predictive Kf values were obtained:
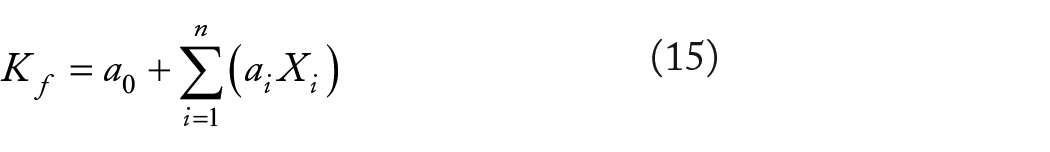
where ai is the regression coefficient associated with the Xi soil physicochemical property (i = 1 − n number of considered soil properties).
Data processing and analysis
To statistically evaluate the experimental data, a number of procedures involving data entry, cleaning, editing, and analysis were carried out using SAS. 67 The fit of each adsorption model was evaluated using the standard error of estimate (SEE) and determination coefficient (R2) at a 95% confidence level (P < .05). Simple correlation, single linear regression, and multiple linear regressions were executed to establish a relationship between the Kf coefficients and other soil properties using R software’s default “step” function.
Results and discussion
Pesticide residues in soil samples
Pesticide residues were found and their concentration distributions throughout the research region were revealed in Table 2. The pesticides that were most frequently detected were in the following order in relation to their concentration levels in the studied soils: glyphosate > s-metolachlor > florasulam > chlorpyrifos > pyroxulam > malathion. Specifically, the pesticides found in the soil samples indicate that farms in the research region have been applying pesticides containing considerable amounts of glyphosate, s-metolachlor, chlorpyrifos, malathion, pyrosxulam, and florasulam. These pesticides most likely entered the soils by spray drift and wash-off from treated grains when cereal was sprayed. In the soil samples, the concentration of 1 of the 7 pesticides that were targeted (propiconazole) was found to be below the detection limit of the instrument. The present study’s recovery test yielded a recovery range of 89% to 97% for all pesticides detected, indicating the effectiveness and reproducibility of the analytical technique employed. The limit of quantitation (LOQ) was determined to be between 8.16 and 24.22 µg kg−1, while the limit of detection (LOD) was 2.68 to 7.27 µg kg−1 (Table 2).
Pesticides concentration in selected soils.
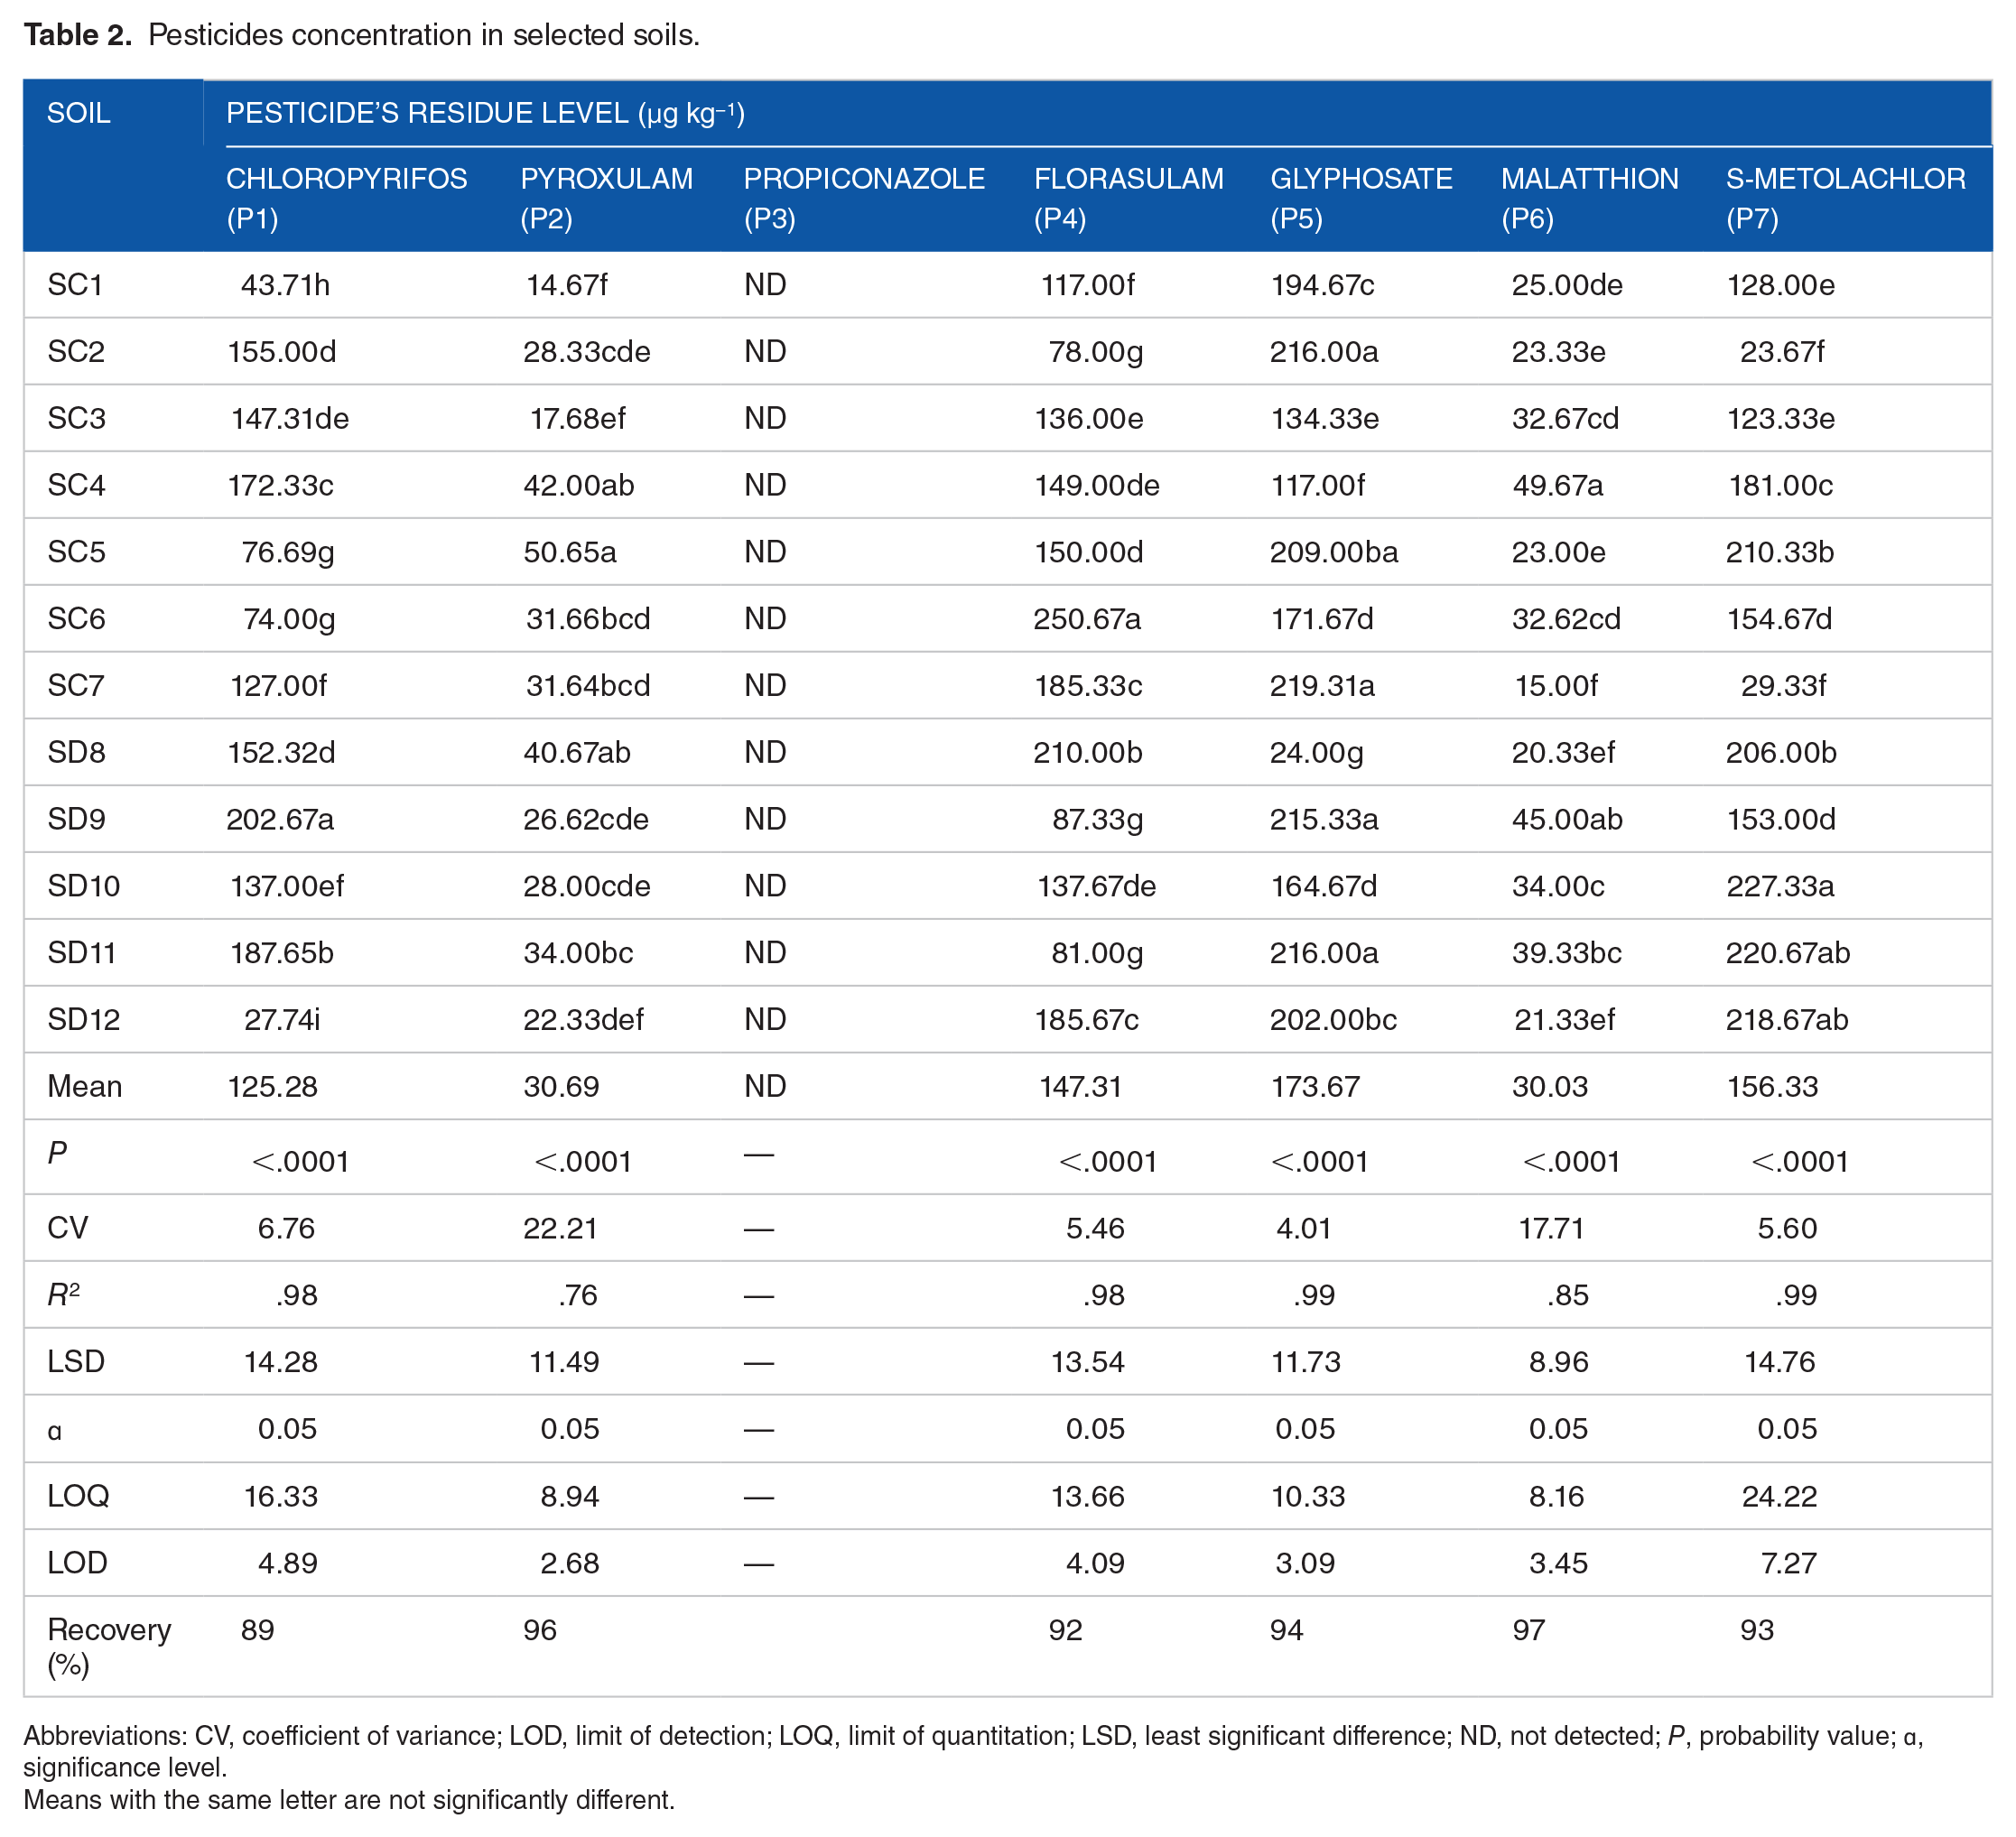
Abbreviations: CV, coefficient of variance; LOD, limit of detection; LOQ, limit of quantitation; LSD, least significant difference; ND, not detected; P, probability value; ꭤ, significance level.
Means with the same letter are not significantly different.
Higher concentrations of glyphosate, s-metolachlor and chlorpyrifos were found in soil samples taken from wheat farms. The samples taken from the wheat farm field at SD10, SC7, and SD11 sampling sites had the greatest concentrations of glyphosate, s-metolachlor, and chlorpyrifos, 227.33, 219.31, and 187.65 µg kg−1, respectively. In contrast, the highest concentrations of pyroxulam (50.65 µg kg−1) and florasulam (250.67 µg kg−1) were found in farm fields SC5 and SC6.
Based on statistical analysis, the concentrations of s-metolachlor, glyphosate, chlorpyrifos pyroxulam, and florasulam recorded in the soil samples were significantly different (P > .05) among the sampling sites. For example, the measured mean concentrations of glyphosate ranged from 24.00 µg kg−1 at SD8 to 219.31 µg kg−1 at SC7 with a total sites mean value of 173.67 µg kg−1, and that of s-metolachlor extended from 23.67 µg kg−1 at SC2 to 227.33 µg kg−1at SD10 sampling sites, with average value of 156.33 µg kg−1. The observed variations in pesticide concentrations of the study areas may be linked to changes in the extent of pesticide degradation, which is attributed to the physicochemical characteristics of the soil and the frequency of pesticide application on agricultural fields.
It was discovered that the mean concentrations of glyphosate, pesticide present in the examined soils, were above the maximum residue limits of 30 µg kg−1 that are established for agricultural soils in the US. However, the mean results at SD2 (24.00 µg kg−1) were either comparable or fell within the 30 µg kg−1 US Maximum Residue Limit. In addition to the potential harm that these pesticide residues may pose to soil organisms, there is also a chance that these residues may translocate from the soil into the wheat and other crops through the root system, posing health risks to consumers of these products. This shows how much these particular pesticides have contaminated the agricultural soils in the research area, and it may serve as a warning to individuals involved in environmental pollution to discover preventative measures. It is recommended that various agricultural management practices should be implemented in light of the greater concentration of these chemical residues in the soil under study. The addition of inexpensive, readily available organic substrates to the agricultural soil may lessen the harmful effects of pesticide residues by enhancing pesticide breakdown and help to manage active ingredient in the environment in a sustainable way. 40
Every one of the collected samples contained chlorpyrifos, with the maximum value exceeding 202.67µg kg−1, which is below the reported threshold. 68 Likewise, compared to the values reported by 69 in soil samples from Alau dam and Gongulong agricultural area, Borno State, Nigeria, the mean values of chlorpyrifos obtained in this work were lower. Furthermore, the range of 520 to 970 µg kg−1 described by 70 , in soil samples from Gashua, Bade Local Government Area, Yobe State, Nigeria, was significantly higher than the mean chlorpyrifos residual levels (27.74-202.67 µg kg−1) obtained in this investigation. Pesticides such as chlorpyrifos, malathion, s-metolachlor, glyphosate, pyrosolam, and florasulam were found in the soil samples, indicating a considerable usage of these chemicals by farmers in the research area. Glyphosate was shown to have a high average concentration in the soils under study followed by s-metolachlor. On the contrary, malathion compared to other target pesticides, was discovered at low concentrations.
This study’s concentration of glyphosate (24.00-219.31 µg kg−1) was found to be lower than that of a study conducted by 55 at Akufo farm settlement in Oyo state, Nigeria, where the concentration was reported to be 1290 to 22 340 µg kg−1. Even though there was less malathion (15.00-49.67 µg kg−1) in the soil under study, it was still present in higher concentration than what was observed in the soils of Senegal’s Niayes agricultural area (4.86 µg kg−1). Similarly, it was discovered that the content of chlorpirifos (27.74-202.67 µg kg−1) in the soils under investigation in the current study exceeded that which had been recorded in the soils of the Naga and Niayes regions (5.33 µg kg−1) of Senegal. 71
These compounds’ existence in the soil suggests that there may still be fresh inputs of these compounds into the fields; this has to be confirmed further, maybe by contrasting the concentrations of the compounds and those of their breakdown products. The content of malathion in the soil under investigation ranged from 20.33 to 49.67 µg kg−1, with a mean value of 30.03 µg kg−1. This is less than the concentration (3850 µg kg−1) found by at Araromi Farm Settlement in Osun state, Nigeria, and greater than the maximum residue level (MRL) suggested by the EU (20 µg kg−1). 72
Adsorption experiments
Adsorption kinetics
The adsorption kinetics of 2 soils, SC1 and SD10, whose adsorption capacities are radically different, were examined in this work. The parabolic diffusion, pseudo second order, pseudo first order and Elovich adsorption kinetics kinetic model of glyphosate adsorption to soil and the assessed parameters are presented in Figures 1, 2 and Table 3. The pseudo-first order kinetic equation’s correlation coefficient value was marginally lower than the pseudo-second order kinetic equation’s, suggesting that surface control-rather than adsorbate diffusion-is primarily responsible for controlling this adsorption. Glyphosate kinetics data showed a strong correlation with the pseudo-second-order model, which was explained by the herbicide molecules’ surface sorption onto soil oxyhydroxides of iron and aluminum, and clay minerals, which was followed by a slow diffusion of the molecules into soil micropores or heavily cross-linked OM sites. Pseudo-second-order model’s coefficient of determination (R2 > .99, Table 3) indicates that the sorption process was dominated by multiple mechanisms engaged in herbicide removal 73 and the model adequately explained the sorption data for the 2 agricultural soils. The rate at which glyphosate was released was thus determined by chemisorption activities, which included a chemical connection through the sharing or exchange of electrons. Similar findings have been reported in a study on the distribution and fate of glyphosate in soils. 74

Parabolic diffusion (A) and pseudo second order adsorption (B) kinetic graph.

Pseudo first order (C) and Elovich adsorption (D) kinetics graph.
Adsorption kinetics models’ parameters.
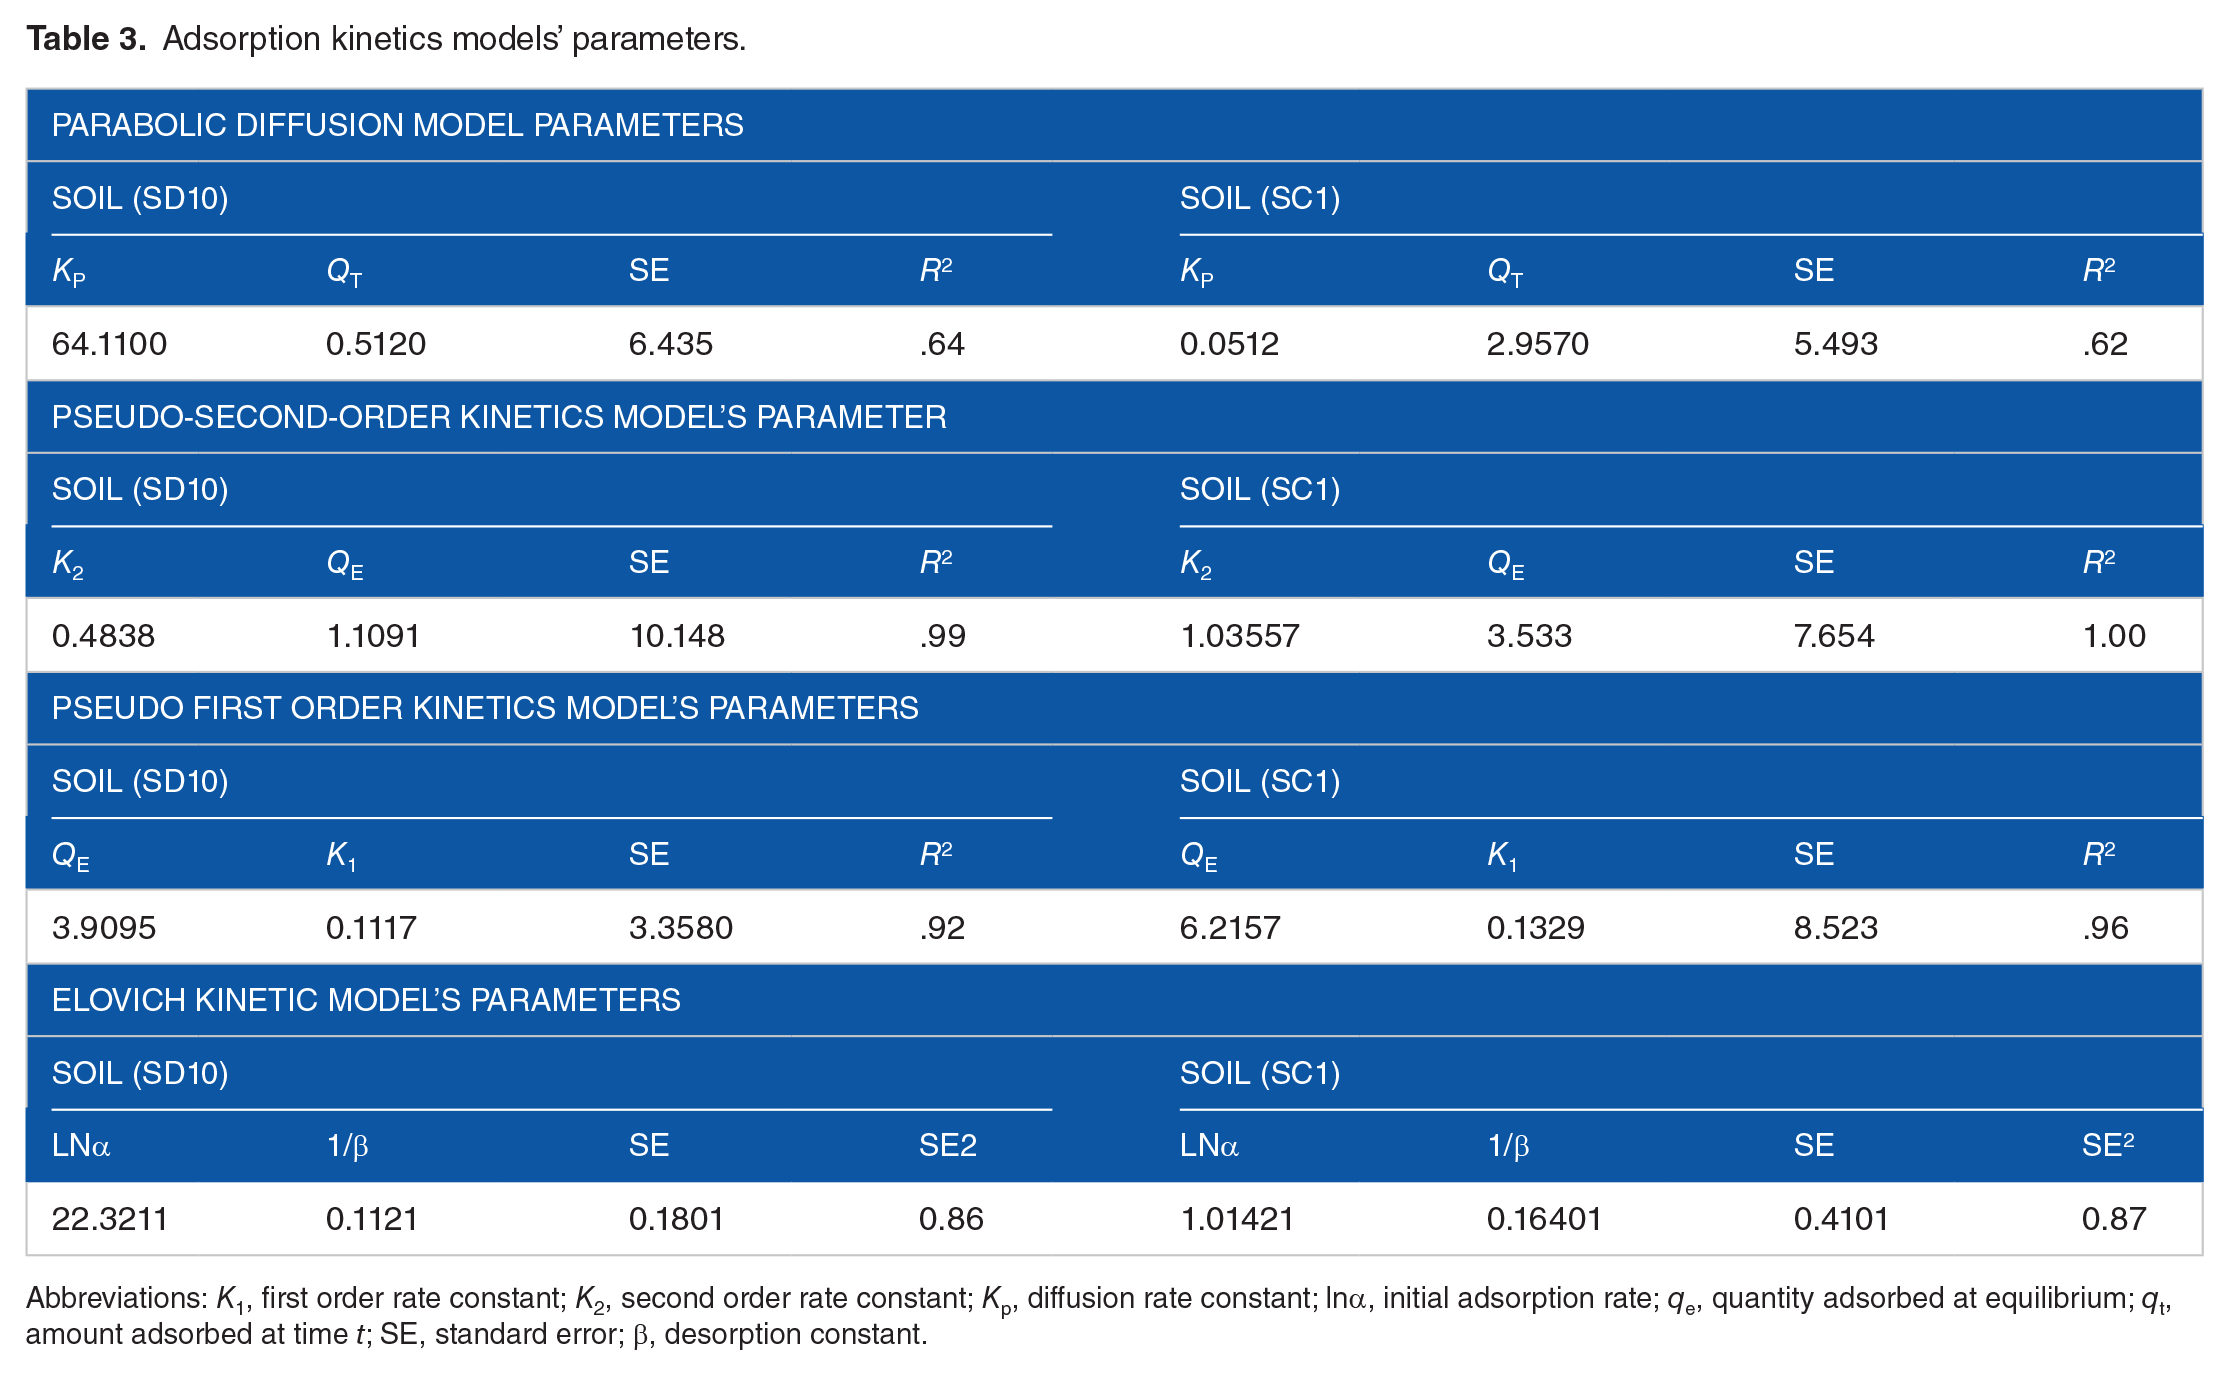
Abbreviations: K1, first order rate constant; K2, second order rate constant; Kp, diffusion rate constant; lnα, initial adsorption rate; qe, quantity adsorbed at equilibrium; qt, amount adsorbed at time t; SE, standard error; β, desorption constant.
The result of this study implies that chemisorption mechanisms-which entail chemical interactions involving the exchange or sharing of electrons-determine the rate of glyphosate sorption in the soils of the studied area. A steeper exponential phase in glyphosate sorption is caused by soil metal oxides and clay mineral dispersion of glyphosate molecules over the surface boundary layer. The glyphosate adsorption rate constants in the SD10 soil (K2 = 0.4838) and SC1 soil (K2 = 1.03557) showed a significant difference, indicating that the sorption site availability varies substantially between the 2 soil types (Table 3). These variations could be caused by the abundance of different physicochemical characteristics in the soil, which are directly linked to adsorption capacities.
Pesticide adsorption isotherms
An intuitive understanding of the sorption mechanism of pesticides in agricultural soils can frequently be gained from the equation parameters derived from adsorption isotherm model equations. Additionally, as more applications are created, more precise and comprehensive isotherm descriptions are needed for the adsorption system designs, which highlight the need of identifying the best-fit sorption isotherm models. 75 Because of this reason, a sorption experiment was carried out for the current investigation, and the glyphosate adsorption isotherms are shown in Figure 3. The extent of glyphosate sorption in the chosen soils increased with an increase in starting concentration, according to the findings shown in Table 4. In order to fit the experimental equilibrium data of glyphosate sorption in 12 distinct agricultural soils, both the Freundlich and Langmuir isotherm models were used.

Adsorption isotherms of glyphosate in soils.
Freundlich and Langmuir constants for the sorption of glyphosate in soils.
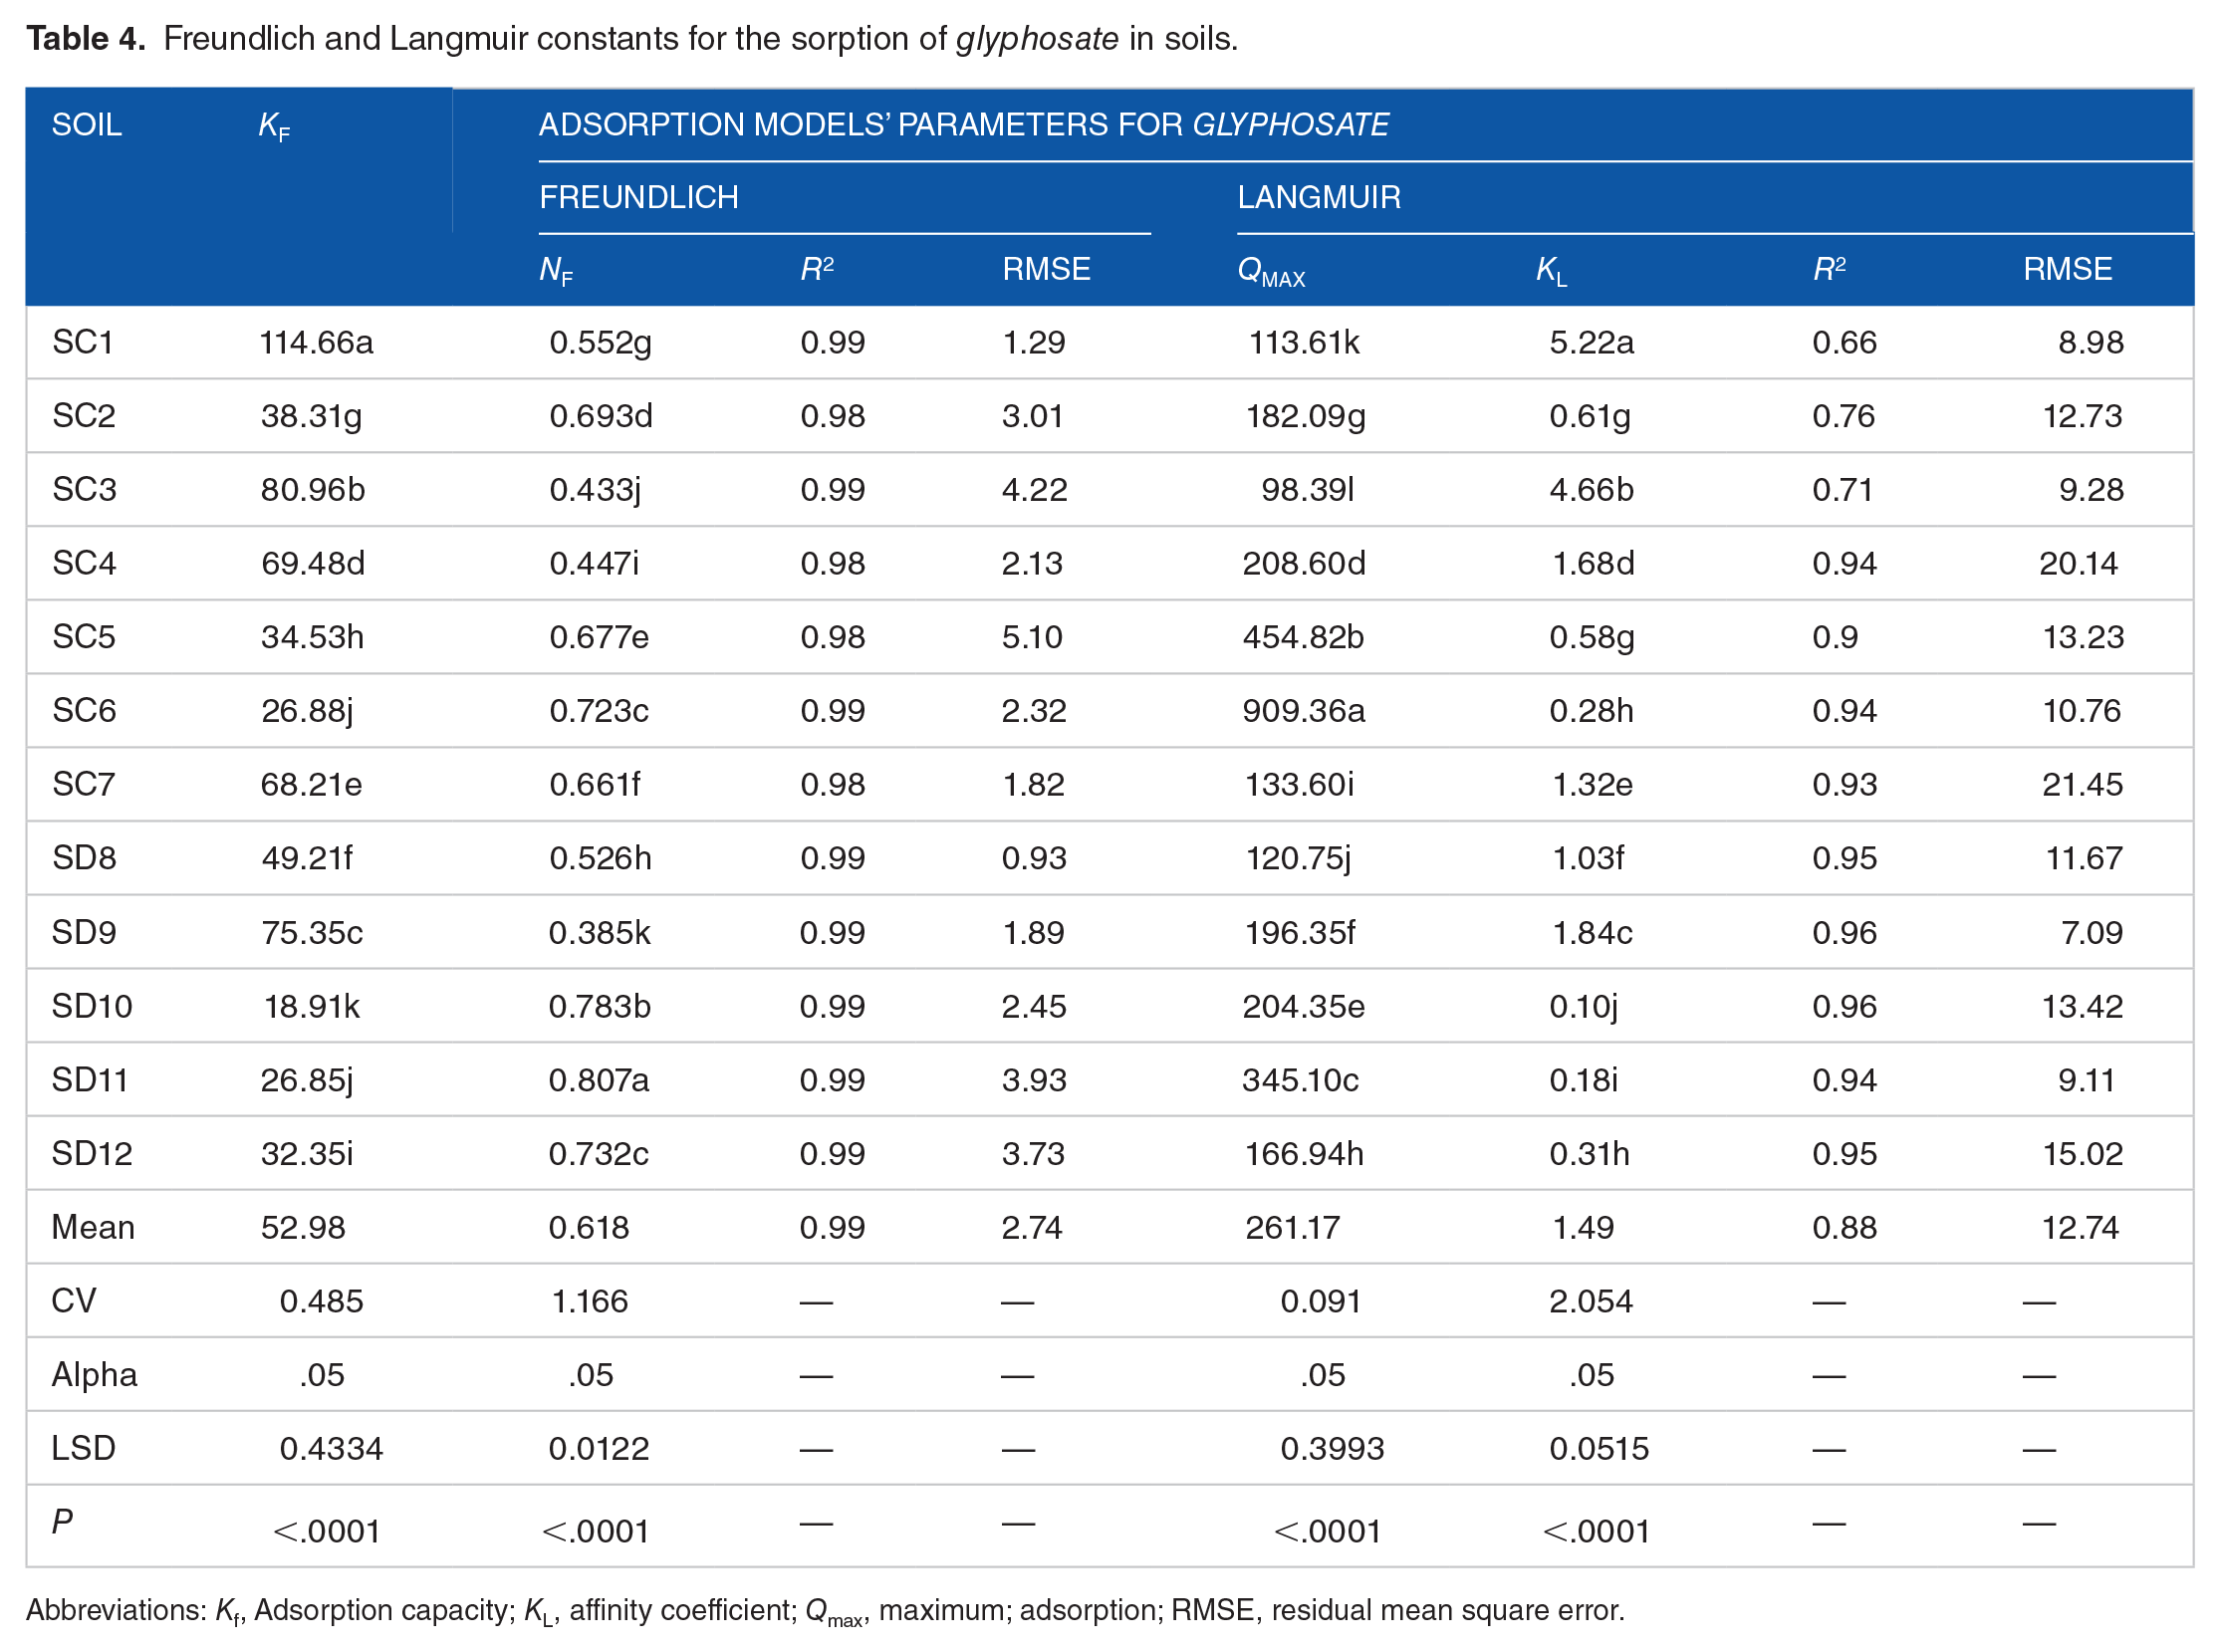
Abbreviations: Kf, Adsorption capacity; KL, affinity coefficient; Qmax, maximum; adsorption; RMSE, residual mean square error.
The isotherms of all the soils were of the “L” type, which does not have a hard plateau and indicates that the ratio of glyphosate adsorbed on the soil to that which is still in solution decreases as the analyte concentration increases. Moreover, this type of isomer suggests that a slight struggle between solvent and solute molecules for the surface’s adsorbing sites, with absorption rising quickly at first, which is consistent with findings attested by65,76. A Freundlich mathematical model was used to mimic glyphosate adsorption isotherms on the soils and estimate the sorption parameters (Table 4). The Freundlich coefficient (Kf ) is a metric used to quantify sorption strength. The results showed that the Freundlich equation, which defines the multilayer adsorption, processes that take place on heterogeneous surfaces and assumes an exponential change in the distribution of energy among adsorption sites 77 , adequately describes the data for all soils and depth (R2 ⩾ .99). The Kf values obtained for the various soils used in this study varied from 18.91 to 114.66 μg−1-n mLng−1 (Table 4). The soil in SC1 site had the highest glyphosate absorption (114.66 μg−1-n mLng−1), which thereafter declined in the following order: SC1 > SC3 > SD9 > SC4 > SC7 > SD8 > SC2 > SC5 > SD12 > SC6 > SD11 > SD10. The higher affinity of soils for glyphosate has also been associated with low pH and phosphorus, along with elevated levels of clay, CEC, Al3+, and Fe3+, as reported in36,78. The results of this investigation also demonstrate that, SD10 had the lowest glyphosate sorption capacity (18.91 μg−1−n mLn g−1), indicating that glyphosate is difficult for soils to sorb and has the potential to contaminate surface and groundwater. The lowest glyphosate sorption capacity might be attributed to the smallest concentration of metal oxides (Feox and Alox) and the largest OM content in the soil.
Similar to the previous report 79 for different pesticides, the lower value of the Freundlich coefficient indicates that glyphosate is most likely mobile in agricultural soils. The values of Nf, which ranged from 0.385 to 0.807 (Table 4), are suggestive of sorption intensity or the heterogeneity of the sorbent surface, which may suggest divergence from linearity. A value >1 indicates a cooperative sorption, while a value < 1 indicates a chemisorption mechanism that is favorable to the heterogeneous surface. 80 Given that, 81 the higher values (Nf > 1) suggest that sorbent surfaces are less heterogeneous, which supports the idea that partly or un-decomposed organic matter may be present in urban soils.
It’s possible that phosphate, which is mostly absorbed by ligand exchange when given as fertilizer to agricultural soils, reduced the ability of glyphosate to bind to the soils under study. Several recent studies predict that when phosphate treatment rises, several ionizable herbicides’ adsorption will decrease. 82 This impact depends on the adsorbent and is more likely on mineral surface sites such as Fe and Al (hydr)oxides.83,84
Since soil mineralogy and surface chemistry are known to control contaminant sorption of ionizable chemicals, the clay mineralogy of Cheha, which was 1:1 kaolinite 85 in the surface horizons containing significant clay content, oxyhydroxides of Fe and Al, and lower pH, may have contributed to a significant sorption of glyphosate. Regarding herbicide sorption in soil, 1 potential sorption mechanism has been suggested: glyphosate phosphonate group and singly coordinated Al-OH and Fe-OH groups on the surfaces of variably charged soil minerals form strong adsorbent-cation-P (glyphosate) bonds through ligand exchange.24, 86
Based on statistical analysis, there were significant differences (P < .05) in glyphosate sorption between the soils in the study area. This could be directly linked to larger amounts of iron and aluminum oxides and lower soil solution pH values, as well as variations in the geochemistry and geographic origin of the investigated soils. Certain characteristics of the soil, such as the amount of humification, pH, vacant phosphate adsorption site, composition of cations in the exchangeable site of clay and organic matter, and clay minerals, have been reported to have a significant impact on the adsorption of glyphosate. 87
At equilibration period, the soils’ Langmuir adsorption maxima (Qmax) varied from 909.36 to 98.39 µg kg−1 (Table 3) and was found in the following order: SC6 > SC5 > SD11 > SC4 > SD10 > SD9 > SC2 > SD12 > SC7 > SD8 > SC1 > SC3, respectively. This range represents the concentration of the strong sorption sites, Fox and Alox, as well as the OM content in the soil, which may have affected the soil’s ability to adsorb glyphosate.
The adsorption energy coefficient (KL) at the standard instance is 0 < KL < 1. 88 However the KL value of glyphosate on the adsorption sites, values ranged from 0.1 to 5.22 L mg−1 at the equilibration period, according to the regression analysis of the data from the Langmuir model, indicating that the studied soils had variable KL. The adsorption energy coefficient also corresponded to the sorption’s binding energy, which demonstrated the attraction between the glyphosate molecules and the soil surface. The data clearly show that soils with higher sorption capacity, lower available P, and larger levels of Fe and Al oxyhydroxides had higher energy of adsorption (KL) values (Table 4). According to several publications, there is probably less ionizable pesticide adsorption when phosphate administration is increased. 82 On the other hand, the reduced energy of adsorption for some of the soils could be due to cation bridging, which is the formation of an inner-sphere complex between an anionic or polar functional group on a glyphosate and an exchangeable cation at a clay or OM surface. Despite the Langmuir adsorption model’s capacity (RMSE = 12.74, R2 = .88) to accurately represent the adsorption characteristics of the soils under investigation for glyphosate, regression analysis showed that the Freundlich model (RMSE = 2.74, R2 = .99) was superior (Table 4).
Degradation of glyphosate
The development in adsorption kinetics of glyphosate in the studied soils is presented in Figure 4. The current study’s findings demonstrated that, following application, glyphosate residue in the soil rapidly declined in the early days before continuing to decline until achieving its maximum degradation. There has been variation in the glyphosate degradation trend in soils, and this variation appears to be related to the physicochemical features of the soils. As stated by, 89 the amount of glyphosate in soils reduced as the period of time following glyphosate application increased, which is similar with the current investigation. Glyphosate’s lifetime is also increased by its complexation behavior on soil under different situations, which is very harmful to the environmental system. 90 Glyphosate is mostly broken down by biodegradation, with cometabolism being the predominant mechanism. Adsorption affects its availability for microbial breakdown, as seen by the rapid early degradation followed by a slower rate of degradation in the subsequent stage. 87 The degradation of glyphosate may be related to how soil’s sorption characteristic affects the compound’s availability for microbial cometabolism. Differences in adsorption strength that prevent glyphosate from decomposing could account for a significant variation in the rate of glyphosate decomposition between soils described in. 91

Degradation kinetics of glyphosate in soils.
Pesticide degradation involves intricate interactions with various systems, including as soil-pesticide merging, physical and biological variables, and pesticide kinds. Depending on the unique characteristics of the pesticide, the degree of interlinking and sorption rate between the soil particle and the pesticide determines how persistent the soil particle is. 92 Based on studies of93,94 glyphosate has a DT50 value (time for dissipation of 50% of the original concentration) that ranging from 1 to 197 days, indicating that it is fairly persistent in soil. Less than 30 days of half-life can be classified as non-persistent, while more than 100 days can be classified as extremely persistent. 95 The half-lives of the investigated soils ranged from 31.4 to 91.2 days, suggesting a moderate level of persistence. Regarding the persistence of pesticides, the half-lives of the soils under study were consistent with the findings provided by. 94 While SD9 soil showed a shorter half-life time, SC1 soil showed a longer one. The differences in the sorption capacity of the soils, which is frequently associated with soil parameters like pH, the oxyhydroxides of iron and aluminum level, and the soils’ organic matter content, may be the cause of the disparities in their rate of degradation. Although there has been evidence of an abiotic pathway via metal interaction, biological activity is the primary means of glyphosate degradation. 96 Higher glyphosate sorption capacity, which is typically, associated with lower pH values and higher concentrations of iron and aluminum oxyhydroxides in acidic soils, and could be the cause of the studied soils’ slower rate of deterioration.
The acidic pH range (4.65-5.45) of the soils under investigation might have contributed to the formation of metal complexes with glyphosate that result in its higher stability. It is commonly known that glyphosate slows down the rate at which it decomposes because it forms stable complexes with metal ions through its O and N atoms.97 -100 Fe (III), for example can form thermodynamically and kinetically stable 5-membered rings 101 and glyphosate’s biodegradation might be prevented. Based on reports, glyphosate is more protonated in the pH range of 5.2 to 7.2 when humic acid is present, which causes stable molecules to form by an aggregation mechanism. It was shown that at pH 7, glyphosate may naturally and considerably form complexes with the soluble humic matter through non-covalent interactions, which could slow down the compound’s rate of breakdown. 66
Figure 4 illustrate the glyphosate degradation kinetics in 12 distinct soils. It was discovered that the pseudo first-order kinetics model fit the data, with R2 values ranging from .98 to .99 (Table 5). For the soils under study, first-order degradation rate constants and half-lives with corresponding ranges of 0.0076 to 0.0221 day−1 and 31.4 to 91.2 days were found. With a computed half-life of 31.4 days, SD9 surface soil had the highest rate constant (0.0221 day−1). On the other hand, SC1 soil had the maximum half-life of 91.2 days and the lowest rate constant (0.0076 day−1).
First-order dissipation parameters of glyphosate.
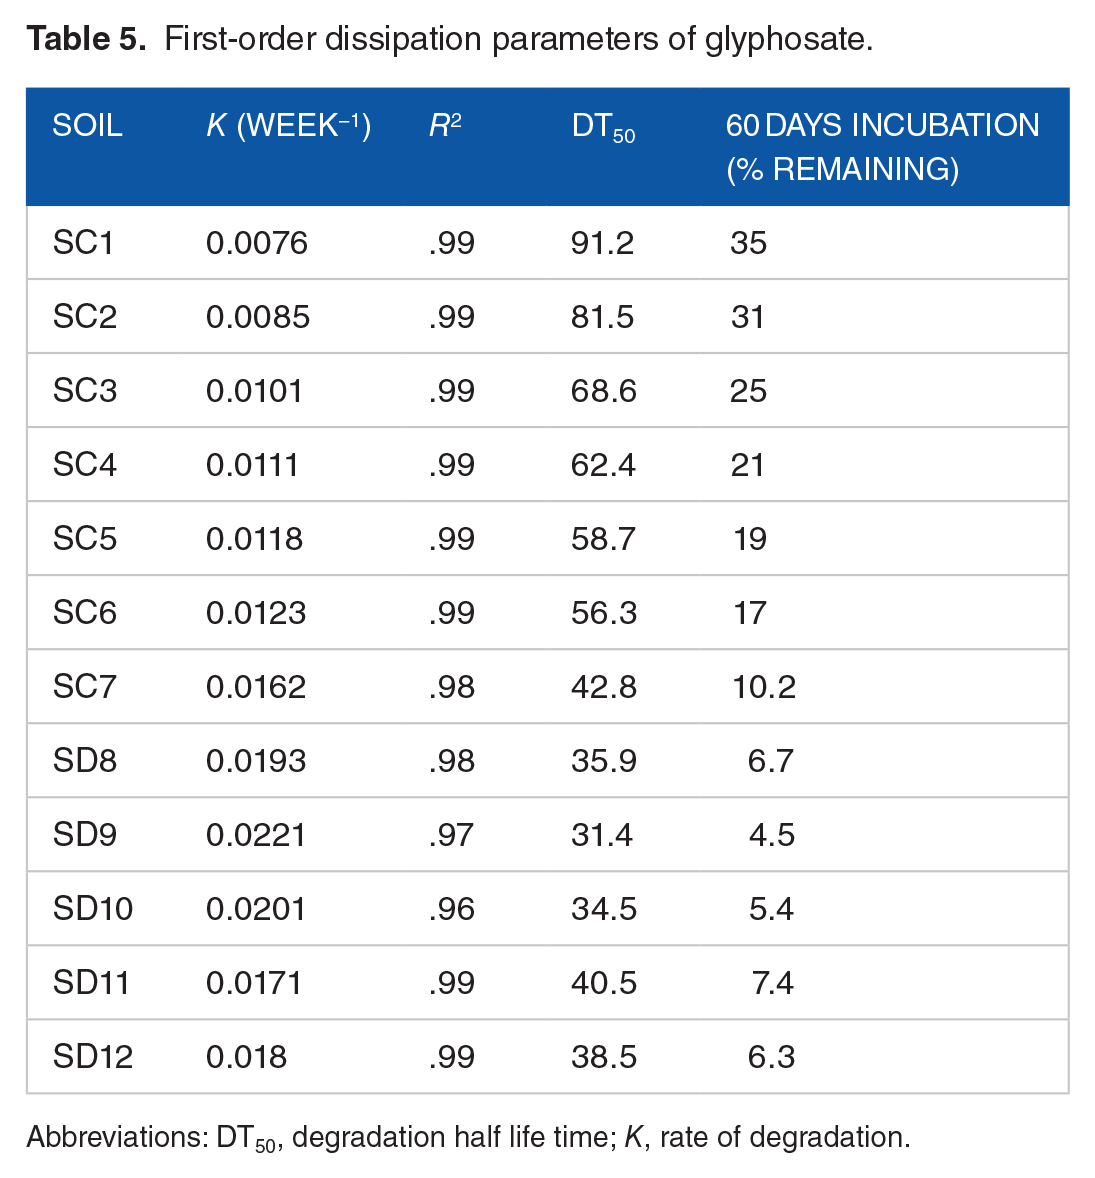
Abbreviations: DT50, degradation half life time; K, rate of degradation.
When compared to other soils, SC1’s glyphosate half-life may be longer because of the soil’s higher adsorption capacity and lower glyphosate availability in the soil solution. Higher levels of OM, Fe and Al oxihydroxides, pH, and clay percentage may be responsible for the reduced availability and increased adsorption capability of glyphosate in the soil. It is recognized that organic materials, Fe and Mn oxides, clay minerals, and other minerals make up soil particles. Regarding the adsorption of organic pollutants, each of these elements has a distinct function.102,103 The first indication that the significant adsorption of glyphosate could be explained by the presence of oxides in soils came from a study on glyphosate sorption in 5 Hawaiian volcanic soils used for sugarcane crops. 104 Subsequent research also demonstrated that glyphosates mostly interact with soil hydroxides of iron and aluminum. 105
Table 6 displays the results of a single point regression analysis that was done to determine the relationships between soil properties (predictors) and glyphosate DT50 values. The current results of DT50 values are consistent with the half-lives published for glyphosate in. 106 The average DT50 value which can vary with the environmental circumstances 107 for glyphosate in soils under investigation was 53.52. Glyphosate degraded most quickly in SD9, with a rate of 0.0221 week−1 and a shortest DT50 value (31.4); in contrast, SC1 soil exhibited the slowest rate of degradation, with a DT50 value of 91.2 and a rate of 0.0076 week−1 (Table 5). Because of its greater sorption capacity to soil minerals, glyphosate may degrade more slowly and have longer DT50 values, which would restrict pesticide access to microbial breakdown. The current study found that in soils (SC1, SC2, and SC3) containing larger percentages of clay, exAc, Fe, and Al oxides, glyphosate decomposed more slowly. This result is consistent with the study of 108 that found slower rates of pesticide degradation in soils with higher concentrations of Fe and Al oxides in the clay fraction 109 ; this is because negatively charged pesticide molecules have a strong affinity for the metals of these oxides to form complexes in soil solutions. It is also evident that the half-life time of glyphosate was discovered to be significantly impacted by the organic matter content of the soils in the research area (Table 6). According to reports, the amount of organic matter in the soil can have a significant impact on how quickly pesticides degrade. 110 Additionally, some organic amendments can slow down the rate at which pesticides (glyphosate) degrade by increasing the sorption capacity. 111
Relationship between soil properties and half-life (DT50) values of glyphosate in 12 agricultural soils.

Abbreviations: Alox, oxalate extractable aluminum; Feox, oxalate extractable iron; OM, organic matter.
The DT50 values of glyphosate showed a significant positive association (P < .05) with, %clay (R2 = .476), and oxides of Fe (R2 = .50) and Al (R2 = .73) among all the predictors examined. Conversely, there was a negative association (P < .05) between the DT50 values of the pesticides and the pH of the soil (R2 = .55, P < .05) and OM (R2 = .74). These finding suggests that a number of soil properties, including as soil OM, clay, Fe and Al oxides, and pH, had an impact on the glyphosates’ ability to degrade (Table 6). The outcome also suggests that an acceptable estimate of half-life (DT50) might be obtained by employing the variables present in our soils. Although it was discovered that sand negatively affects the half-life of glyphosate degradation, this effect is not statistically significant (P < .05). Similar research has demonstrated that glyphosate degradation is impacted by a number of soil properties, including pH, clay, OM, Feox, and Alox. 106 There was a noticeable difference in the glyphosate mineralization of different soils. The results of this study, which are in line with those of 112 showed that exchangeable acidity (exAc) was one of the factors influencing glyphosate mineralization among the ones examined. There was a strong negative (r = −.788) association at P < .0001, between exAc and rate of degradation (Table 7).
Correlation between adsorption parameters and soil properties.

Abbreviations: CEC, cation exchange capacity; exAc, exchangeable acidity; K, rate of degradation; Kf, adsorption capacity; KL, affinity coefficient; Meh P, Mehlich extractable phosphorous; OM, organic matter.
P < .05. **P < .01. ***P < .001.
Soil properties and adsorption parameters
The glyphosate adsorption behavior in the examined soils appears to be significantly influenced by the distinct intrinsic soil properties (Table 7). In particular, the result shows a negative correlation (r = −.659; P < .05) between the Kf values acquired from this study and the OM content, and a positive correlation (r = .846) between the Feox contents respectively. In line with the current investigation 113 found that quite higher OM soils promote the rapid growth of amorphous iron and aluminum oxides, which may have enhanced the soils’ adsorption capacity as opposed to the development of crystalline minerals. This is counter to the recent research findings. A significant association between Kf and pH, OC, or CEC was discovered, supporting some previous studies.108,114
In the pH range of the studied soils, glyphosate is expected to be ionic, and the main variables affecting its sorption are edge-layer silicates, poorly ordered aluminum silicates, and amorphous iron and aluminum oxides. 24 Feox and Alox concentrations were substantially higher in SC1 (97.70 and 152.37 mmol kg-1) than in SD9 (51.75and 71.89 mmol kg−1) at 0 to 15 cm depth (Table 1). In keeping with the current investigation115,116 also found a positive relationship between the glyphosate sorption coefficient and the amount of aluminum amorphous oxides in the soil. In contrast to the present investigation (Table 7), the findings of116,117 revealed no relationship between the amount of amorphous iron oxides in the soil and the glyphosate sorption coefficient.
Regressions analysis between Kf and soil parameters
Initially, simple regression was used to link the Kf coefficients with various soil characteristics.
The pedotransfer criterion for estimating the Kf coefficient from the other measured physical and chemical soil parameters was then built using multiple linear regressions (Table 8). The parameter that best explained the observed variance in Kf (R2 = .71, .0005) according to single linear single regression analysis was Feox. Exchangeable aluminum (exAl) also showed a strong positive association with Kf (R2 = .34, P = .007). The adsorption capacities of glyphosate and soil pH were shown to be significantly correlated negatively, suggesting that glyphosate is more likely to sorb to soil at lower pH values. Taking in to account 118 there is a negative association between soil pH and Kf. This behavior is caused by the glyphosate molecules and the soil’s various electrical charges as pH varies, which directly affects the electrostatic contact. 119 In addition to the glyphosate molecule, the amount of negatively charged soil colloids increases when soil pH rises, favoring the repelling forces between these compounds and so significantly lowering contact. 120 The Kf values determined for the investigated soils also align with documented data indicating that pH has an impact on glyphosate sorption. 121 The findings were consistent with those of 119 , and showed that glyphosate adsorption was more affected by soil pH (R2 = .35, P = .02) than clay (R2 = .34, P = .04).
Pedotransfer equations for glyphosate’s Kf coefficient prediction based on its chemical and physical characteristics.

Abbreviations: Alox, oxalate extractable aluminum; Feox, oxalate extractable iron; Meh III P, Mehlich extractable phosphorous; OM, organic matter.
The negative charges on glyphosate molecules and soil surfaces both rise with increasing pH. Consequently 121 this phenomenon intensifies the repulsion between the glyphosate and the soil surfaces. In acidic condition (lower pH) strong complexes that glyphosate can form with Zn, Cu, Co, or Fe has the ability to inactivate sorption of glyphosate ligands. 122 As an illustration, it was discovered that copper-glyphosate complexes decreased the herbicide’s sorption on clay minerals. 123 The negative correlation between Kf and soil pH suggests that lower pH values are more favorable for glyphosate sorption to the soil. There appears to be a competition between phosphate and glyphosate for the sorption sites in the soil 82 as indicated by the negative correlation observed with Mehlich III in the investigated soils. The present study reports a significant association between the Kf coefficients of glyphosate and OM (R2 = .43, P = .01), which is consistent with research published by124,125 In soils with high organic matter content, glyphosate sorption was significantly reduced by rising pHH2O and CEC values.
The amount of clay has a positive correlation with the Kf coefficient. The determined Kf values appeared to be less affected by the amount of clay present (R2 = .034, P = .04) compared to Feox (R2 = .71, P = .0005) and exAl (R2 = .53, P = .007). One of the earliest investigations on glyphosate sorption published in the literature 126 showed that the herbicide’s affinity for clay outperformed that of sandy soil. Subsequent research 127 verified the significance of clay concentration in glyphosate soil sorption.
Table 8 illustrates that improved relationships between the Kf values and the mixture of OM, Feox, Alox, pH (H2O), clay%, and exchangeable aluminum (exAl) were found by multiple regression analysis. Additionally, the results of the multiple linear regressions showed that a somewhat larger association was found when OM, Feox, Alox, pH (H2O), clay%, and exAl (R2 = .87, P = .001) were combined, indicating that the Kf coefficient was dependent on this combination. Weak relationships between Kf values and (single linear regression) OM, Feox, Alox, pH(H2O), clay%, exAl and pH were discovered while evaluating the correlations between Kf and the combined diverse soil indicators. The adsorption capacity of glyphosate in the research area could be best predicted by understanding the combined influence of the level and distribution of these physicochemical parameters of a specific soil.
Conclusion and Recommendations
The results of this study have made an effort to increase public knowledge of the levels of pesticide residue contamination in the districts’ agricultural soils. Unfortunately, it was found that 2 of the pesticides that were observed, s-metolachlor and glyphosate, had average levels in the studied soils that were higher than the maximum residue limits set for agricultural soils. In addition to the potential threat that these pesticide residues may pose to soil organisms, there is a chance that they will move from the soil into crops through the root system, endangering the health of those who consume these products. Owing to the glyphosate’s inferior sorption capacities in the examined soils, there is a significant risk of excessive buildup in the soil, which could lead to infiltration into groundwater or transmission into the food chain. Consequently, a powerful method of eliminating pesticide contamination might be needed, such as microbe-based bioremediation using organic matter, which accelerates the soils’ natural biodegradation processes. Furthermore, boosting soil adsorption with low-cost adsorbent, such as biochar, could contribute to a decrease in the level of pesticide pollution in the environment. The main parameters impacting glyphosate sorption looked to be pH, OM, and clay concentration, with exchangeable aluminum and Feox appearing to have a modest effect. The results highlighted the need for a deeper comprehension of the functions of OM composition, clay percentage, and metal oxides (Fe and Al) in regulating the sorption of pesticide residues in soils. Results indicate that clay concentrations, pH, OM, Feox, and Alox were the key soil factors influencing the half-life (or glyphosate degradation) in soils. In the event that adsorption capacities and degradation rates are unavailable for the particular soil and environmental circumstances of interest, comparable soil-specific experimental results under typical moisture and temperature conditions may be applied. This study suggests that soil characteristics like organic matter content, clay content, and iron oxides may influence the rate and amount of glyphosate transfer. Reducing pesticide pollution in the study area may be possible by increasing soil adsorption capacity through the use of a low cost adsorbent like biochar.
Footnotes
Acknowledgements
We express our gratitude to everyone who participated in the manuscript preparation review process.
Funding:
The author(s) received no financial support for the research, authorship, and/or publication of this article.
Declaration Of Conflicting Interests:
The author(s) declared no potential conflicts of interest with respect to the research, authorship, and/or publication of this article.
Author Contribution
BA: Manuscript draft preparation, Conducting laboratory experiment, Data analysis. EG: Sample collection, Involving in laboratory experiment, Manuscript preparation, Data analysis, Validation.
Data Availability Statement
Information will be provided upon request.