
Abstract
We examine the influence of exposure to fine particulate matter (PM 2.5) in ambient air over the previous 6 years on the average standardized test score performance in math, English language arts (ELA), and overall for sixth graders at a sample of California public school districts from 2015 through 2018. Public health research suggests that children exposed to localized air pollution may suffer from cognitive impairment during testing or chronic conditions such as asthma that could influence their academic performance. After controlling for the appropriate confounding variables, our findings indicate that a 1-unit increase (or an equivalent one-third increase in the standard deviation) in the average amount of particulate matter observed over the past 6 years in a school district reduces the average standardized test score by about 4%. In addition, a typical student in a California school district in the two highest quintiles of PM 2.5 exposure (controlling for other causal factors) exhibits standardized test scores closer to the fifth-grade equivalency level than the sixth. These results support the benefits of indoor air pollution mitigation as a likely cost-effective intervention to improve student academic success in primary school.
Plain language summary:
Why was the study done? Previous researchers found that local air pollution impacts children’s development, health, and learning ability and that exposure to fine particulate matter (PM 2.5) in ambient air can harm performance on standardized tests. This paper offers a novel approach by estimating the cumulative impact of average district-wide PM 2.5 exposure over the previous 6 years on California sixth graders’ math, English, and overall test scores. What did the researchers do? Our model connects average test scores from California public school districts to PM 2.5 concentrations measured by Census tract within the district. We include district demographic, socioeconomic, and geographic data to increase confidence that the effect is causal and minimize bias from variables correlated with PM 2.5. Data from multiple years enables the detection of long-term effects and allows us to control for district and year-specific effects. We also test the robustness of our findings to adjusted model designs and compare the effect size to prior studies. What did the researchers find? We find that an average school district in California that experiences a 1-unit increase in PM 2.5 concentration, holding other control variables constant, could expect overall grade equivalency for sixth graders to fall by about 4%. Dividing PM 2.5 exposure into five sequential levels, we find an increasingly negative effect that levels off when moving from the lowest to the highest levels. This cumulative effect is larger than prior measures of PM 2.5 impacts only on test day or over the school year. What do the findings mean? California’s primary school students have likely experienced a drop in standardized test score performance from sustained exposure to fine particulate matter. The effect size warrants policy consideration, as some paths to pollution mitigation (such as air filters in classrooms) may produce equitable and cost-effective test score gains.
Introduction
Local pollutants impact children’s development, health, and learning ability. Examples include the effects of lead poisoning, 1 pre-natal exposure to EPA Superfund sites, 2 and proximity to certain industrial facilities.3,4 The research presented here contributes to a growing body of findings establishing various forms of air pollution exposure as an additional determinant of primary school academic outcomes. This paper offers a novel approach by estimating the cumulative effects of average district-wide exposure over the previous 6 years to fine particulate matter (PM 2.5) on average district-wide performance on sixth-grade standardized tests.
Air pollutants, such as PM 2.5, accumulate in ambient air through various anthropogenic and naturally occurring mechanisms. Particulate matter, ozone, and nitrous oxides (often byproducts of fuel combustion for transportation or industrial activity) are the primary components of “smog” in urbanized areas that have led to increased incidences of asthma, lung cancer, and heart disease.5 -8 Wildfire smoke, dust, pollen, and other fine particulates from natural processes can lead to harmful exposure levels in various geographies, depending on the source and concurrent weather patterns.9,10 The localized concentration of fine particulate matter (PM 2.5) in ambient air can vary over time due to a wide range of factors, whether human-caused or naturally occurring (eg, changes in economic activity or pollution mitigation measures or changing weather patterns that bring in PM 2.5 from distant sources). Estimates show that PM 2.5 alone contributes to thousands of annual premature deaths in California, particularly in the San Joaquin Valley and other regions that have some of the highest average PM 2.5 levels in the U.S.11,12
In addition to the respiratory health implications of air pollution exposure, recent research also points to cognitive harm in a wide variety of groups, such as chess players, 13 baseball umpires, 14 stock traders, 15 politicians, 16 and office workers. 17 The effect of air pollution on a child’s academic performance in primary school is multifaceted. Chronic exposure in daily life can harm development and cause nonattendance, while acute exposure at school may impair cognitive function on test day. Understanding the effect of factors inside and outside the classroom on academic achievement is critical, as students’ success in school strongly predicts their future earnings and economic mobility.18 -20 i This research adds to the many studies establishing a meaningful connection between exposure to air pollutants such as PM 2.5 and classroom performance. Nevertheless, we offer a unique perspective by estimating the effect of cumulative exposure at the school district level over the 6 years prior to testing.
Our analysis matches average test score data from California public school districts compiled by the Stanford Education Data Archive (SEDA 21 ) with PM 2.5 concentration data collected in the CalEnviroScreen database (CES 22 ) by Census Tract, which serves as a proxy for ambient exposure at individual school sites and is used to derive our estimate of average district-wide exposure. Figure 1 shows a negative relationship between average PM 2.5 concentration for California school districts and average academic achievement. A multivariate regression analysis is necessary to establish this visual negative relationship as likely causal, and to estimate the magnitude of the observed effect of PM 2.5 while holding other causal factors constant. Using a data panel with multiple years of test scores and PM 2.5 concentration estimates enables the inclusion of school district and year-fixed effects, further establishing our model’s robustness and supporting our causal inference. While a more experimental design may further mitigate the potential for confounding variables, the benefit of our approach is the ability to identify cumulative impacts.

Scatter plot and simple regression.
We next offer a literature review summarizing prior studies on the relationship between local air pollution and test scores. A third section contains descriptive information on the datasets used in our regression analysis, while the regression model and methodological considerations are in Section 4. The following two sections include the regression results and tests supporting the robustness of our findings. Section 7 discusses regression findings, a comparison to prior studies, implications for policymakers, and ideas for future research. The paper’s final section highlights key findings and recommendations.
Literature Review
While standardized test scores do not entirely reflect a student’s abilities or future potential, many believe they are a reasonable proxy for acquiring academic knowledge that correlates positively with later-in-life economic outcomes. The following review summarizes the relationship between various forms of air pollution and test scores and explores the findings and limitations of prior studies that specifically examine this relationship.
Causality
The effect of a primary school student’s long-term exposure to local air quality on their performance on standardized tests occurs through multiple pathways. Appendix Table A1 summarizes previous empirical findings attempting to detect these pathways. For example, PM 2.5 can cause chronic respiratory illnesses such as asthma, leading to fatigue, school absences, and impaired learning. Exposure to localized air pollution may also damage long-term brain development. Even short-term exposure can cause cognitive impairment that influences classroom performance regardless of health status. Such relationships are complex, and the methodology of studies that examine these interactions only captures a subset of possible causal pathways.
Quasi-experimental studies are most effective at controlling for omitted variable bias. Still, their short-term temporal focus can only offer results reflecting the marginal impact of changes in pollution exposure over the time examined. This marginal effect of local air pollution on test day alone 23 or following an exogenous shock in ambient pollution levels 24 is likely much weaker than the cumulative impact of exposure throughout a child’s development. Most prior studies identify the air pollution effect through broad outdoor ambient concentrations or proxy indicators, ii which are fair measurements of student exposure over time but may not account for short-run idiosyncratic differences in the outdoor and indoor air quality at school, which is not typically measured. iii As employed here, a study with multiple years of data and adequate controls captures a more collective estimate of chronic pollution impacts.
Regression studies
Some previous studies on this issue use a single cross-section of observations and multivariate regression analysis to examine the influence of various pollutants on test scores. Mohai et al 4 overlap Michigan public school sites with the federal EPA’s Toxic Release Inventory (TRI) for industrial facilities, which tracks over 650 toxic compounds emitted into the air or water or sent to land disposal, 25 Students at schools in the highest quintile of toxic pollution exposure have attendance rates of 0.13 standard deviations lower than those in the lowest quintile and 0.05 standard deviations lower testing proficiency rates. Pastor et al 3 find similar results for Los Angeles area schools within 1 mi of industrial facilities that release toxins measured by the TRI. However, these studies only include 1 year of data and thus cannot control for school or school-district fixed effects. Ham et al 26 examine California public elementary schools by Census tract and find adverse effects of ozone, fine particulate matter (PM 2.5), and coarse particulate matter (PM 10) for both math and English Language Arts (ELA) scores. This study estimates that reducing PM 10 exposure at low-SES schools to the levels typically at high-SES schools would close the proficiency gap in ELA by 0.3% and in math by 0.5%. Ham et al 26 include multiple years of data and appropriate controls for year and school-level fixed effects. Additional studies using this multivariate regression approach include Kim et al 27 and Strayhorn and Strayhorn Jr 28 , which find ongoing detrimental impacts of elevated childhood blood levels of manganese and lead.
Natural experiments
Other studies attempt to isolate the effect of local pollution levels on K-12 test scores using a quasi-experimental approach, where temporal variation in pollution exposure to the same group or classification of students demonstrates that subsequent changes in test scores are more likely causal. Austin et al 29 examine a Georgia State school district that modified school buses to mitigate emissions from diesel combustion. They find that retrofitting an entire bus fleet would improve ELA scores by 0.09 standard deviations – approximately equal to the expected performance gains in their data from an additional 5 years of teacher experience. Persico and Venator 30 study openings and closures of industrial facilities with TRI emissions and find that attending school within 1 mile of a facility is associated with lower test scores of 0.024 of a standard deviation. Heissel et al 31 show that children transitioning from primary to secondary education had lower test scores, more absences, and more behavioral incidents if they moved to a school downwind of highway pollution. Gilraine 32 examines air filters installed in 18 schools in response to the 2015 Aliso Canyon natural gas leak in Southern California and finds that the schools with the filters saw math scores improve by 0.2 standard deviations over the following 4 months. Duque and Gilraine 33 measure the effect of coal-fired power production as a proxy for air pollution exposure and find that every 1 million megawatt-hours of coal generation decreases math scores at schools within 10 km of the facility by 0.02 standard deviations. A few studies, including Zhang et al, 34 , iv Roth, 35 and Carneiro et al, 36 use a quasi-experimental approach to estimate the specific effect of coarse particulate matter (PM 10) concentration. However, they cannot distinguish the effects of PM 10 and fine particulate matter (PM 2.5) since the latter is a subset of the former in terms of particle size.
Further confirmation desirable
Existing studies find adverse effects of local air pollutants on standardized test scores. The marginal effect of an increase in a particular pollutant is not necessarily linear and may vary across student groups and test types. For example, Amanzadeh et al 23 report that high ambient PM 2.5 and PM 10 levels on test day affect male students more than female students and math scores more than ELA scores. In contrast, Austin et al 29 find that diesel exhaust only affects ELA scores, not math scores. Ham et al 26 and Mohai et al 4 find adverse effects of local air pollution on ELA and math scores, though effects vary by specific pollutant. Other studies do not measure or distinguish the effects of specific air pollutants, and few studies attempt to identify cumulative rather than contemporaneous effects. As our study explicitly examines the long-run effect of PM 2.5 on student achievement, we include Appendix Table A2, which summarizes the previous research on the effects of PM 2.5 and compares effect sizes based on the time horizon of analysis.
Data
As a measure of academic achievement, we employ spring 2015 through spring 2018 annual sixth-grade standardized test score data from California public school districts with greater than 50 students obtained from the Stanford Education Data Archive (SEDA 21 ). Compiled in an accessible nationwide dataset, SEDA uses state-level annual proficiency counts and standardizes these measures to grade-level equivalency using the state’s scores from the National Assessment of Education Progress (NAEP) test. As Fahle et al 37 note, doing so requires interpolating NAEP scores for unavailable grades and years and assuming normal distributions for district test scores. v Kuhfeld et al 38 suggest that it is reasonable to use SEDA achievement measures if one desires a measure of K-12 academic achievement that is directly comparable across United States school districts.
SEDA compiles its data using two different scales, denoted as “cohort standardized” (CS) and “grade cohort standardized” (GCS). The units for the CS scale are positive or negative standard deviations of difference relative to the NAEP national reference cohort. Estimates relying on the GCS scale measure grade-level proficiency relative to a reference cohort. We use the GCS measure here due to its more straightforward interpretation and the desire for logarithmic representation. From SEDA, we also include the appropriate time-varying measures of school district characteristics as covariates in the regression analysis that control for potential determinants of academic outcomes beyond local pollution. Using SEDA data rather than state-level test score data facilitates comparison with future studies on the effect of exposure to various measures of local air pollution in other U.S. geographies through a comparable measure of academic achievement available for all U.S. school districts. As discussed below, we also offer a robustness test of our preferred regression specification by reporting on results derived through the alternative use of California-specific test data.
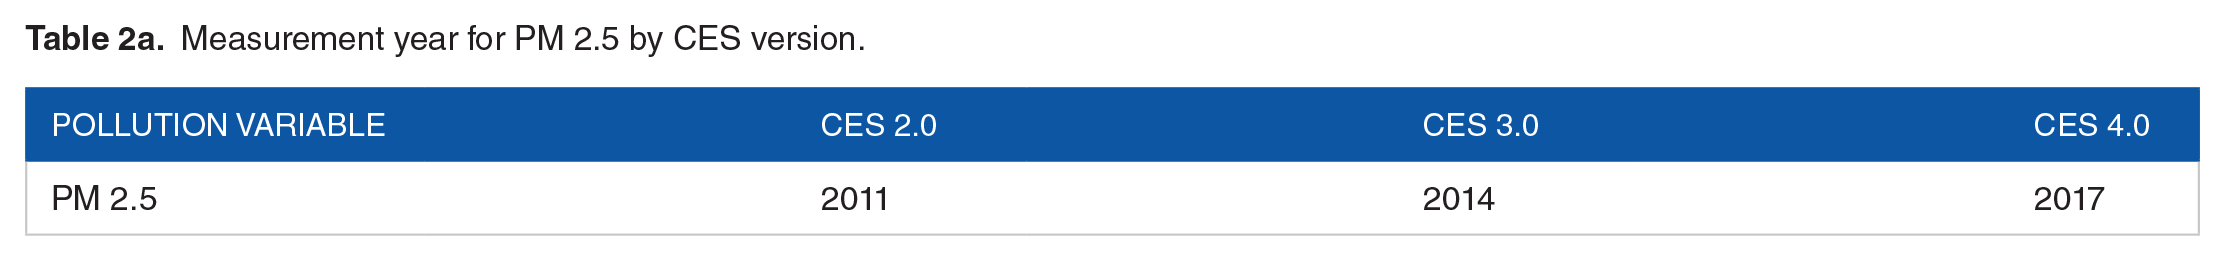
We examine only test scores from California due to the availability of a rich data set on measures of localized pollution in this state. We chose sixth-grade test scores since they measure the cumulative effects of PM 2.5 exposure over a reasonable period and contain the desired number of longitudinal observations. vi Corresponding PM 2.5 concentrations come from all the available releases of CalEnviroScreen (CES, release 2.0 through 4.0), which include PM 2.5 measurements for the six calendar years necessary to derive the average standardized test score used as the dependent variable in the regression. CES is a tool developed by the California Office of Environmental Health Hazard Assessment (OEHHA) that tabulates pollution measures by Census tract. 39 , vii The CES measurement of PM 2.5 by Census tract represents the annual average concentration. A distance-weighting algorithm prioritizes direct air pollution measurements from approximately 140 local air monitors in California. At the same time, gaps in coverage are filled with satellite data collected over standardized one-square-kilometer cells. viii Though CES includes 13 total pollution indicators, only PM 2.5 is sufficiently consistent in methodology across CES versions for assembling a data panel that aligns with the available SEDA test score years.
Table 1 includes a brief description of each variable used in this study. In the next section, we summarize the methodology behind this study and the underlying theoretical relationship between standardized test performance as a dependent variable and various determining factors, including pollution exposure.
Descriptive statistics.
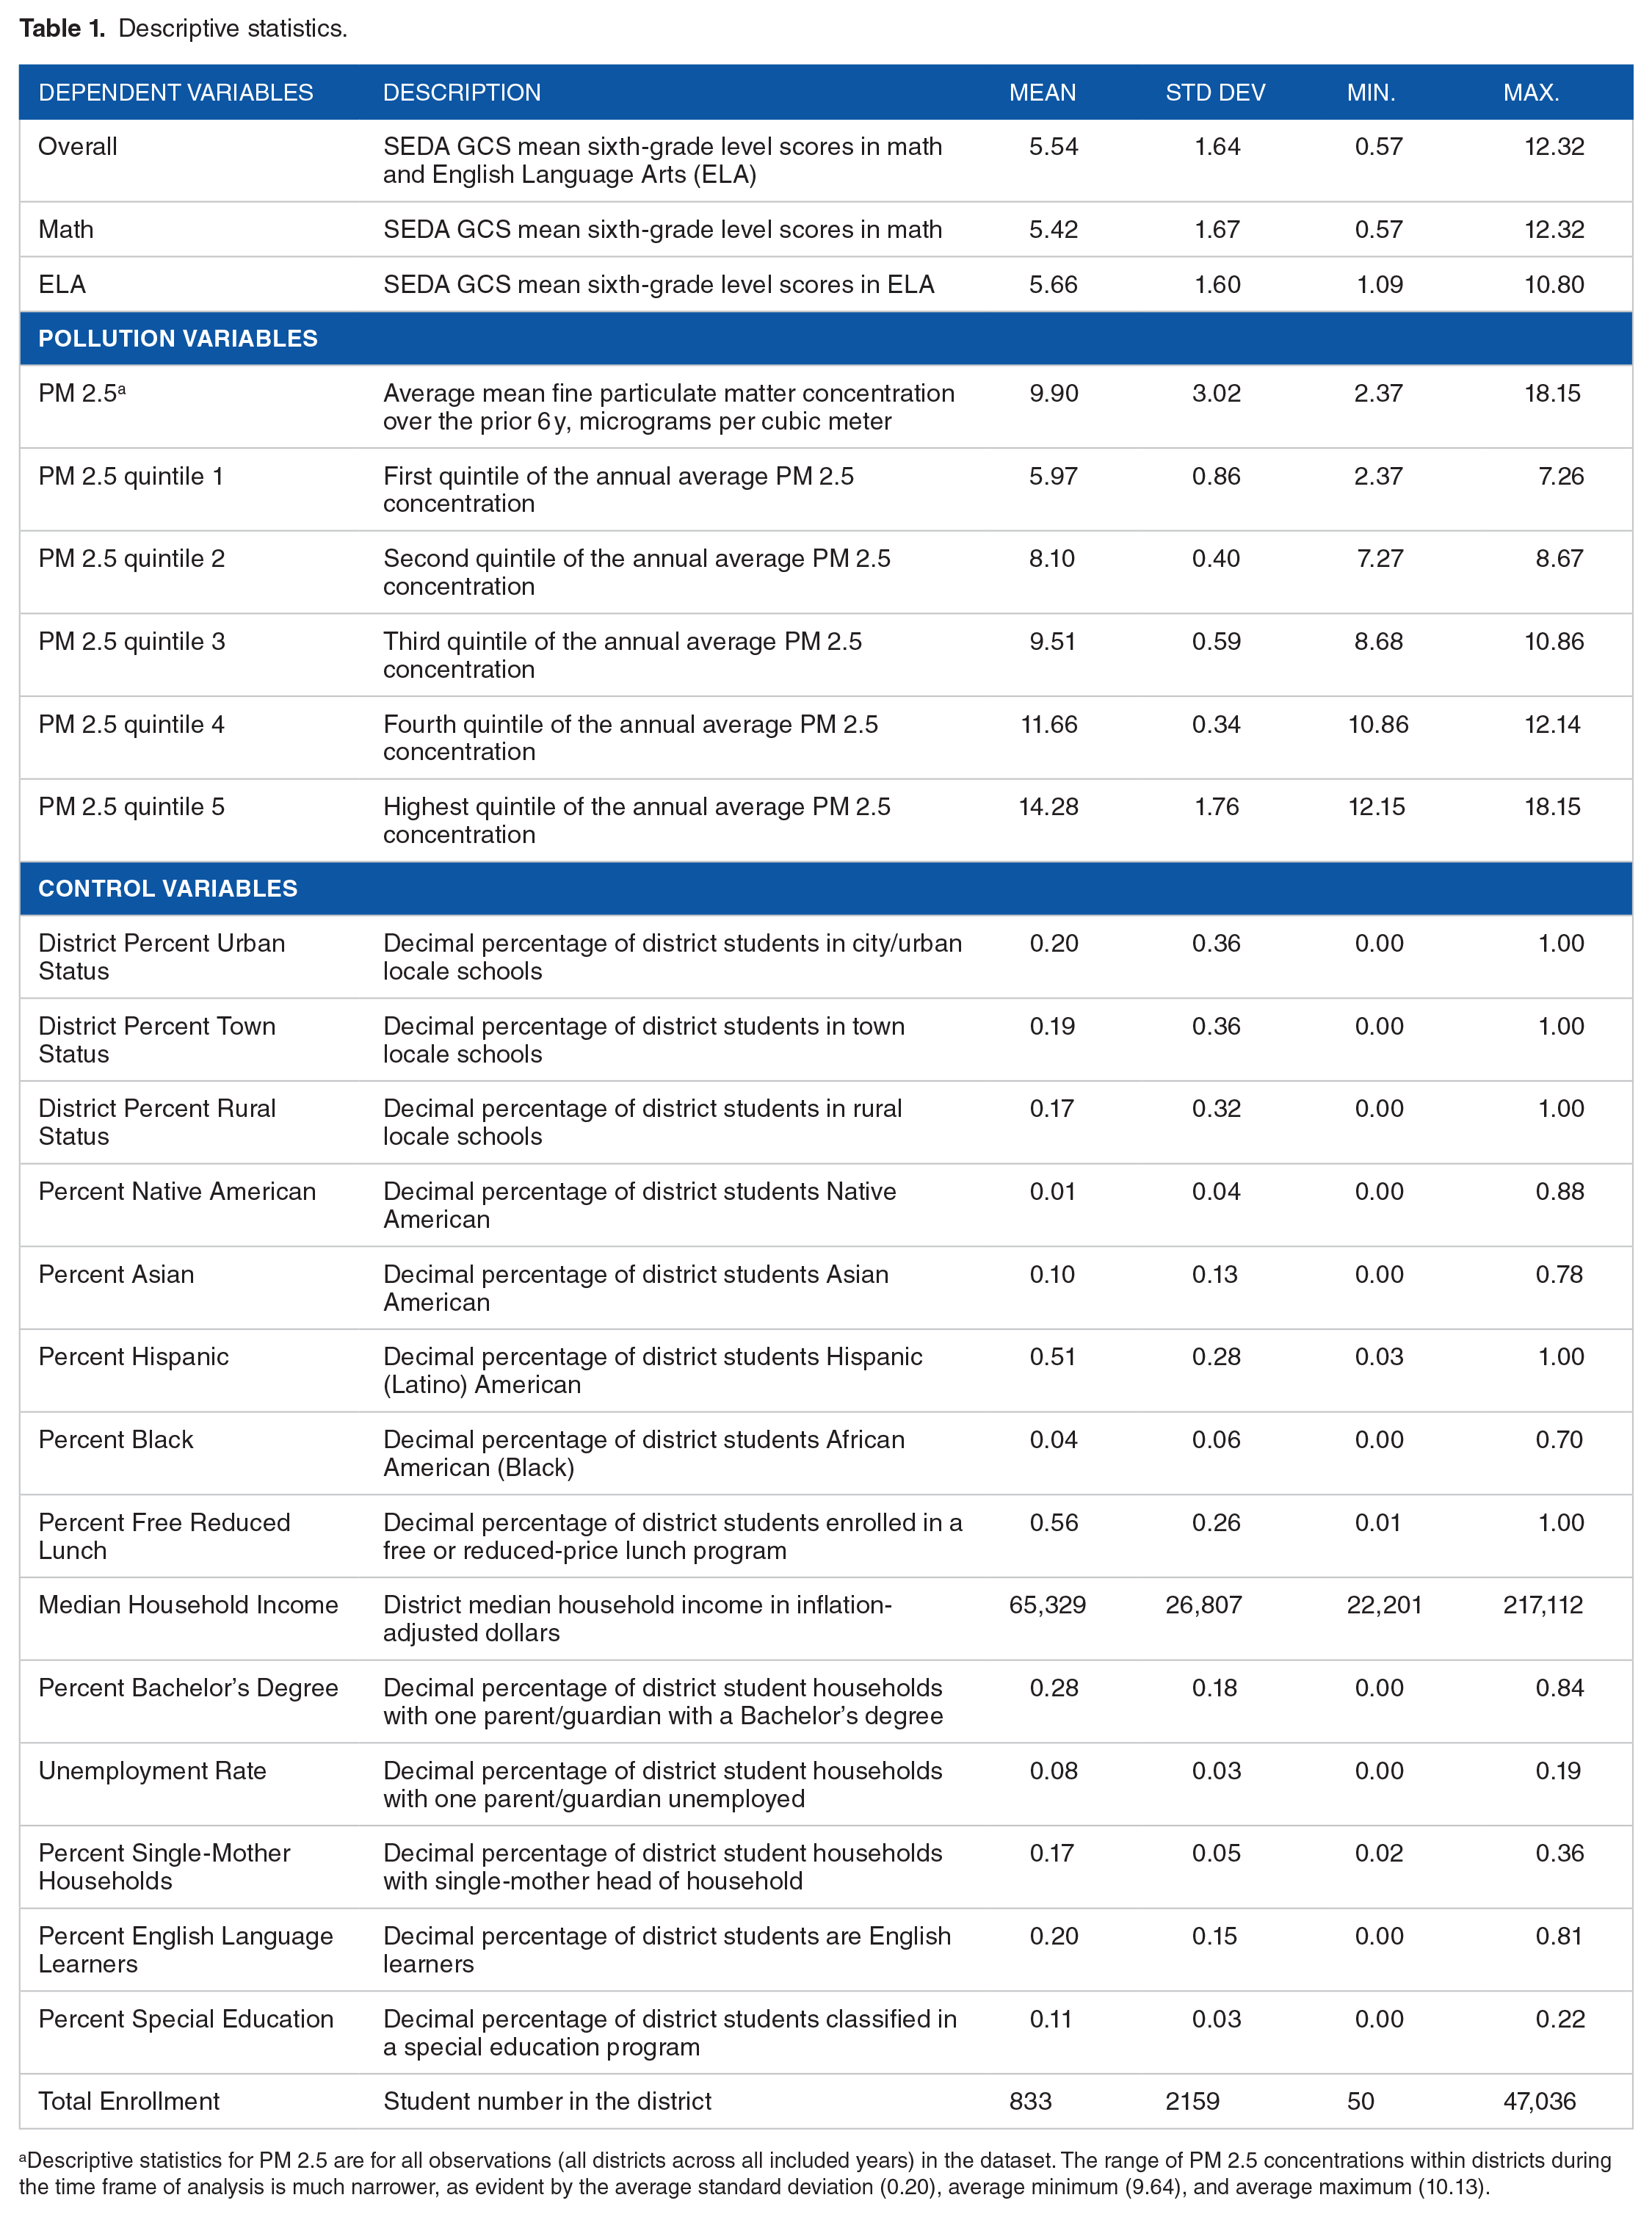
aDescriptive statistics for PM 2.5 are for all observations (all districts across all included years) in the dataset. The range of PM 2.5 concentrations within districts during the time frame of analysis is much narrower, as evident by the average standard deviation (0.20), average minimum (9.64), and average maximum (10.13).
Methodology
Our methodology ensures a robust estimate of PM 2.5 impacts on test scores. To measure average exposure in a school district to the PM 2.5 variable in the CalEnviroScreen (CES) database, we first used GIS mapping to match every California public school site in the included school districts to their corresponding Census tract(s). ix We then construct a lagged data panel that connects district scores on math, ELA, and overall for school years 2014 to 2015, 2015 to 2016, 2016 to 2017, and 2017 to 2018 with a rolling average PM 2.5 pollution score reflecting CES data measurement timeframes and approximates student exposure over the 6 calendar years preceding each test year (see Table 2). These district averages do not estimate pollution exposure at a specific school site. Instead, they measure average exposure across an entire school district. This is perhaps a more appropriate measure because many students, due to California’s open enrollment policies, attend an elementary school within the district where they live but not near their neighborhood school site. Thus, a measure of average exposure in a district better accounts for exposure outside of time spent at their school site. Our lagged panel data set enables the measurement of cumulative harms incurred from PM 2.5 in the years before testing and the measurement of how PM 2.5 exposure changes over time within each district.
Measurement year for PM 2.5 by CES version.
Lagged data panel construction, with 6-year lagged rolling average CES PM 2.5 scores.

The Stanford Education Data Archive (SEDA) also contains student information for each school district and year of the analysis, which, besides PM 2.5, likely influences differences in average standardized test scores. We utilize these as controls in the regression analysis to produce a comprehensive model of educational determinants and isolate the effect of cumulative fine particulate matter exposure. However, SEDA does not provide additional relevant explanatory variables like district-wide per-pupil expenditure, teacher experience, student-teacher ratio, administrative structure and practices, curriculum, extracurricular offerings, etc. To control for these factors in as much as they do not vary over the years observed, we take advantage of the panel structure of the data and include school-district fixed effects. Also included are year-fixed effects to control for temporal factors influencing average district-wide standardized test scores. x
Regression model
Our regression model captures the broad categories expected to influence differences in the three dependent variable measures of standardized test score achievement by grade-level equivalent used in our analysis. To ensure a robust and reliable assessment of PM 2.5 (Pollution) on academic performance, we include other relevant factors representing Demographic, Socioeconomic, Geographic, Academic, Year, and School District effects. Equations (2)–(8) offer the actual variables representing these broad categories at the nearly 600 xi school districts used for this analysis, drawn from academic years 2014 to 2015 through 2017 to 2018.

where,


Other methodological considerations
Our panel-data regression analysis, a novel approach to measuring the cumulative effects of air pollution exposure on academic performance, is susceptible to heteroskedasticity through residual errors that correlate across geographies. Most previous studies used one level of geographic error clustering (e.g., References26,40). Only Heissel et al 31 reported regression results with various error clustering by the student, school, and zip code. The ideal level of error clustering is not definite. As Cameron and Miller 41 describe, clustering at more aggregate levels typically offers less bias but more variability, leading to larger regression coefficient standard errors and less statistical significance. Thus, without a clear theoretical imperative to do otherwise, a conservative approach favors error clustering at higher levels, which for the SEDA data is by commute zone. xiii
Our measure of PM 2.5 may also represent the potential differing effects of other common co-pollutants in ambient air. While we could not include other CES air pollution indicators in our regression trials due to data limitations across panel years, we can assess the level of correlation between these variables over a limited timeframe. Table 3 shows a small to moderate level of correlation (as measured by Pearson’s r) between PM 2.5, Diesel PM, and Ozone – which we expect given that diesel particulates are typically less than 2.5 microns in diameter (ie, they are a subset of PM 2.5) and that these three air pollutants have some overlap by source and geographic distribution. Earlier studies such as Ham et al 26 found high intercorrelation between air pollutants and thus included each variable individually in regression trials, as multicollinearity may obscure the statistical significance of any individual pollution variable by biasing standard errors upwards. Similarly, we only include PM 2.5 as an independent pollution variable but note that some of the detected effects may be attributable to other geographically overlapping air pollutants. Additionally, we use the natural log of all grade equivalent average test outcomes as the dependent variable to account for any non-linear relationships with the included explanatory variables. This offers the added benefit of regression coefficients representing the expected percentage change in a test score given a 1 -unit change in the measure of an explanatory variable.
Air pollution variable correlation coefficients (Pearson’s r) for 2015 only.

A further methodological consideration is that the incremental effect of air pollution differs based on concentration or geography/land use. Considering this, we conducted a quintile regression to determine whether the effects on test scores varied by each quintile of PM 2.5 concentration. xiv We also examine whether the effect of PM 2.5 varies based on a district’s urban or rural status in response to previous studies, such as Kodros et al 42 , which found that the constituent compounds of ambient particulate matter are more toxic in urban areas. xv
Finally, we consider the possibility of bias in our regression results due to student sorting effects or unobserved economic factors that correlate with PM 2.5 pollution. As mentioned, our study aims to identify cumulative pollution impacts by measuring the impact of average PM 2.5 concentrations experienced in the 6 years before testing for California school districts. This approach offers an important point of comparison to other studies that measure only contemporaneous effects experienced in a limited timeframe immediately following a change in pollution levels. Such studies guard against omitted variable bias by including individual student fixed-effects or a cause-effect design that ensures consistency in student demographics or local conditions. While our effect identification is possibly less robust than these quasi-experimental studies, we have reasonable confidence that bias in our regression results will likely be minimal. The influence of potential sorting of high-achieving students within or between districts in response to PM 2.5 levels is likely mitigated by our suite of demographic and socioeconomic control variables (eg, race/ethnicity, district median income, percent subsidized lunch, unemployment rate, percent of parents with a bachelor’s degree), as these controls capture variation within districts over time in our panel data construction. xvi However, we cannot fully rule out local economic conditions or other idiosyncratic factors that may correlate with PM 2.5 levels for some observations in our dataset and are not otherwise captured by our district or year fixed-effects or the time-varying geographic, demographic, or socioeconomic control variables. xvii
Results
Primary regression findings
Our fixed-effects panel data regression investigation began by taking the natural log of all three grade-cohort standardized (GCS) dependent variable measures of a district’s average academic achievement (math, ELA, and overall) and clustering the standard errors at each of the four possible levels. Table 4 presents the elasticity at the mean and the linear regression coefficient for the PM 2.5 variable, which shows that PM 2.5 yielded a negative and statistically significant effect on all three available test score measures, regardless of the error clustering level used. Regarding effect size, we find that an “average” school district in California (with a PM 2.5 concentration of about 9.9 µg/m³ as indicated in Table 1) that experiences a 1 -unit increase in this pollutant (ie, 1.0 µg/m³ or about one-third of its standard deviation), holding other control variables constant, could expect overall grade equivalency for sixth graders to fall by about 4%.
Regression results by test score type and error clustering level. a
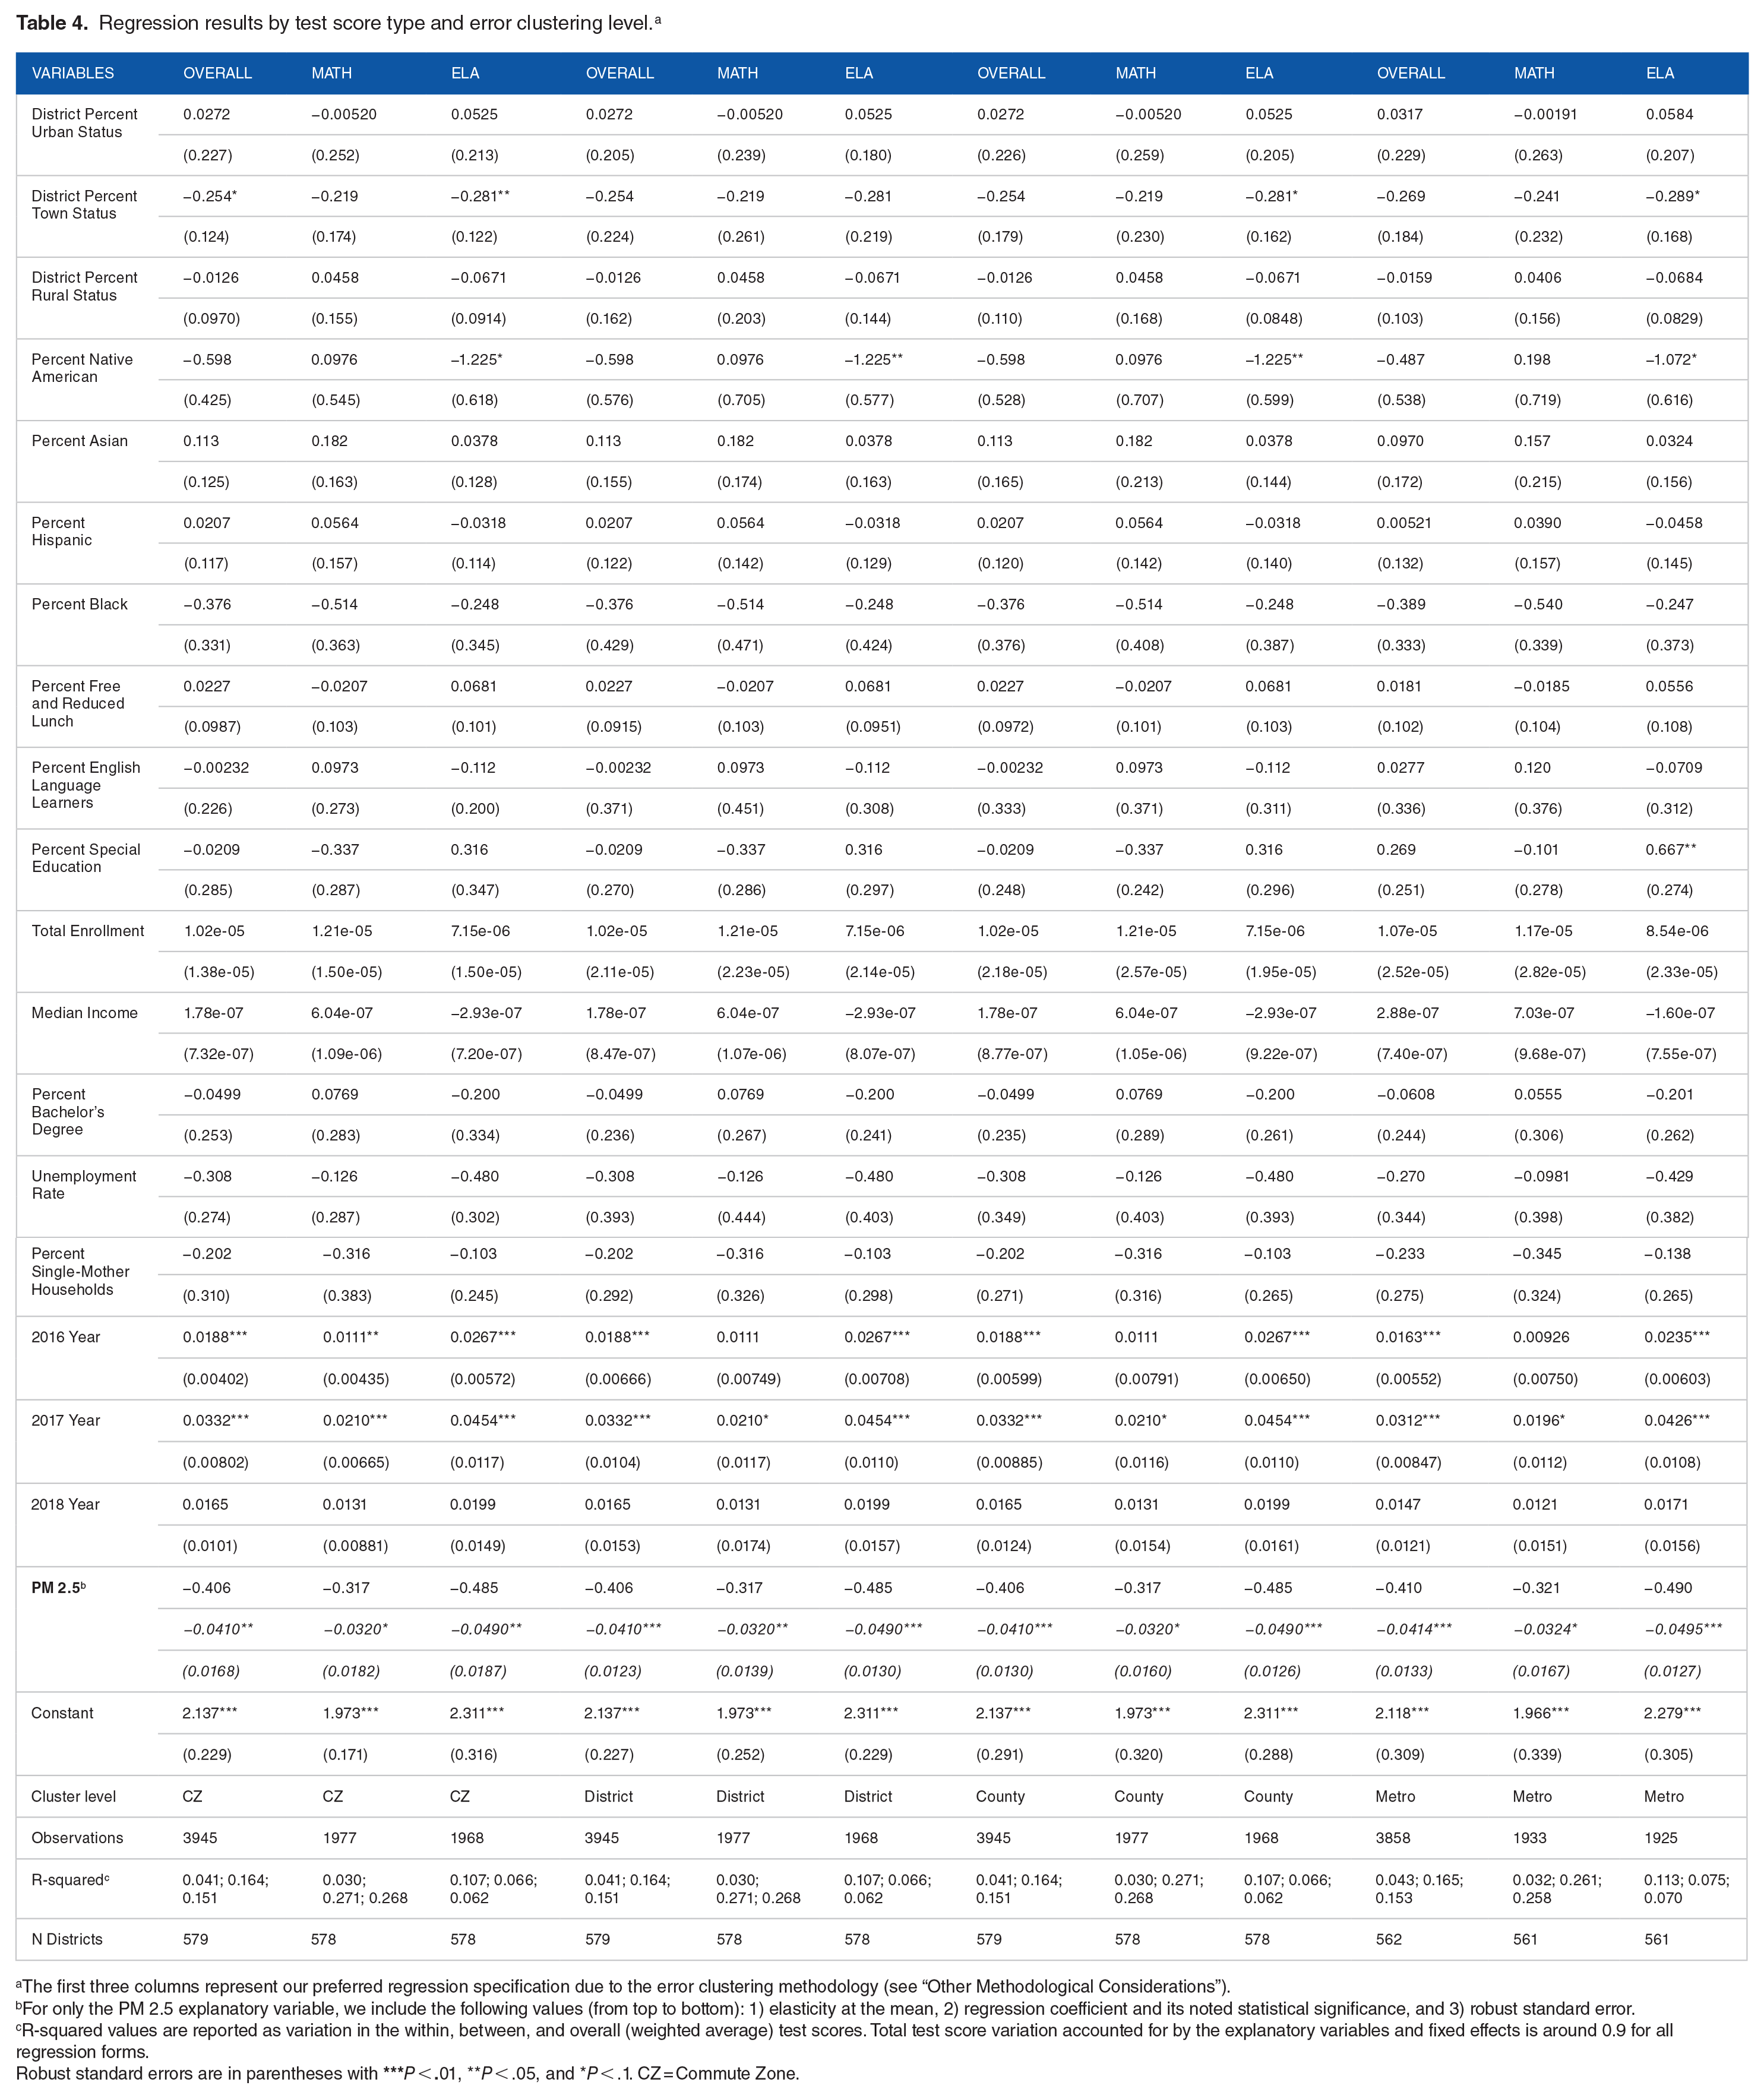
The first three columns represent our preferred regression specification due to the error clustering methodology (see “Other Methodological Considerations”).
For only the PM 2.5 explanatory variable, we include the following values (from top to bottom): 1) elasticity at the mean, 2) regression coefficient and its noted statistical significance, and 3) robust standard error.
R-squared values are reported as variation in the within, between, and overall (weighted average) test scores. Total test score variation accounted for by the explanatory variables and fixed effects is around 0.9 for all regression forms.
Robust standard errors are in parentheses with ***P < .01, **P < .05, and *P < .1. CZ = Commute Zone.
Robustness tests
Our preferred specification uses the dependent variable of the SEDA grade-cohort-standardized (GCS) test score measurement (derived from national NAEP testing). This grading scale offers readily interpretable units (grade-level achievement for sixth grade) that are directly comparable between school districts nationwide. However, SEDA also offers a cohort-standardized (CS) grading scale that applies different methodological assumptions. Appendix Table A3 includes regression trials that match our preferred specification except with test scores measured using the SEDA CS scale as the dependent variable. xviii The similarity of results, whether using the CS CGS calculated dependent variables, demonstrates the robustness of our findings in this measurement change.
Separately, both SEDA scales are configurations of raw test score data that necessarily make assumptions for aggregating academic proficiency measures across states. 38 Given the possibility that these aggregating assumptions could bias our PM 2.5 findings, we ran additional regression tests using the same group of SEDA control variables and California-specific sixth-grade test score data from the California Assessment of Student Performance and Progress (CAASPP) Smarter Balanced Assessments. 43 These CDE test scores also measured overall, math, and English Language Arts (ELA) achievements by mean scaled score and the percent of students that met or exceeded grade standards. We include the resulting regression results in Appendix Table A4, with descriptive statistics for these alternative test measures in Appendix Table A5. The alternative regression findings, using the California-specific CAASPP test score data, still show statistical significance for the negative effect of PM 2.5 on overall and ELA scores. However, the level of statistical significance for the negative effect of PM 2.5 exposure on the CAASPP mean scaled score for math is only just above the 84% confidence level in a two-tailed test. While we detected a negative effect for PM 2.5 exposure on the percent standard met and above for math, it is only statistically significant at the 64% confidence level in a two-tailed test. These findings, though not entirely confirming in the case of comparing California-specific CAASPP math outcomes to nationally normalized SEDA math outcomes, instill some level of confidence that the potential bias of using the SEDA data set is not large enough to change our primary finding that fine particulate matter does exert a negative influence on sixth-grade standardized test outcomes, at least for ELA and overall scores. The discrepancy in the math finding for CAASPP outcomes may mimic the same reasons already offered for this research not exerting as large an influence on math outcomes. Given the general alignment in regression results between the SEDA data and the CAASPP data, we are confident in using the SEDA data to conduct our various forms of regression analysis.
Interaction and quintile regression findings
In addition to deriving the average linear effects of air pollution as a continuous variable, we also tried including a set of dummy variables that account for where the previous 6-year average of PM 2.5 in the district fell within the quintile distribution of PM 2.5 data across all districts and observed times. xix Our inspiration for doing this comes from Mohai et al 4 and Pham and Roach, 44 who examined the effect of different air pollution measures on student proficiency and attendance rates by concentration quintiles. xx These quintile regression results illuminate potential non-linearity in the air pollution effect that offers potentially relevant policy implications. As shown in Table 5, using the results for overall test scores, the effect of PM 2.5 becomes increasingly negative when moving from the lowest quintile (the base case in the regression) to the higher quintiles. xxi However, it is worth noting that we detect that the changes in this effect levels off at the highest quintiles. Figure 2 illustrates a simulated drop in grade-level achievement from moving to higher levels of PM 2.5 exposure. Specifically, moving to quintile two of PM 2.5 exposure represents a 3.1% decrease in grade-level achievement relative to quintile one, and respectively, moving to quintiles three, four, and five decreases overall grade-level achievement by 4.3, 4.6, and 4.6% points relative to quintile one.
Quintile regression results.
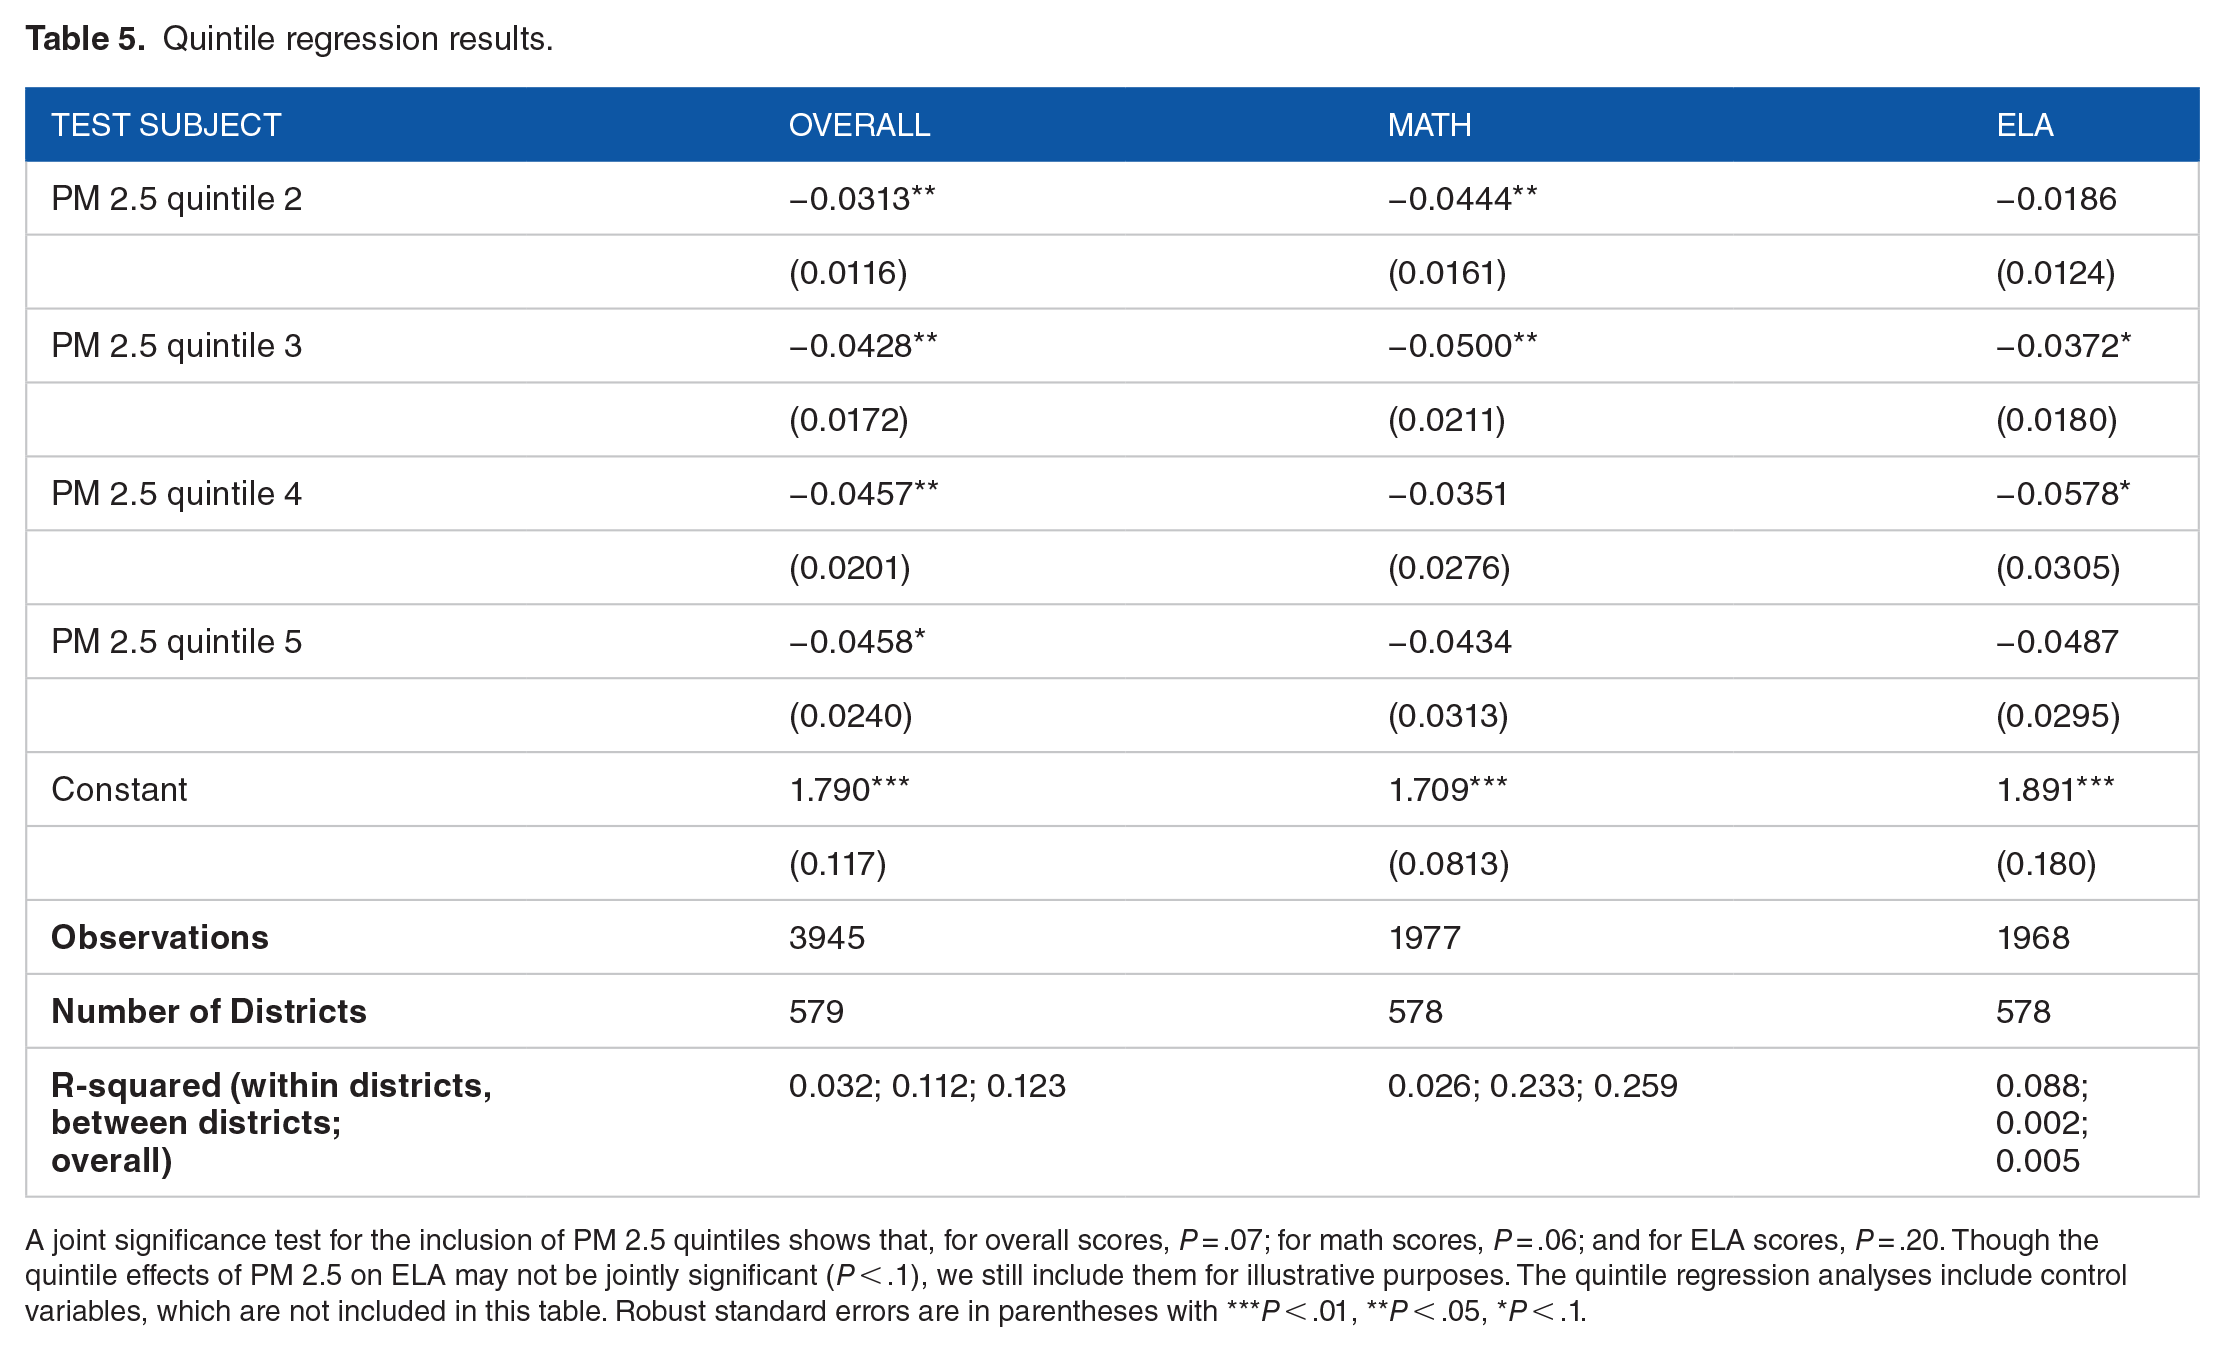
A joint significance test for the inclusion of PM 2.5 quintiles shows that, for overall scores, P = .07; for math scores, P = .06; and for ELA scores, P = .20. Though the quintile effects of PM 2.5 on ELA may not be jointly significant (P < .1), we still include them for illustrative purposes. The quintile regression analyses include control variables, which are not included in this table. Robust standard errors are in parentheses with ***P < .01, **P < .05, *P < .1.

Quintile regression results.
Kodros et al 42 find that the marginal effect of air pollution on test scores varies by geography and land use. They speculate this is due to differences in the types of chemical compounds found in the particulates suspended in ambient air, which may vary by the source of the particulates (eg, wildfires versus industrial manufacturing). To examine the relevance of this finding with our data set, we added an interaction term between PM 2.5 and a school district’s urban or rural makeup into our preferred regression specification. We have not included these findings because, in all cases, this exercise yielded no statistically significant (P < .1) findings.
Discussion
Comparison of PM 2.5 effects on math, ELA, and overall scores
We have found that fine particulate matter in ambient air negatively affects math, English Language Arts (ELA), and overall SEDA test scores measures in terms of grade-level equivalency. Interestingly, the magnitude of the effect appears to be greater for ELA scores in the linear regression analyses yet larger for math in the low to median quintiles of exposure (Tables 4 and 5), suggesting possible nonlinearity and different causal mechanisms depending on test type. Ham et al 26 and Austin et al 29 attempted to differentiate the pollution effect by test type. Both studies find that PM 2.5 more strongly affects ELA scores. Other studies examining air pollution and test scores do not differentiate math from ELA. It is possible that ELA testing or learning requires greater cognitive focus and is more susceptible to an acute or chronic pollution effect. However, the comprehension of this potential causal mechanism is incomplete. Thus, we suggest further research to examine the different causal paths by which pollution exposure affects different test subjects.
Effect size analysis
Appendix Table A2 presents a detailed comparison of effect sizes from prior studies. It shows that the effect we find for PM 2.5 on test scores is generally larger than previously detected. For example, the finding in Gilraine and Zheng 40 that 1 µg/m³ increase in ambient PM 2.5 decreases subsequent average test scores by 0.02 standard deviations is comparable to our finding after the following translation. Using the regression coefficient of −0.041 found in column 1 of Table 4 and the average district grade-level achievement for California sixth graders (5.54), the derived effect of a 1 -unit increase in PM 2.5 on the natural log of overall test scores translates into a 0.22 (−0.041 * 5.54) drop in grade-level equivalence. This effect represents a 0.136 standard deviation decrease in overall test scores, that is, 6 to 7 times the effect size found in Gilraine and Zheng. 40
Typically, studies such as Gilraine and Zheng 40 that compare average exposure between schools or districts over an entire school year find an effect that is much larger than studies such as Amanzadeh et al 23 that only measure the effect from elevated exposure on test day. This relationship is logical as pollution-induced learning loss may compound across additional instances of exposure. Since our study examines an even longer time frame of exposure (the prior 6 years), it thus follows that we would find an even more substantial effect than studies examining pollution exposure either only on test day or in the preceding months.
Policy implications
Existing research suggests that exposure to elevated levels of particulate matter in ambient air likely causes a measurable decline in academic test scores, whether through acute cognitive impairment or other chronic physiological harms. Even though continued pollution exposure across grade years may lead to compounding learning loss, prior studies also show that ceasing pollution exposure subsequently improves test scores, and some straightforward interventions to mitigate pollution exposure may produce cost-effective academic benefits. Consider Gilraine’s 32 finding that air purifiers installed in classrooms subsequently improved average student test scores by 0.2 standard deviations. While this result may appear somewhat higher than in similar studies in Appendix Table A2, it is not unreasonable given our regression findings. According to Gilraine 32 , local PM 2.5 levels in the area surrounding schools receiving indoor air quality treatment averaged 7.33 µg/m3 during the treatment period, and the treatment likely reduced indoor particulate concentrations by 90% (per prior engineering estimates). For comparison to our measure of cumulative effects, we also assume equivalence between pre-treatment indoor and outdoor PM 2.5 levels and that students experienced treatment during 18% of the treatment period (6 hours per day, 5 days per week). If applying our linear regression coefficient, we would expect an overall test score improvement of 0.16 standard deviations following Gilraine’s 32 study of classroom air treatment. xxii Thus, the finding in Gilraine 32 is high but, perhaps, still reasonable. Our findings support PM 2.5 air pollution mitigation and classroom air purification as a potentially cost-effective education intervention. xxiii Still, we also note a high degree of uncertainty regarding these input assumptions since 1) indoor air quality may be worse than outdoor air quality, 45 2) time spent in the classroom should perhaps be given more weight due to cognitive impairment while testing or learning, and 3) commercially available air purifiers may mitigate more pollutants than just PM 2.5 (though, conversely, they may also remove less than the assumed 90% of indoor particulates, as estimates vary. 46
Quintile regression findings
Our quintile regression trials provide practical insights. They reveal that the marginal impact of PM 2.5 exposure on math, ELA, and overall test scores decreases at higher levels of exposure. xxiv This means that the most polluted school districts need to see a steeper drop in outdoor ambient pollution to achieve the same education gains as a district that moves from medium to low air pollution levels. Notably, in February 2024 the Federal EPA revised the Clean Air Act attainment threshold for ambient PM 2.5 concentration from 12 µg/m3 to 9 µg/m3. 47 While we have insufficient data to examine a specific subset of districts with average PM 2.5 levels that passed attainment thresholds during the study period, our quintile regression coefficients suggest that California air districts achieving this revised standard would only see minor education benefits, as increasing marginal benefits from ambient PM 2.5 abatement occur at levels below 9 µg/m3. These findings underscore the potential of indoor filtration as a practical near-term education intervention, as it can rapidly deliver a substantial drop in air pollution exposure in the most polluted districts, particularly in the home or classroom setting. This has significant implications for policymakers and educators, highlighting the potential benefits of air pollution mitigation in educational settings.
Remaining questions and future research
Our findings align with a growing body of research highlighting the detrimental effects of particulate matter exposure on academic achievement. However, there is still much to learn. We propose further research to fully understand the mechanisms and subcomponents driving this effect, including the relative contributions of cognitive and respiratory harms and the causal pathways that may produce differing effects on math and ELA scores. Particulate matter is a broad term for various small particles that accumulate in ambient air and can cause health issues through inhalation, with finer particles able to penetrate deeper into the lungs. 48 Nevertheless, the composition of particulate matter can vary depending on the source and location. As mentioned earlier, some previous studies suggest that the influence of PM 2.5 may vary geographically, which follows from the different constituent compounds present in PM 2.5 from anthropogenic sources (eg, industrial exhaust) and natural sources (eg, wildfire smoke, dust, pollen, and sea spray).42,48,49 However, our research did not find differing per-unit effects of PM 2.5 between urban and rural school districts.
Furthermore, different air pollutants are often intercorrelated. Thus, the specific effects of a component of air pollution are difficult to isolate. This is not just an academic concept but a crucial consideration from a policy perspective. This means mitigation measures or regulatory standards for pollution sources can simultaneously affect multiple air pollutants without differentiation. This understanding is intriguing and vital for developing effective policies to combat air pollution.
Conclusion
California’s primary school students have likely experienced a demonstrable drop in standardized test score performance from exposure to fine particulate matter pollution in ambient air, and this learning loss likely compounds over time as air pollution in California remains elevated. The effect sizes we find for PM 2.5 are substantial enough for policy consideration, mainly as some paths to pollution mitigation (such as installing air filters in classrooms) may produce test score gains that are more cost-effective than other commonly prescribed educational interventions. Our derivation of detected effects is only based on average exposure across the entire school district, which may mask particularly acute effects during peak exposure times xxv or when the concentration of air particulates occurs near a specific school site.
Finally, we argue that all studies examining the connection between pollution and academic achievement (including this one) could underestimate the actual aggregate effects by not accounting for the long-term impacts of pollution exposure on socioeconomic status. Existing research indicates that air pollution exposure harms cognition and test performance and lowers expected lifetime incomes.50,51 Such lower income could result in a parent being unable to purchase or rent a home in the “quality” school districts with higher standardized test scores or directly improve their child’s educational outcomes through tutoring or other enrichment activities. Thus, pollution mitigation provides both an immediate, direct benefit for current students and an indirect benefit for students in subsequent generations. As such a profound correlation exists between race, income, pollution burden, public health, and academic achievement, the benefits of a policy intervention to mitigate primary student exposure to air particulates would likely work toward closing inequitable gaps in public health and educational outcomes.
Footnotes
Appendix
Descriptive statistics for alternate CAASPA test score measures (sixth grade scores for 2015-2018).

| Dependent variable and test type | Mean | Std. Dev. | Minimum | Maximum | N observations |
|---|---|---|---|---|---|
| SEDA Cohort-Standardized (CS) Scale | |||||
| Overall | −0.149 | 0.495 | −1.702 | 1.935 | 4428 |
| Math | −0.183 | 0.508 | −1.702 | 1.935 | 2220 |
| ELA | −0.115 | 0.479 | −1.470 | 1.412 | 2208 |
| CAASPP Smarter Balanced Assessment Mean Scaled Score | |||||
| Overall | 2514.7 | 45.1 | 2384.5 | 2661.4 | 4081 |
| Math | 2510.9 | 48.2 | 2384.5 | 2661.4 | 2046 |
| ELA | 2518.6 | 41.6 | 2410 | 2635.7 | 2035 |
| CAASPP Smarter Balanced Assessment Percent Standard Met and Above | |||||
| Overall | 41.5 | 19.6 | 0 | 94.1 | 4081 |
| Math | 36.3 | 19.2 | 0 | 91.5 | 2046 |
| ELA | 46.7 | 18.5 | 2 | 94.1 | 2035 |
Acknowledgements
This research and subsequent paper only received external funding from the Sacramento State Open Access Publishing Fund. Its production benefited from the thoughtful comments of students and faculty at California State University, Sacramento, where Michael Turgeon completed his MPPA with a culminating project on a similar topic.
Author Contribution
This work began as a quantitative methods class project while Michael Turgeon was a Master’s in Public Policy and Administration student at Sacramento State. Professor Robert Wassmer and him then worked jointly and equally on the development of this draft into a publishable manuscript.
Declaration of conflicting interests:
The author(s) declared no potential conflicts of interest with respect to the research, authorship, and/or publication of this article.
Funding:
The author(s) disclosed receipt of the following financial support for the research, authorship, and/or publication of this article from the Sacramento State Open Access Publishing Fund.
Disclaimer
The opinions found in this research are meant in no way to represent those of the California Air Resources Board.
i.
The known determinants of educational outcomes, besides ambient air quality, serve as critical control variables for our subsequent exploration of cumulative air pollution impacts.
ii.
Examples include 1) direct ground-level pollution monitor data when available, 2) algorithmic prediction from satellite data when direct measurements are not available (e.g., Zhang et al 34 ), or 3) instrumental variables that are known to correlate with local air pollution levels, such as wind patterns, 52 power plant operation, 33 or proximate road-density. 24
iii.
Exceptions include Roth, 35 which employed direct readings of indoor air pollution levels during university exams.
iv.
Zhang et al. 34 notably distinguish between acute and chronic air pollution exposure, showing that a one-standard-deviation increase in an average Air Pollution Index (API) over the 3 years before cognitive tests produces around four times the effect of a similar increase over the week before testing.
v.
While state-specific proficiency testing is generally conducted annually in math and ELA for each grade 3 to 8, NAEP testing is only conducted for fourth and eighth graders every 2 years.
vi.
SEDA dropped California math scores for seventh and eighth graders from 2009 to 2014 since those student assessments were end-of-course rather than end-of-grade.
vii.
CES version 1.0 assigned scores to zip codes rather than Census tracts and thus is not directly comparable with subsequent versions for our analysis.
viii.
ix.
Our dataset includes a median of one school per Census tract and six schools per district.
x.
Some studies have also included climate variables such as wind patterns 52 or ambient temperature, 35 where methodologically applicable. As used in these studies, it is an instrumental variable to strengthen causal identification. Ambient temperature may also be a relevant control variable. However, both climate variables are outside the scope of our analysis, given that our PM 2.5 estimate captures average ambient levels across an entire school district over the 6 years prior to testing. Further, the district fixed-effects we include likely capture any differences in average ambient temperature between districts over the study period, and the year fixed-effects control for any significant changes in average 6-year temperature within districts, to the extent that annual temperature changes across the state are correlated.
xi.
xii.
The STATA fixed-effects panel data command of xtreg internally includes these school-district-specific controls.
xiii.
The SEDA dataset includes a geographic classification for all California school districts by 55 counties, 37 metropolitan areas, and 16 commute zones.
xiv.
The quintile regression uses dummy variables representing each 20% portion of the PM 2.5 concentration distribution as explanatory variables, with the first quintile (ie, the lowest PM 2.5 exposure) as the omitted category.
xv.
Donkelaar et al 54 also examine the evolving chemical composition of PM 2.5 in North America from 2000 to 2016, amidst an overall decline in average concentrations across the continent.
xvi.
Families at different income or education levels may also sort away (or toward) areas with elevated pollution levels due to housing prices or economic opportunities. We do not have data on student tenure in a district or any other indicators of how in-state migration patterns may correlate with ambient PM 2.5 concentrations. However, since PM 2.5 levels are known to correlate strongly with income, we included several different socioeconomic control variables to increase the reader’s confidence that our results are robust to these potentially confounding factors both between districts and within districts over the study period.
xvii.
Possible examples of localized idiosyncratic factors that could influence academic performance and PM 2.5 levels—that socioeconomic control variables or district fixed effects may not fully capture—could include destructive wildfires, local government initiatives, or changes in local industrial activity. While wildfires that produce detectable changes in ambient PM 2.5 occur in California every year, there are limited instances of destructive wildfires that produced significant local economic harm or distruption of day-to-day living during our timeframe of analysis (note that the Camp Fire in Butte County occurred in November 2018, while California standardized testing occurred in the Spring). We are unaware of specific local factors beyond our control variables that may correlate with PM 2.5 exposure during the study period. Still, our paper reflects an assumption that PM 2.5 variation within districts is exogenous to factors (other than the control variables) that affect student test performance, which may not be true in all instances.
xviii.
To facilitate taking the natural log while preserving the distance between data points, we used the SEDA CS values with a constant addition so that all values are positive.
xix.
We also tried interacting the PM 2.5 explanatory variable included in the regression with four different dummy variables measuring whether the average district air pollution level is in the second, third, fourth, or fifth quintile of observed exposure. This would allow for the measured marginal influence of PM 2.5 on grade-level equivalence to vary by the magnitude of the exposure, like Pham and Roach. 44 We do not report these results due to their statistical insignificance.
xx.
Mohai et al. (2011) test only 1 year of data and did not include school or district-fixed effects. Pham and Roach 44 conduct a quintile regression trial with multiple years of data and fixed effects.
xxi.
The quintile regression contains the same suite of control variables as the linear regression trials.
xxii.
Per these assumptions, students included in Gilraine
32
experienced 0.73 µg/m3 of PM 2.5 exposure at school and 7.33 µg/m3 away from school. This equates to an average reduction of 6.6 µg/m3 during the 18% of the week spent in the classroom (or an average weekly reduction of 1.2 µg/m3). Per our preferred linear regression specification coefficient for overall test scores in Table 4, we expect a corresponding improvement of 0.16 standard deviations from this level of PM 2.5 mitigation. Suppose we instead apply the quintile regression results (![]() ). In that case, we find a somewhat smaller overall test score improvement of 0.12 standard deviations, as the schools included in Gilraine
32
would move from the second quintile of PM 2.5 exposure pre-treatment to the lowest quintile post-treatment.
). In that case, we find a somewhat smaller overall test score improvement of 0.12 standard deviations, as the schools included in Gilraine
32
would move from the second quintile of PM 2.5 exposure pre-treatment to the lowest quintile post-treatment.
xxiii.
Stafford’s 55 finding that school retrofits to improve ventilation increased test scores by 0.07 to 0.11 standard deviations and that this educational benefit is more cost-effective than other common interventions, such as class-size reductions, is also relevant.
xxiv.
Similarly, in a meta-analysis of 652 global cities, Liu et al 56 find that the general association between PM 2.5 concentration and mortality is more potent at lower concentrations and levels off as concentrations increase.
xxv.
Mullen et al. (2020) measure the impact on test scores from the peak PM 2.5 days experienced throughout the school year.