
Abstract
Particulate matter (PM) exposure is associated with adverse health outcomes, including respiratory illness. A large fraction of exposure to airborne contaminants occurs in the home. This study, conducted over 5 months in a community with high asthma rates (Chelsea, MA, USA), investigated the use of portable air cleaners (PACs) to reduce indoor PM. Seven asthma-affected households participated, receiving a PAC (Austin Air Health Mate HEPA filter), a QuantAQ sensor to measure PM1, PM2.5, PM10 (µg/m3), and a HOBO plug-load data logger to track PAC usage. Results describe hourly and daily PM concentrations and PAC usage for each household. Hourly average PM concentrations decreased when PACs were turned on (vs. when they were turned off) across households during the study period: PM1 decreased by 0.46 µg/m3, PM2.5 decreased by 0.69 µg/m3, and PM10 decreased by 3.22 µg/m3. PAC usage varied for each household, including constant usage in one household and only usage at certain times of day in others. Higher filtration settings led to lower PM, with significant reductions in some, but not all, homes. Our findings highlight some difficulties in implementing household PAC interventions, yet also provide evidence to support household-level interventions to reduce PM and other indoor sources of air pollution. We also highlight academic-community partnerships as contributing to evidence-based solutions.
Keywords
Introduction
The human health impacts of exposure to particulate matter are well documented: elevated concentrations are associated with the development of respiratory diseases (eg, asthma, chronic obstructive pulmonary disease), cardiovascular diseases, and cancers. 1 Vulnerable subgroups include children, the elderly, or people with pre-existing medical conditions. Additionally, lower-income and communities of color experience higher air pollution exposure and associated health impacts.2,3 In the United States, people spend approximately 87% of their time indoors; a large fraction of a person’s daily (non-occupational) exposure to airborne contaminants occurs indoors at home. 4 Residential indoor air quality is made worse by infiltration of contaminants emitted from outdoor sources (eg, traffic), and lack of dilution of contaminants emitted from indoor sources (eg, gas stoves).5,6 Dilution of indoor air via ventilation is a common and effective method for improving indoor air quality, however, many older homes lack appropriate mechanical ventilation.7,8
Portable air cleaners (PACs) provide a first-order exposure reduction strategy by filtering particulate matter (PM) from indoor air. The improvement in indoor air quality at home can reduce overall exposures to airborne contaminants, which can subsequently reduce adverse health impacts among residents.9 -12 Some studies of PAC installation in homes have observed a 50% to 90% reduction in PM concentrations.13 -24 Particles of different size (diameters of 0.3-1 µm, 1-2.5 µm, 2.5-10 µm) are associated with differing capture efficiencies by residential PAC, 25 emphasizing the need to measure particles across various size fractions during PAC interventions. Overall, there is limited research examining multiple sizes of PM (PM1, PM2.5, PM10 ) at high measurement resolutions, and using high quality HEPA filters with multiple power levels. Many of these studies are also days to weeks in duration.22,26
Few studies have investigated PAC applicability in low-income and vulnerable settings, which may present additional challenges such as study acceptability or concerns about the cost of electricity use.13,27 -29 Behavioral habits modify associations between PAC efficacy and health impacts, including use of various air contaminant sources (eg, stoves, incense, or candles), the presence of other airborne irritants (eg, pet dander, pollen, and mold), and ventilation actions (eg, opening windows).27,28 Additionally, barriers to equitable and effective implementation of PACs include the cost to purchase and maintain a PAC. 27
Acknowledging these challenges, this study leveraged a community-academic partnership to examine the impact of PAC usage on indoor PM1, PM2.5, and PM10 concentrations over 5 months. Researchers at Boston University School of Public Health (BUSPH) partnered with staff at GreenRoots, Inc, a grassroots environmental justice organization in the City of Chelsea, Massachusetts (MA) with a long history of exposure reduction campaigns among Chelsea’s most vulnerable residents. Chelsea is one of the most environmentally overburdened cities in Massachusetts with statistically significantly higher asthma hospitalization rates compared with the state.30,31 After receiving funds via a legal settlement to improve indoor air quality for Chelsea residents, GreenRoots prioritized distribution of PACs to assist low-income tenants while indoors during the beginning of the Coronavirus Disease 2019 (COVID-19) pandemic.
GreenRoots and BUSPH launched this pilot with 2 objectives: (1) engage with residents to examine facilitators and barriers to PAC usage in homes of some of Chelsea’s most vulnerable residents, and (2) measure PAC usage and related pre- and post-PAC PM concentrations. Our overall goal was to investigate the utility of PACs as a potential air quality improvement strategy in this EJ community. This small-scale study was also a starting point for future potential air quality intervention efforts by BUSPH and GreenRoots.
Materials and Methods
Recruitment
Eligibility criteria for participants included: a self-reported non-smoking household; having lived least 1 year, currently living, and planning to live until at least 09/22/2023 in Chelsea; and the ability to read and write in English or Spanish. We initially recruited only households with at least 1 child (<18 years of age) and 1 adult (>18 years of age) with a diagnosis of asthma living together. After difficulty recruiting enough adult-child pairs, we expanded eligibility criteria to households with at least 1 adult (>18 years old) with a diagnosis of asthma.
Participant recruitment in English and Spanish began on March 1, 2022, and ended on July 1, 2022. GreenRoots’ staff shared recruitment flyers on social media and posted throughout Chelsea on telephone poles, community boards, and in the public library (Figure S2). GreenRoots staff also discussed the study at in-person meetings and in one-on-one conversations with potentially eligible residents. Healthcare partners also distributed these materials at the Massachusetts General Hospital Chelsea Health Care Center. The study recruitment process occurred as follows: Residents called GreenRoots if interested in participating and were screened via a short series of eligibility questions. Once eligible, participants verbally provided informed consent via phone with a research team member, answered a baseline demographic and health questionnaire, and scheduled monitoring equipment drop-off with the research team (Supplemental Material S4). Phone screening and initial home visits began in May 2022 and ended in July 2022. Participants were compensated for their time, provided financial support for electricity costs, and could keep their PAC after study completion. We also developed report-back materials for both GreenRoots (Supplemental Material S5) and individual participants (in-progress). Interested individuals also were given an educational infographic on PM, sources of PM, and HEPA filters (Figure S3). This study was reviewed, approved, and qualified for an exemption determination under category 13 by Boston University Medical Campus Institutional Review Board (IRB# H-42204).
Data sources
Following recruitment and during study equipment drop-off at participant homes, a baseline Asthma Control Test (ACT) was administered by a research team member. The ACT, used to assess asthma symptoms, asthma symptom severity, and for overall viability as a data collection mechanism, 32 was validated in English and Spanish (Supplemental Material S4). 33 Each subsequent month, a research team member would call participants to administer a follow-up ACT over the phone. Participants were given the option to self-administer the ACT by email link but they unanimously opted for a research staff to contact them by phone.
QuantAQ MODULAIR-PM air quality sensors measured PM (PM1, PM2.5, PM10 in µg/m3), temperature (ºF), and relative humidity (%) at a 1-minute resolution. The MODULAIR-PM is a professional-grade sensor that uses multiple light scattering-based particle sensors to collect PM values every 5 s, after which values are averaged, corrected, and sent to a cloud storage base managed by QuantAQ. 34 QuantAQ has conducted co-location tests to ensure calibration and comparability to research and/or regulatory grade instruments. 35 Data corrections include mathematical corrections for aerosol physiochemical properties (aerosol density, aspiration efficiency, and environmental factors like humidity) and can be found in the cited QuantAQ documentation. 34 A recent paper by Yang et al. showed consistency in mass particulate concentration measurements comparing the MODULAIR-PM and a research-grade instrument. 36 Additionally, MONDULAIR-PM sensors are designed for use in temperatures between -4 and 122ºF, and relative humidity from 5% to 95%; our study environments were well within these ranges. Previous studies confirm that the ability of similar sensor technology to accurately measure particle size distribution is not significantly impacted by relative humidity or other exposures. 37
Austin Air High Efficiency Particulate Air HealthMates (AAHMs) were selected as PACs for this study. The High Efficiency Particulate Air (HEPA) filters used in AAHMs consists of a medical grade, carbon blend that removes approximately 99% of all airborne contaminants at or greater than 0.1 μm. 38 The AAHMs function at 3 different power levels defined by cubic feet of air filtered per minute (CFM) (1 = 75 CFM, 2 = 250 CFM, 3 = 400 CFM). 38 Manufacturers guarantee a working life of 5 years; PACs were not replaced during the study period. 38
Honest Observer by Onset (HOBO) Plug Load data loggers (UX120-018) were used to measure the electrical current of the PAC to monitor when they were turned off, on, or changed power level. HOBO data loggers are widely used in indoor and outdoor settings. 39 All sensors were installed in one room in each participant’s household. Across homes, participants chose the location of the sensors and PAC where they were least likely to disturb living arrangements. All participants chose to place their MODULAIR-PM, PAC, and HOBO in their living room; however, one participant later chose to place the PAC in their bedroom. In-person visits and phone calls to assess and troubleshoot technological issues related to sensors occurred throughout the study period. We also downloaded publicly available mean hourly outdoor PM data from a United States Environmental Protection Agency (US EPA) federal reference monitor in Chelsea, MA, as well as mean hourly outdoor temperature data from the National Weather Service monitor in East Boston (bordering Chelsea) to compare to our indoor data values.
We initially sought to recruit adult-child pairs. After 1 month, we changed our eligibility criteria and adjusted our study design to maximize the amount of time that PACs were present in participant households rather than measuring indoor PM prior to installation. Participants recruited in May had 1 month of baseline PM measurements recorded by their air quality monitor prior to PAC installation, while participants recruited in June and July did not have baseline PM measurements prior to PAC installation. Rather, the air quality monitor and PAC were installed simultaneously. In every home, data were recorded for a minimum of 3 months, and maximum of 5 months (5 months for 2 participants, 4 months for 1 participant, and 3 months for 4 participants).
Data were downloaded and cleaned using R (Version 4.0.2). We conducted descriptive analyses of PM, PAC usage, temperature, and relative humidity, including exposure patterns, time series, summary statistics, and correlations for each participant and in aggregate. The distribution of PM data were left skewed, as is the case for many environmental exposure datasets. 40 Consequently, we calculated overall and monthly outdoor and indoor geometric mean concentrations of PM1, PM2.5, and PM10 prior to PAC installation, while PACs were on, and while PACs were turned off. We created boxplots to further explore PM concentrations when PACs were turned on or off, identifying 50th percentile (median) of PM concentration and 25th and 75th PM concentration percentiles. We designated statistical significance at P < .05 for difference in PM concentration when the PAC is turned on (PAC On) versus turned off (PAC Off). Significance levels were determined using Welch’s T Tests. We also explored different usage profiles for individual participants (ie, a typical PM exposure pattern during a day when the PAC was on vs. off) by calculating percent of the time a PAC was on during the night (9:00 pm-3:00 am), morning (3:00 am-9:00 am), day (9:00 am-3:00 pm), and evening (3:00 pm-9:00 pm).
Finally, we developed a suite of regression models to examine the association between PAC usage and PM concentrations in participant households. Separate models were fit with hourly mean, 50th and 90th percentile PM (PM1, PM2.5, and PM10) as the outcome variable. Our main predictor variable of interest was hourly PAC usage, which we modeled using a binary or continuous variable of PAC CFM. The binary representation of PAC usage, FilterCFM, was defined as 0 if PAC was off during an hour, or 1 if PAC were on at any point in an hour. The continuous FilterCFM variable was the time-weighted average of the PAC running at filtration levels 1, 2, and 3. 38 We also compared the impact of PAC usage at various levels (PAC on at level 1 vs. PAC on at level 3) on average PM concentrations. Changes in PM at different percentiles (50th and 90th) PM was modeled using quantile regression models in the quantreg package in R. 41 In each model, we adjusted for hour (hour as 0-23), weekend (weekend or weekday), month (month as 1-12), federal holidays (holiday or no holiday as 1 or 0), indoor temperature (°F), indoor relative humidity (%), and household. Our final regression equation is shown below.

We also performed the following secondary analyses: comparing difference in PM concentrations between a PAC turned off and pre-PAC installation, incorporating FilterCFM as a continuous variable, and excluding outdoor air pollution from our model (Table S4).41,42 Sensitivity analyses included integrating a lagged variable in the original model and exploring correlations between temperature and PM.
Results
Seven households were recruited and completed the study: 5 households were recruited in May, one household was recruited in June, and one household was recruited in July. All households had at least one adult and one child with an asthma diagnosis. An additional participant was recruited but exited the study due to unanticipated travel requiring they be away from home for long durations. Most participants conducted the study in Spanish; and one participant in English. Reported motivations for participating in the study included a desire to learn more about asthma triggers and improve asthma control, concern for children and/or other family members with asthma, and a desire to support community environmental health efforts. Participant households were primarily apartments in multi-family homes.
Asthma symptoms collected from ACTs included wheezing, coughing, shortness of breath, chest tightness or pain waking them up at night or earlier than usual in the morning an average of 1 to 2 times overall, and up to an average of 4 nights per week. A rescue inhaler or nebulizer medication was used on average once a week or less, and up to an average of 1 to 2 times per day. Overall, participants rated their asthma as somewhat controlled (86%), or well controlled (14%) during the entire study period. Table 1 summarizes participant characteristics.
Summary of participant characteristics.

Participant dropped out.
Descriptive results: PAC usage and PM concentration
Comparison of exposure metrics showed a range of PM concentrations in the indoor environment. Overall hourly geometric mean indoor pre-PAC concentrations were 2.73 µg/m3 (SD: 0.53), 3.80 µg/m3 (SD: 0.39), and 9.76 µg/m3 (SD: 0.64) for PM1, PM2.5, and PM10, respectively (Table 2). Hourly geometric mean outdoor PM2.5 concentrations ranged from 6.0 (SD: 3.0) to 8.6 µg/m3 (SD: 3.4) throughout the entire study period, while hourly geometric mean indoor PM2.5 concentrations ranged from 3.6 (SD: 5.7) to 4.8 µg/m3 (SD: 11.7), with considerably greater variability than outdoor concentrations (Table 2). Overall, outdoor and indoor PM2.5 concentrations significantly differed throughout the entire study period: hourly geometric mean indoor PM2.5 concentrations were 2.25 µg/m3 greater than outdoor concentrations (P < .05 with 95% CI: 2.42, 2.08) (Table 2).
Overall and monthly geometric mean hourly indoor/outdoor PM1, PM2.5, PM10 µg/m3.
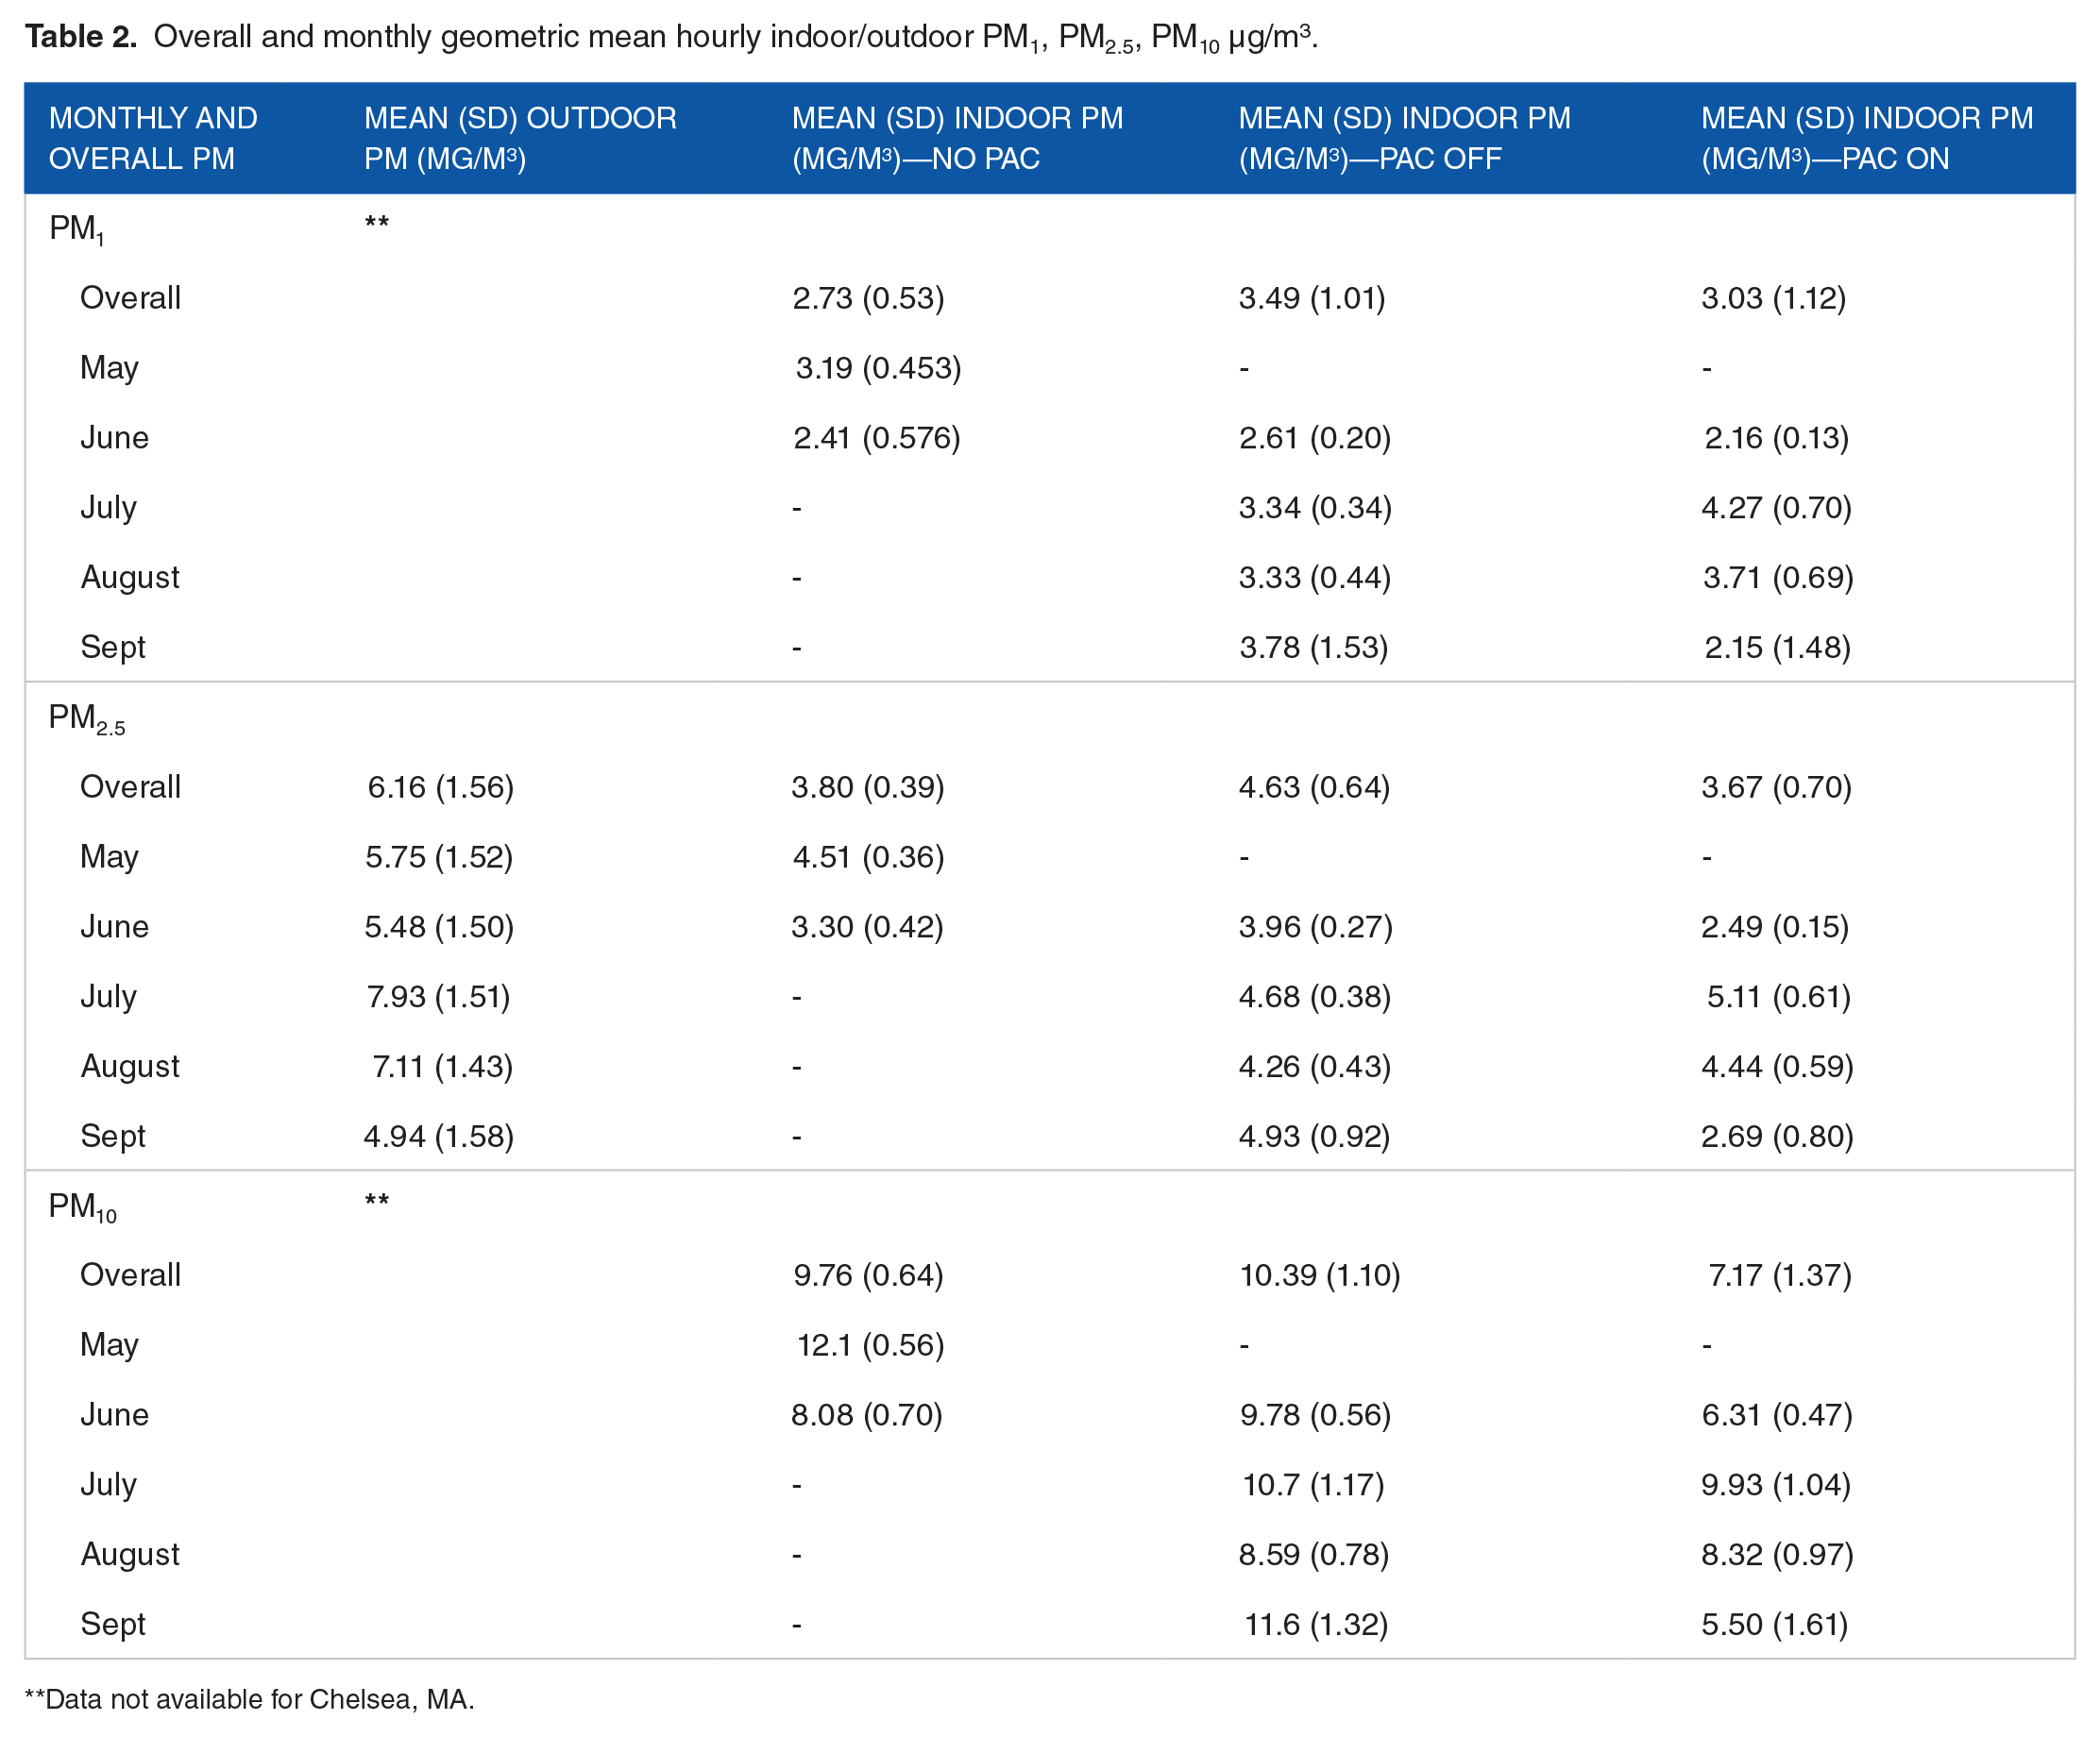
Data not available for Chelsea, MA.
Once PACs were installed and turned on in participant households, we observed a slight decreasing though variable trend in hourly geometric mean PM concentrations (Table 2). Specifically, overall PM1 concentrations decreased from 3.49 (SD: 1.01) to 3.03 µg/m3 (SD: 1.12) once PACs were turned on. For PM2.5, we saw an overall decrease from 4.36 (SD: 0.64) to 3.67 µg/m3 (SD: 0.70), and an overall decrease from 10.39 (SD: 1.10) to 7.17 µg/m3 (SD: 1.37) for PM10. In other words, once PACs were turned on (vs. turned off), we saw an overall decrease of 0.46, 0.69, and 3.22 µg/m3 for PM1, PM2.5, and PM10 respectively. Across the entire study period and within each month, we see a consistent trend of greater PAC efficiency for reducing PM concentrations for larger PM size (PM10) versus smaller PM size (PM1) (Table 2).
Examining monthly geometric means in Table 2, we see similar trends, however, PM either stays the same or slightly increases in certain months (ie, July and August for PM1 and PM2.5) which may be attributed to highly variable usage patterns (Figure S1), or other factors that determine PM concentrations (eg, varying emissions from indoor/outdoor sources and differing patterns of ventilation). We also observed similar trends when considering overall PM and trends at the individual level (Table S2 and S3).
Changes in PAC impact were also observed at different time periods throughout the day (Figure 1). During four 6-h time periods (night, morning, day, and evening), PAC usage patterns (PAC turned on and PAC turned off) and corresponding PM concentrations showed a consistent trend. PM concentrations decreased when PACs were turned on (blue), versus when they were off (white) across all time periods. These decreases were significant across all PM types and all time periods except for evening. Overall, median PM was highest when PACs were turned off across PM1, PM2.5, and PM10 concentrations and time periods.
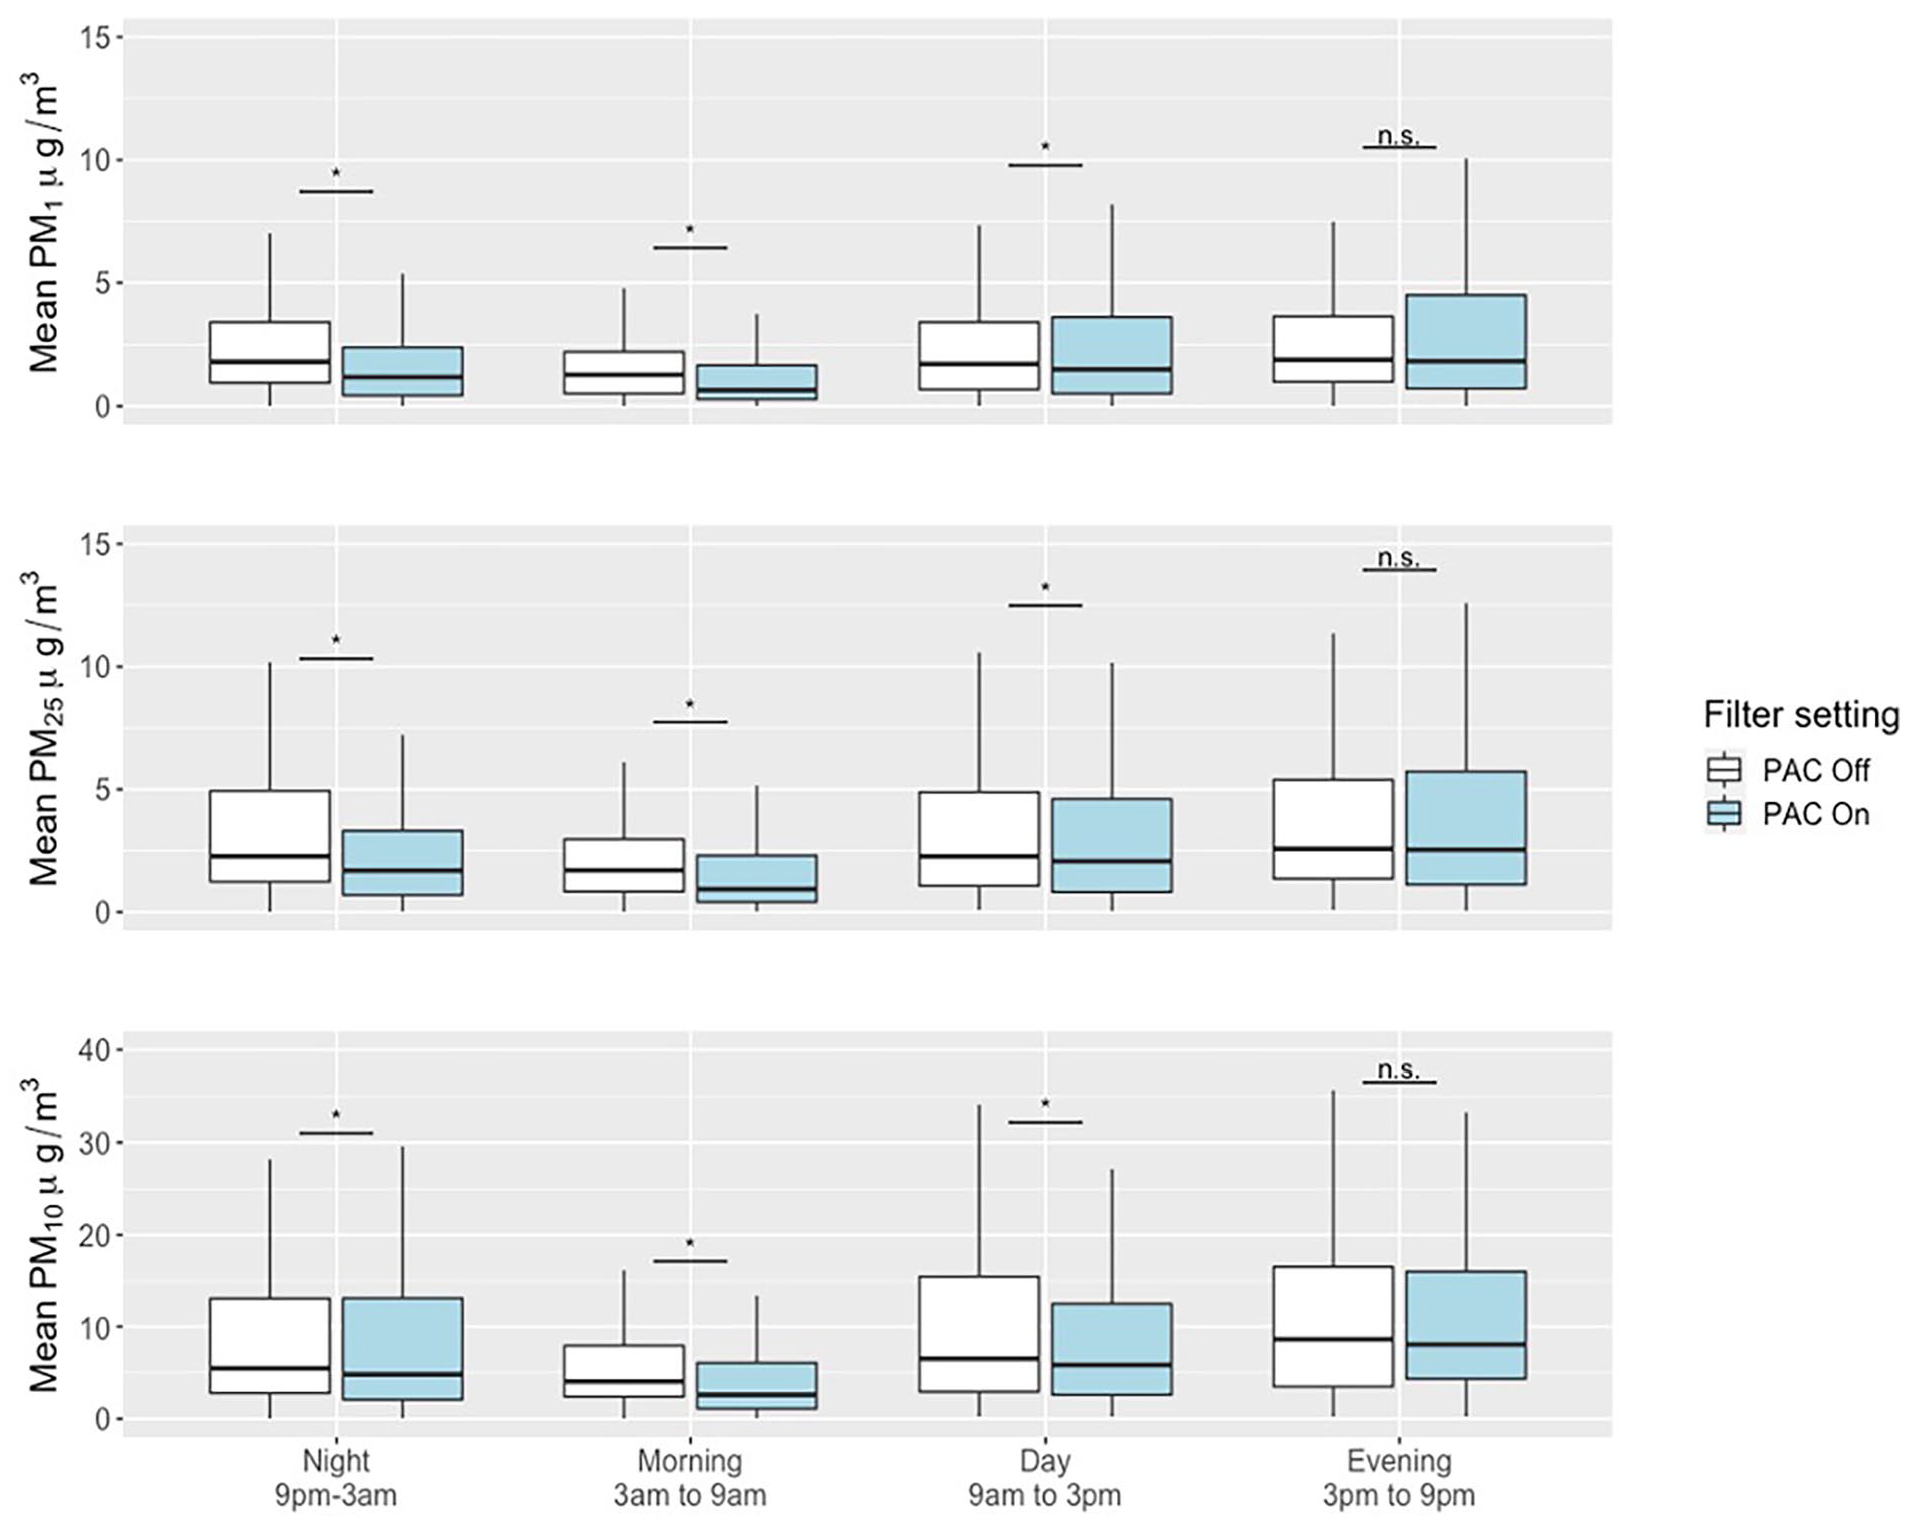
PM concentrations and PAC usage for key time periods.
We see that during the night, morning, and day periods, PM concentrations across all PM types significantly decrease when PACs are turned on. Moreover, we confirmed varying patterns of PAC use for each household (Figure in S3 Figure); this illustrated the variability both between time periods, and between households. One household (P1) used the PAC the most during the 3:00 pm to 9:00 pm time block, and one household (P8) kept the PAC on throughout the entire study period. Overall, daily average PAC use, expressed as how much air was filtered in cubic feet per minute (CFM), ranged from 24.4 to 35.2 CFM.
To include a broader picture of participant household environment and inform an interest fin indoor heat exposure, we analyzed temperature and humidity as recorded by MODULAIR-PM monitors. Mean hourly household indoor temperatures ranged from 75.0 to 80.8°F during the study period, and maximum hourly temperatures ranged from 87.1 to 98.3°F (Table S2). According to the American Society of Heating, Refrigerating and Air-Conditioning Engineers (ASHRAE) guidelines, comfortable indoor temperatures should be no higher than 80°F in summer months. 43 Overall mean indoor relative humidity was reported as 47.4%, while overall mean outdoor relative humidity was recorded as 68.8% (Table S2).
Regression results: PAC usage associated with reductions in PM
Our regression model aimed to relate PAC usage to PM concentrations in participant households, adjusting for time trends (hour, weekday vs. weekend, month, federal holiday), temperature, relative humidity, and outdoor PM. As shown in Table 3, we see several trends when using various regression models including comparing PAC on versus off (PM concentrations at a 50th percentile and 90th percentile) and PAC on level 3 versus level 1. Across all models, mean PM differences significantly decreased when PACs were used versus when they were not used (−0.37, −0.64, and −3.34 µg/m3 for PM1, PM2.5, and PM10, respectively). Additionally, this trend in mean PM differences was greater in magnitude when using the 90th percentile of all PM concentrations compared to 50th percentile concentrations (−0.80 vs. −0.24, −1.27 vs. −0.43, 3.81 vs. −1.03 µg/m3 for PM1, PM2.5, and PM10, respectively. We also observed higher PAC efficiency at removing larger PM particles: the mean difference in PM concentrations for all PM sizes also decreased more when PACs were on a higher air filtration setting at level 3 compared to a lower filtration rate at level 1 (−2.20, −2.25, and −4.44 for PM1, PM2.5, and PM10, respectively). Our models were robust regarding the inclusion of secondary and sensitivity analyses (Table S3).
Regression outputs (mean difference of PM in µg/m3 with 95% CI).

Implementation challenges and feasibility
We faced implementation challenges at the study outset and throughout the study duration. First, participants opted for a study staff member to call and verbally conduct an ACT versus completing an internet-based ACT survey; our study team had to ensure time and availability to do so. Technical challenges among 3 participants included: limited electrical outlets in the household to keep sensors running consistently, difficulty with equipment replacement and/or troubleshooting, household electrical cords and/or outlets failing or short-circuiting, and unexpected participant absences. To remedy these issues in real-time, the study team bought a power strip for one participant who needed more outlet access, made various phone calls and in-person visits to repair sensors and PACs, replaced electrical cordage, and attempted to stay in contact with participants whose schedules made it difficult for them to follow through with the study protocol.
Discussion
We observed a decreasing, though highly variable trend in PM concentrations for all PM types across the entire study period. Specifically, the decrease of hourly geometric mean PM2.5 concentrations across households ranged from 0.02 to 1.57 µg/m3 comparing pre- and post-PAC concentrations (approximately a 1%-12% change). Variability was high for all pre- and post-PAC PM concentrations. Changes in PAC impact were observed at different time periods throughout the day, indicating that usage and level of the PAC were non-constant. For example, one participant used their PAC constantly throughout the study, while another participant only used their PAC during nighttime hours. In our multivariate regression modeling, we found small but significant decreases in PM during hours when PACs were used. These decreases varied by PM size, with higher PAC efficiency occurring for larger particle sizes (PM10). We also observed higher PAC efficiency when a higher air filtration rate, or turning the PAC setting to level three, was used. These results suggest that even though we employed PACs with a high-quality HEPA filter, there are additional influences causing lower efficiencies for particle removal. We demonstrated PAC efficacy, albeit high variability in PAC usage.
Comparison to the literature
This is one of few studies exploring PAC usage and PM exposure in environmental justice populations with pre-existing respiratory conditions. Thus, we compared our findings to the broader literature, which varies substantially in terms of study location, background exposure levels, PM source(s) of interest, study design, monitor type, level of community engagement, and/or intervention goals. Our findings, showing a small but significant decrease in PM while PACs were in use, are consistent with a number of studies.13 -24,27 However, the association between PAC usage and reduced PM exposure among environmental justice populations remains unclear.22,26,29,44 Of the existing studies, one published in 2013 included residents in Chelsea, MA. 22 Researchers aimed to better understand the impact of PAC use on ultrafine particle number concentrations (PNCs) and inflammation in a previously established Puerto Rican older-adult cohort. 22 They implemented a randomized (either sham filter or HEPAiRx HEPA filter) case crossover study with a washout period for 23 households. They found that their PACs reduced PNCs by 50-85% across all households, though there was no significant relationship found between PAC use, reduced PNCs, and inflammation. 22 Another study based in Ohio examined the impact of PAC use on black carbon (BC), PM2.5, ultraviolet absorbing PM, and fungal spores in a previously established cohort of asthmatics living near highways. 21 Similar to the 2013 study in Chelsea, the project in Ohio used a case crossover design with a washout period. Researchers found that PM2.5 and BC were significantly reduced by PAC (Whirlpool Whispure HEPA filter) use. 21 Though these studies implemented experimental designs in vulnerable cohorts, they exemplify the overarching trend in the literature: methods, materials, community engagement, and definition of “vulnerable population” vary. Lastly, sham filters and/or washout periods, though more rigorous in design, may introduce hesitancy and ethical complexity among already overburdened communities. 22 GreenRoots opposed the use of sham filters and emphasized the importance of understanding the practical challenges of studying PACs in participants’ homes.
Similar to our findings, high variability in PM concentrations was also reported in many studies due to factors such as indoor-outdoor filtration, 21 with some studies citing opening and closing of windows as a major influence.28,45 The previously described 2013 study in Chelsea found that opening/closing of windows occurred more frequently during the summer season. 22 Our high variability in PM may have been influenced by unmeasured window opening/closing habits due to higher indoor temperatures during the summer season: we observed high indoor temperatures throughout the study period with indoor monthly averages ranging from 74.94 to 81.97°F, compared to cooler outdoor monthly averages ranging from 59.47 to 77.29°F.
Relatedly, general ambient PM concentrations and high PM exposure events may impact Chelsea households’ PM concentrations and the related PAC intervention impact. Specifically, areas with higher background PM levels or that experience major events like wildfires have shown a greater magnitude of effect in PAC intervention studies 14 versus locations with lower background PM levels. 46 Though it is important to acknowledge the increased exposure to air pollution sources by Chelsea residents attributed to a variety of factors including historical disinvestment in urban planning, old housing stock, high tenant occupied multi-family buildings, high residential instability, and/or economic pressures, 47 average ambient PM concentrations in Chelsea usually fell below US EPA National Ambient Air Quality Standards (NAAQS), and high pollution events rarely occur. 1 Therefore, our small but significant decrease in PM while PACs were in use may be due, in part, to the lower average ambient PM concentrations observed in Chelsea. Nevertheless, we observed many high indoor PM concentration data points that surpass both US EPA and World Health Organization regulations and recommendations.1,48
Systematic reviews of the literature exploring PAC usage, PM concentrations, and respiratory outcomes like asthma found similar results: using a PAC significantly reduced PM, though associations with a health outcome were inconsistent and mostly non-significant.21,49 However, some recent studies have shown improved health outcomes related to PAC usage.50,51 Overall, future work examining indoor air quality reduction efforts and associated health outcomes is needed in a variety of populations and settings.
Limitations
Our study had a number of limitations. We had a small number of participants, though this was intentionally a pilot study by design. We did not include a survey or other mechanism to track human activity (ie, cooking habits, opening windows) or household characteristics (ie, ventilation, room size). We also did not employ survey to record housing characteristics such as room sizes, ventilation, or indoor/outdoor sources of air pollution. Though these surveys were not possible in this pilot, we would hope to implement them if we scale-up these efforts in the future. Though QuantAQ MODULAIR-PM manufacturers outline robust methods for PM data precision and accuracy, calibration and data corrections may not fully account for in-the-field environmental factors or conditions. Our pilot study explored efficacy and feasibility of PACs; source control may ultimately actually show a greater reduction of respiratory irritants. However, this study had many strengths: we measured PM1, PM2.5, and PM10 over a long period (5 months) at a high resolution using high quality measurement technology. Through this partnership, we aimed to balance participant autonomy, and were moderately involved in participant sensor upkeep and overall communication.
Conclusions
This study leveraged an existing partnership to implement a community-centered pilot of PAC efficacy in Chelsea, MA, one of the most environmentally overburdened cities in Massachusetts. We aimed to generate a suite of methods, materials, and learnings generalizable to other community organizations looking to sustainably use PAC to improve indoor air quality. We provided bilingual science communication and education materials during recruitment. Results showed a significant decrease in PM concentrations for all PM types across the entire study period, and a small but significant decrease in PM during hours when PAC were used. Across households, usage and power level of the PAC varied. Future research and related community-engaged efforts should prioritize measuring additional pollutants, focus on source reduction in terms of home building characteristics and/or occupational settings, and better account for human behavior changes. Additionally, these efforts should build in staff time and a budget to address electrical and technical challenges of running monitors, monitoring health, and ensuring outreach and activism in both the short- and long-term.
Supplemental Material
sj-docx-1-ehi-10.1177_11786302241258587 – Supplemental material for Portable Air Cleaner Usage and Particulate Matter Exposure Reduction in an Environmental Justice Community: A Pilot Study
Supplemental material, sj-docx-1-ehi-10.1177_11786302241258587 for Portable Air Cleaner Usage and Particulate Matter Exposure Reduction in an Environmental Justice Community: A Pilot Study by Alina M McIntyre, Madeleine K Scammell, Patrick L Kinney, Kiran Khosla, Layne Benton, Roseann Bongiovanni, Jessica McCannon and Chad W Milando in Environmental Health Insights
Supplemental Material
sj-docx-2-ehi-10.1177_11786302241258587 – Supplemental material for Portable Air Cleaner Usage and Particulate Matter Exposure Reduction in an Environmental Justice Community: A Pilot Study
Supplemental material, sj-docx-2-ehi-10.1177_11786302241258587 for Portable Air Cleaner Usage and Particulate Matter Exposure Reduction in an Environmental Justice Community: A Pilot Study by Alina M McIntyre, Madeleine K Scammell, Patrick L Kinney, Kiran Khosla, Layne Benton, Roseann Bongiovanni, Jessica McCannon and Chad W Milando in Environmental Health Insights
Supplemental Material
sj-docx-3-ehi-10.1177_11786302241258587 – Supplemental material for Portable Air Cleaner Usage and Particulate Matter Exposure Reduction in an Environmental Justice Community: A Pilot Study
Supplemental material, sj-docx-3-ehi-10.1177_11786302241258587 for Portable Air Cleaner Usage and Particulate Matter Exposure Reduction in an Environmental Justice Community: A Pilot Study by Alina M McIntyre, Madeleine K Scammell, Patrick L Kinney, Kiran Khosla, Layne Benton, Roseann Bongiovanni, Jessica McCannon and Chad W Milando in Environmental Health Insights
Supplemental Material
sj-docx-4-ehi-10.1177_11786302241258587 – Supplemental material for Portable Air Cleaner Usage and Particulate Matter Exposure Reduction in an Environmental Justice Community: A Pilot Study
Supplemental material, sj-docx-4-ehi-10.1177_11786302241258587 for Portable Air Cleaner Usage and Particulate Matter Exposure Reduction in an Environmental Justice Community: A Pilot Study by Alina M McIntyre, Madeleine K Scammell, Patrick L Kinney, Kiran Khosla, Layne Benton, Roseann Bongiovanni, Jessica McCannon and Chad W Milando in Environmental Health Insights
Supplemental Material
sj-eps-5-ehi-10.1177_11786302241258587 – Supplemental material for Portable Air Cleaner Usage and Particulate Matter Exposure Reduction in an Environmental Justice Community: A Pilot Study
Supplemental material, sj-eps-5-ehi-10.1177_11786302241258587 for Portable Air Cleaner Usage and Particulate Matter Exposure Reduction in an Environmental Justice Community: A Pilot Study by Alina M McIntyre, Madeleine K Scammell, Patrick L Kinney, Kiran Khosla, Layne Benton, Roseann Bongiovanni, Jessica McCannon and Chad W Milando in Environmental Health Insights
Supplemental Material
sj-jpg-10-ehi-10.1177_11786302241258587 – Supplemental material for Portable Air Cleaner Usage and Particulate Matter Exposure Reduction in an Environmental Justice Community: A Pilot Study
Supplemental material, sj-jpg-10-ehi-10.1177_11786302241258587 for Portable Air Cleaner Usage and Particulate Matter Exposure Reduction in an Environmental Justice Community: A Pilot Study by Alina M McIntyre, Madeleine K Scammell, Patrick L Kinney, Kiran Khosla, Layne Benton, Roseann Bongiovanni, Jessica McCannon and Chad W Milando in Environmental Health Insights
Supplemental Material
sj-jpg-11-ehi-10.1177_11786302241258587 – Supplemental material for Portable Air Cleaner Usage and Particulate Matter Exposure Reduction in an Environmental Justice Community: A Pilot Study
Supplemental material, sj-jpg-11-ehi-10.1177_11786302241258587 for Portable Air Cleaner Usage and Particulate Matter Exposure Reduction in an Environmental Justice Community: A Pilot Study by Alina M McIntyre, Madeleine K Scammell, Patrick L Kinney, Kiran Khosla, Layne Benton, Roseann Bongiovanni, Jessica McCannon and Chad W Milando in Environmental Health Insights
Supplemental Material
sj-jpg-12-ehi-10.1177_11786302241258587 – Supplemental material for Portable Air Cleaner Usage and Particulate Matter Exposure Reduction in an Environmental Justice Community: A Pilot Study
Supplemental material, sj-jpg-12-ehi-10.1177_11786302241258587 for Portable Air Cleaner Usage and Particulate Matter Exposure Reduction in an Environmental Justice Community: A Pilot Study by Alina M McIntyre, Madeleine K Scammell, Patrick L Kinney, Kiran Khosla, Layne Benton, Roseann Bongiovanni, Jessica McCannon and Chad W Milando in Environmental Health Insights
Supplemental Material
sj-jpg-6-ehi-10.1177_11786302241258587 – Supplemental material for Portable Air Cleaner Usage and Particulate Matter Exposure Reduction in an Environmental Justice Community: A Pilot Study
Supplemental material, sj-jpg-6-ehi-10.1177_11786302241258587 for Portable Air Cleaner Usage and Particulate Matter Exposure Reduction in an Environmental Justice Community: A Pilot Study by Alina M McIntyre, Madeleine K Scammell, Patrick L Kinney, Kiran Khosla, Layne Benton, Roseann Bongiovanni, Jessica McCannon and Chad W Milando in Environmental Health Insights
Supplemental Material
sj-jpg-7-ehi-10.1177_11786302241258587 – Supplemental material for Portable Air Cleaner Usage and Particulate Matter Exposure Reduction in an Environmental Justice Community: A Pilot Study
Supplemental material, sj-jpg-7-ehi-10.1177_11786302241258587 for Portable Air Cleaner Usage and Particulate Matter Exposure Reduction in an Environmental Justice Community: A Pilot Study by Alina M McIntyre, Madeleine K Scammell, Patrick L Kinney, Kiran Khosla, Layne Benton, Roseann Bongiovanni, Jessica McCannon and Chad W Milando in Environmental Health Insights
Supplemental Material
sj-jpg-8-ehi-10.1177_11786302241258587 – Supplemental material for Portable Air Cleaner Usage and Particulate Matter Exposure Reduction in an Environmental Justice Community: A Pilot Study
Supplemental material, sj-jpg-8-ehi-10.1177_11786302241258587 for Portable Air Cleaner Usage and Particulate Matter Exposure Reduction in an Environmental Justice Community: A Pilot Study by Alina M McIntyre, Madeleine K Scammell, Patrick L Kinney, Kiran Khosla, Layne Benton, Roseann Bongiovanni, Jessica McCannon and Chad W Milando in Environmental Health Insights
Supplemental Material
sj-jpg-9-ehi-10.1177_11786302241258587 – Supplemental material for Portable Air Cleaner Usage and Particulate Matter Exposure Reduction in an Environmental Justice Community: A Pilot Study
Supplemental material, sj-jpg-9-ehi-10.1177_11786302241258587 for Portable Air Cleaner Usage and Particulate Matter Exposure Reduction in an Environmental Justice Community: A Pilot Study by Alina M McIntyre, Madeleine K Scammell, Patrick L Kinney, Kiran Khosla, Layne Benton, Roseann Bongiovanni, Jessica McCannon and Chad W Milando in Environmental Health Insights
Footnotes
Acknowledgements
We thank our extended community at BUSPH, GreenRoots, and MGH for their continued support. We also express our gratitude to the study participants.
Funding:
The author(s) disclosed receipt of the following financial support for the research, authorship, and/or publication of this article: This study was supported by a National Institute for Environmental Health Sciences (NIEHS)/National Institutes of Health (NIH) grant to Boston University School of Public Health (T32ES014562), and an Established Investigator Innovation Award through Boston University School of Public Health.
Declaration of Conflicting Interests:
The author(s) declared no potential conflicts of interest with respect to the research, authorship, and/or publication of this article.
Author Contribution
Conceptualization: CM, MLS, RB; Funding Aquisition: CM, RB, MLS, PLK; Data Curation: CM, LB, KK, JM; Investigation: AMM, CM, LB, KK; Methodology: CM, AMM, MLS, PLK, RB, JM; Formal Analysis: CM, AMM; Writing – original draft: AM; Writing – review & editing: AMM, CM, MLS, PLK, LB, KK, RB, JM.
Supplemental Material
Supplemental material for this article is available online.
References
Supplementary Material
Please find the following supplemental material available below.
For Open Access articles published under a Creative Commons License, all supplemental material carries the same license as the article it is associated with.
For non-Open Access articles published, all supplemental material carries a non-exclusive license, and permission requests for re-use of supplemental material or any part of supplemental material shall be sent directly to the copyright owner as specified in the copyright notice associated with the article.