
Abstract
Lebanon’s prolonged economic collapse has fundamentally altered the functioning of its water and energy service systems, exposing deep spatial inequalities and accelerating shifts in resource provisioning. Drawing on municipal-level data from 150 municipalities across nine governorates for pre-crisis (2019) and crisis period (2023) conditions, this study examines how the crisis reshaped domestic, industrial, and total water supply; energy use for water extraction and distribution; and the adoption of decentralized renewable technologies. Through an integrated statistical analysis, we identify marked regional disparities, with Akkar experiencing the steepest declines in water supply and Baalbek-Hermel retaining comparatively higher domestic availability. A small set of municipalities, including Tripoli and Qaa, consistently emerge as extreme outliers, underscoring the need for highly localized rather than uniform national interventions. The results also reveal a rapid transition toward decentralized resilience: solar photovoltaic systems and solar water heaters have become increasingly central to sustaining water services amid grid failure and rising diesel costs. Demographic dynamics play differentiated roles, with Lebanese population pressures closely linked to industrial water demand, while refugee presence correlates with domestic supply patterns shaped by humanitarian support. By linking these crisis-period transformations to SDG 6 (clean water) and SDG 7 (clean energy), the study contributes rare empirical evidence on how economic freefall restructures water and energy systems and identifies concrete entry points for adaptive, spatially differentiated governance.
Introduction
Since October 2019, Lebanon has faced a multifaceted and prolonged crisis that has plunged the nation into severe economic and financial turmoil. Rapid currency devaluation, sovereign debt default, the COVID-19 pandemic, socio-political instability, the 2020 Beirut port explosion, and regional conflicts have collectively devastated national infrastructure and essential services. Among the most severely affected sectors is the water-energy nexus, where the deep interdependence of water and energy systems amplifies vulnerabilities (World Bank, 2021). Escalating costs of extraction, treatment, and distribution, combined with increasingly unreliable supply, have intensified pressure on Lebanon’s already fragile water resources (Fayssal et al., 2024).
Lebanon’s water and electricity sectors were characterized by inefficiencies and dependence on a centralized public-utility model. In response to chronic power shortages and the state’s inability to deliver reliable services, residents increasingly turned to expensive, privately owned diesel generators to meet basic electricity needs (Badra, 2022; Dagher & Ruble, 2011). This shift has, in turn, catalyzed rapid growth in decentralized renewable energy solutions, particularly solar photovoltaic (PV) systems, as households and businesses seek alternative means of powering water extraction and distribution. Although primarily driven by necessity, this transition presents both opportunities and challenges for building a more sustainable and resilient water-energy system.
A growing body of research underscores the interconnection of water and energy systems. The water-energy-food (WEF) nexus framework highlights the reciprocal relationships between energy requirements for water extraction, treatment, distribution, and water needs for energy production (Li et al., 2025). Nexus-based analyses have become essential for understanding service vulnerabilities and designing integrated resource strategies. Recent advancements further propose basin-scale resilience frameworks that incorporate adaptive governance, decentralized renewable energy adoption, and cross-sectoral planning (Li et al., 2025). These models emphasize not only resource interdependence but also the capacity of systems to absorb, adapt, and reorganize during prolonged crises, a concept increasingly relevant in fragile states.
Extensive literature on the water-energy nexus in the Middle East and North Africa (MENA) emphasizes the structural interdependence between energy-intensive water services, chronic governance deficits, and uneven infrastructure investment (Jägerskog et al., 2018; Maftouh et al., 2022; Siddiqi & Anadon, 2011; Weinthal & Sowers, 2020), while regional energy policy assessments highlight the persistence of centralized, inefficient utility models and delayed reform across the region (Griffiths, 2017; Tazikeh et al., 2025). At the same time, regional outlooks point to a rapid shift toward decentralized renewable energy as a coping and resilience strategy amid grid instability, fuel price volatility, and climate risk (International Energy Agency [IEA], 2024, 2025; IRENA, 2025), a trend already identified in pre-crisis evaluations of Lebanon’s renewable energy potential (El Chaar et al., 2021). By statistically documenting how these dynamics manifest unevenly across municipalities, and by situating the findings within regional SDG trajectories that reveal widening spatial and social disparities (Mfarrej, 2025; United Nations, 2021), the study bridges macro-level nexus theory with localized evidence, reinforcing recent arguments that Lebanon’s water-energy-food system represents a critical case of compounded vulnerability requiring spatially differentiated and resilience-oriented governance (Daher et al., 2022).
In Lebanon, empirical nexus research has examined formal and informal water systems and coping arrangements at the local level (Choueiri et al., 2022) alongside extensive documentation of chronic electricity shortages. However, few studies have evaluated how the economic collapse has reshaped the structure of the nexus itself. This gap is highlighted in the World Bank assessments of national economic conditions and broader MENA water security challenges (World Bank, 2023, n.d.).
This article responds directly to longstanding calls for empirically grounded, subnational analyses of water-energy systems under conditions of economic fragility and institutional stress.
In this study, resilience is understood as the capacity of municipal water and energy service systems to maintain or rapidly restore basic service levels under severe economic stress, and to adapt through infrastructural, institutional, and socio-economic adjustments such as diversifying supply sources and deploying decentralized renewable technologies. Most existing contributions on Lebanon’s water-energy nexus focus either on pre-crisis sectoral inefficiencies, electricity scenarios, or urban water systems. While the work of Fayssal et al. (2024) provides an important descriptive overview based on a nationwide survey of 150 municipalities, their analysis primarily reports changes in selected indicators rather than exploiting the full multivariate structure of the dataset or systematically examining how demographic and regional characteristics jointly shape water access, energy use for water services, and renewable energy uptake.
The present study advances literature in three main ways. First, it applies an integrated multivariate statistical framework, including comparative models, dimension-reduction, clustering, and regression, to uncover latent structures, municipal typologies, and outlier profiles that are not visible in univariate summaries. Second, it explicitly operationalizes a multi-dimensional notion of water-energy resilience at the municipal scale, distinguishing infrastructural resilience (ability to maintain or recover water provision), institutional resilience (local authorities’ capacity to adapt service arrangements), and socio-economic resilience (households’ and businesses’ ability to secure services via alternative technologies and providers). Third, it provides governorate-level and municipality-level comparisons that quantify spatial inequalities in water availability and crisis-induced shifts toward decentralized solar solutions, thereby generating evidence directly relevant to SDG 6 and SDG 7.
Consequently, the study addresses the following research questions:
(1) How has Lebanon’s economic collapse reshaped domestic, industrial, and total water supply across governorates and municipalities between 2019 (pre-crisis) and 2023 (crisis period)?
(2) Which combinations of water, energy, and demographic indicators define distinct municipal profiles, and which municipalities emerge as extreme outliers requiring targeted interventions?
(3) To what extent do Lebanese and refugee populations differentially drive water demand components and crisis-period renewable energy adoption for water-related uses?
By answering these questions through a multivariate analysis strategy, the paper transcends descriptive statistics by leveraging multivariate inference to quantify spatial inequalities, identify empirically grounded typologies of municipal resilience and vulnerability, and highlight concrete entry points for resilience-oriented, spatially differentiated policies in crisis-affected water-energy systems.
Data and Measures
The empirical foundation of this study is based on primary data collected by Fayssal et al. (2024) from 150 municipalities strategically selected across Lebanon’s nine governorates. The data were gathered through face-to-face interviews with municipal officials, such as mayors, engineers, and administrative staff, conducted between February and September 2023. This focus on municipalities, rather than on individual households or national water agencies, was chosen because these local authorities play a primary role in water service provision and infrastructure management in Lebanon (Fayssal et al., 2024).
To capture the temporal evolution of water-energy dynamics, the dataset spans two distinct periods: a pre-crisis baseline (February–April 2019) and a crisis-period phase (February–April 2023). This comparative design enables the identification and quantification of changes in water and energy parameters that can be directly attributed to the economic collapse.
The collected variables provide a comprehensive picture of the water-energy system’s transformation. Specifically, the variables include: (i) weekly household water supply hours; (ii) annual water volumes (in cubic meters) sourced from both conventional sources (e.g. public networks, springs) and unconventional sources (e.g. private wells, tanker trucks); and (iii) the proportion of the population relying on tanker-delivered water, (iv) domestic, industrial and total volume of water supply (Figure 1). Additionally, data were collected on energy demand for water extraction and distribution, disaggregated by source, including public grid electricity, private diesel generators, and solar PV systems. The dataset also records the adoption rates of solar water heaters and solar PV units for general household use (Figure 2).

Average domestic water supply per governorate (Left: before crisis, Right: during crisis).

Average solar PV units per governorate (Left: before crisis, Right: during crisis).
Alignment of Variables With Sustainable Development Goals (SDG 6 and SDG 7)
The set of variables collected from municipalities was deliberately chosen to operationalize key dimensions of the sustainable development goals: SDG 6 (Clean Water and Sanitation) and SDG 7 (Affordable and Clean Energy) at the local scale. Weekly household water supply hours and annual volumes from different sources directly reflect service reliability, sufficiency, and dependence on non-network alternatives, thereby linking to SDG 6 targets on universal and equitable access to safe and affordable drinking water (6.1) and on improving water-use efficiency and reducing scarcity (6.4). The share of the population relying on tanker-delivered water acts as a proxy for both vulnerability and adaptive responses under network failure, capturing emerging inequalities in access.
On the energy side, variables describing the contribution of grid electricity, private diesel generators, and solar PV systems to water pumping and distribution are linked to SDG 7 targets on access to affordable, reliable, and modern energy services (7.1) and on increasing the share of renewable energy in the global energy mix (7.2). The adoption rates of solar water heaters and solar PV units for general household use serve as indicators of decentralized renewable energy diffusion, which can simultaneously reduce dependence on diesel and enhance the resilience of water and energy services in crisis conditions.
Table s1 in the Supplemental Material summarizes all variables, including abbreviations, definitions, units, categories, SDG targets, rationale for inclusion, and Supplemental Table s2 gives their basic descriptive statistics. Illustrative indicators include weekly household water supply hours (hours/week; water; SDG 6.1, 6.4), annual domestic water volume by source (m3/year; nexus; SDG 6.4, 7.1), the share of the population relying on tanker-delivered water (% of population; water; SDG 6.1), the share of water pumping powered by diesel generators (% of volume; nexus; SDG 6.1, 7.1), the number of solar PV units installed for water-related uses (count; nexus; SDG 6.4, 7.2), and the number of solar water heaters (count; energy; SDG 7.2). For each indicator, the table briefly explains how it captures a specific dimension of water-energy resilience under crisis conditions. While this set of indicators cannot exhaustively represent all facets of the water-energy nexus, it captures a meaningful subset of its most policy-relevant dimensions: reliability and equity of water access, dependence on informal or emergency sources, the energy intensity of water services, and the diffusion of decentralized renewables. Some aspects, such as water quality, tariff structures, and detailed household coping strategies, are not directly observed and thus remain outside the scope of this analysis. We explicitly acknowledge these limitations in interpreting the results and focus our conclusions on the dimensions that the available municipal indicators are best suited to represent.
In fact, this study is subject to several limitations. Participation from municipalities in Baalbek-Hermel (3 municipalities) and Akkar (4 municipalities) was relatively low, which may result in an incomplete portrayal of conditions in these governorates. Moreover, data collection took place between February and September 2023 using stratified purposive sampling. The pre-crisis was obtained retrospectively from records. The analysis is also confined to the Lebanese context, which may limit the extent to which the findings can be transferred or compared to other countries. Finally, because all information was reported by municipal officials rather than collected through household surveys, the dataset primarily reflects institutional viewpoints and may understate the frequency or severity of service disruptions, an important caveat we bear in mind when interpreting the results.
Methods and Analysis Strategy
Statistical Methods Employed
All statistical analyses in this study were conducted using RStudio Version 2022.12.0+353 (2022.12.0+353), following preliminary data cleaning and organization in Microsoft Excel 2016 to ensure data integrity before analysis.
For clustering techniques, we processed the data in Excel by identifying missing values in both rows and columns and removing those with more than half of their entries missing. This approach ensures that the remaining dataset is sufficiently complete for multivariate analyses, reducing bias and preserving the reliability of factor analysis, and clustering results. All other techniques can handle missing values either by considering smaller sample sizes (Analysis of variance ANOVA) or by skipping the couples of points related to the missing values (Regression).
Guided by the study objectives, our analytical strategy followed a tiered design that combines a limited set of complementary techniques. First, ANOVA and Multivariate analysis of variance (MANOVA) were used to quantify regional disparities and pre-/post-crisis changes in key water and energy related indicators, directly addressing our questions about how the crisis redistributed water supply and altered renewable energy adoption across governorates. Post-hoc comparisons Tukey’s Honestly Significant Difference HSD were conducted where appropriate to identify specific pairs of governorates exhibiting significant differences, and MANCOVA models included covariates such as population size to isolate the effects of interest (Bodmer et al., 2021; Fisher, 1970; Montgomery, 2012).
Second, PCA and EFA were applied to summarize water and energy indicators into latent dimensions, facilitating visualization of patterns, detection of outlier municipalities, and clarification of interrelationships among renewable energy technologies and water service indicators (Abdi & Williams, 2010; Francis & Wills, 1999; Härdle & Simar, 2019; Jolliffe, 1990; Tharwat, 2016). These dimensions inform clustering but are not used to infer causality.
Hierarchical and K-means clustering were applied to group municipalities into coherent typologies based on water or energy profiles and to identify outlier municipalities that systematically deviate from national patterns (Cabezas et al., 2023; Everitt et al., 2011; Zheliznyak et al., 2016). This descriptive and policy-oriented analysis highlights municipalities requiring targeted interventions and informs the design of differentiated, cluster-specific strategies, avoiding uniform nationwide measures.
Regression analysis was employed to quantify how population dynamics, including Lebanese, refugee, and total populations, influence municipal water and energy systems, encompassing domestic and industrial water supply and adoption of decentralized renewable energy technologies. Both simple and multiple linear models were used to isolate individual effects while controlling contextual factors, thereby assessing how demographic pressures shape infrastructural, institutional, and socio-economic dimensions of water-energy resilience under crisis conditions (Everitt et al., 2011; Montgomery et al., 2012; Zheliznyak et al., 2016).
These analytical techniques were applied in an integrated framework to address the study objectives and produce robust, data-driven insights. Figure 3 illustrates this conceptual framework, highlighting how each statistical technique relates to specific research questions, data domains, and the assessment of municipal water-energy resilience under crisis conditions. This diagram emphasizes the flow from data preparation and dimensionality reduction, through typology identification, to the evaluation of demographic and contextual determinants of resilience outcomes.
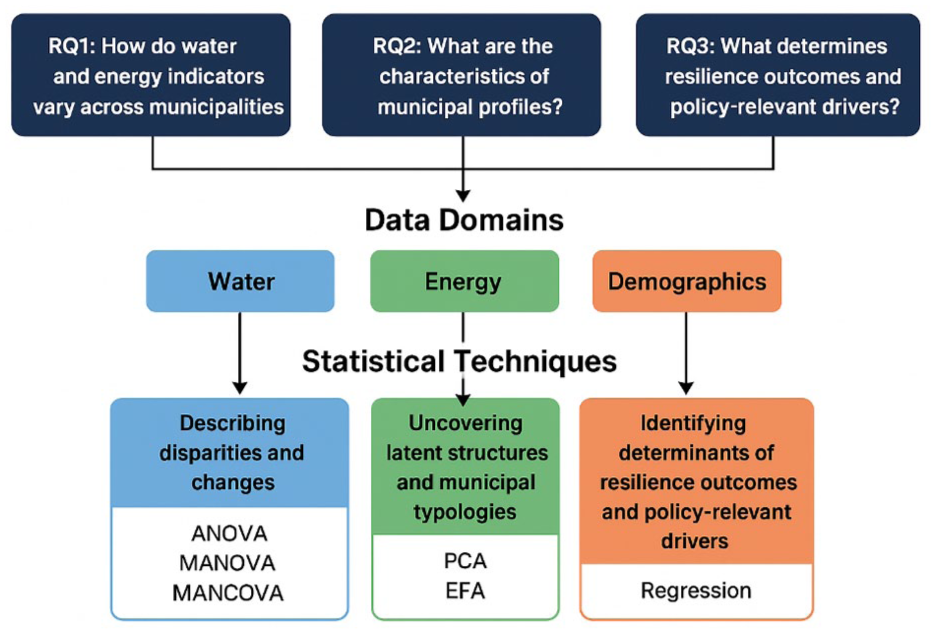
Conceptual diagram of the analytical framework.
While factor analysis and clustering results offer valuable context by revealing patterns of variation and typologies among municipalities, the identification of determinants of resilience relies primarily on regression-based analyses.
Assumption Tests and Data Preparation
Prior to the application of each statistical method, rigorous assumption tests were conducted to ensure the validity and reliability of the results.
The Normality assumption for parametric tests was assessed using the Shapiro-Wilk test and the test results showed no significant departures from normality, confirming that the assumption was sufficiently satisfied for the subsequent analyses. ANOVA’s assumption of Homogeneity of Variance (Homoscedasticity) was tested using Levene’s test. In parallel to ANOVA, the non-parametric alternative Kruskal-Wallis test was applied to verify the robustness of the results.
Multicollinearity among the independent variables was assessed using the Variance Inflation Factor (VIF), with values above 5 indicating potential multicollinearity (Montgomery et al., 2012). For water-related variables, post-crisis VIF values were approximately 1 (e.g. watersuppA = 1.000, domesticA = 1.003, industrialA = 1.003), and pre-crisis values were similarly low (watersuppB = 1.001, domesticB = 1.003, industrialB = 1.003), confirming the absence of linear dependence. Energy-related variables also showed very low VIFs across both Lebanese and refugee models, including heaters (1.022), solarpv (1.015), and wind (1.007), indicating no multicollinearity. These consistently low values justify the simultaneous inclusion of all selected water and energy indicators in subsequent regression analyses and confirm that multicollinearity does not account for any non-significant predictors.
Before conducting PCA and EFA, the suitability of the data was confirmed using two key measures: The Kaiser-Meyer-Olkin (KMO > 0.5 acceptable) Measure of Sampling Adequacy for the proportion of variance in the variables that might be caused by underlying factors (Kaiser, 1974; Lu et al., 2024; Montgomery et al., 2012), and the Bartlett’s Test of Sphericity, where a significant result (p < .05) indicates that the variables are correlated and suitable for factor analysis (Hair, 2010).
For water indicators, KMO = 0.49 (marginally acceptable) and Bartlett’s test was significant (χ2 = 676.3, p < .001). Energy indicators showed lower sampling adequacy (KMO = 0.23), indicating weak intercorrelations, though Bartlett’s test remained significant (χ2 = 481.34, p < .001). After removing variables with the lowest measure of sample adequacy MSA values, the revised KMO increased to 0.43, and the Bartlett’s test remained significant (χ2 = 260.2, p = 4.524517e-32 <0.05), confirming marginal suitability for factor analysis while preserving meaningful correlations.
For analysis requiring parameter specification, systematic methods were used to determine the optimal number of components, factors, or clusters. For PCA and EFA, scree plots were used to visually identify the “elbow” point, indicating the optimal number of components or factors to retain (Rencher & Christensen, 2012). Parallel analysis, a more objective method, was also employed to determine the number of components/factors whose eigenvalues were greater than those from randomly generated data (Dobriban & Owen, 2019). K-means clustering used the silhouette method to determine the optimal number of clusters (Kaufman & Rousseeuw, 2009). For water indicators, two clusters were optimal, with an average silhouette width of 0.75, indicating a strong clustering structure. Cluster one contained 39 municipalities, with a high silhouette width of 0.79, reflecting well-defined and cohesive groupings.
Finally, to ensure comparability across variables with different scales, all variables were standardized before conducting PCA and cluster analysis.
Given the modest sample size (N = 150) relative to the number of indicators, PCA, EFA, and clustering were treated as exploratory tools. Their purpose was to identify robust, high-level patterns, such as recurrent outliers and latent dimensions, rather than to produce finely resolved typologies.
Results
This section presents the main findings derived from the applied statistical analyses and integrates them into a comprehensive discussion of their significance for Lebanon’s water and energy sectors. The results are interpreted in light of the country’s ongoing economic crisis, highlighting how shifts in water accessibility, energy use patterns, and renewable adoption reflect broader structural challenges and emerging opportunities within the water-energy nexus. Particular emphasis is placed on how the identified trends, disparities, and relationships inform strategies for resilience, sustainability, and integrated resource management.
Water Sector Disruptions and Disparities
Regarding regional disparities in water distribution, the Analysis of Variance (ANOVA) confirmed statistically significant disproportionality in water supply among governorates in the post-crisis period. This indicates that the burden of reduced water availability is not evenly distributed across the country, with some regions experiencing more severe shortages than others.
Beyond statistical significance, the magnitude of regional disparities is substantively large. For example, the number of hours of water supply per week varies dramatically across governorates: municipalities in the best performing governorate (North) receive on average 34.8 hr per week, compared with only 4.3 hr per week in Baalbek-Hermel, a disparity of roughly 709%. Similar contrasts appear for domestic water supply volumes. Annual domestic supply ranges from a minimum of 23,741 m3 per year in Beirut to a maximum of 2.23 × 10⁸ m3 per year in Baalbek-Hermel, representing a staggering difference of approximately 9.390%. Total volume supplied also varies sharply, from 322,546 m3 per year in Nabatieh to 2.25 × 10⁸ m3 per year in Baalbek-Hermel, a gap of about 69.610%.
Thus, the analysis of domestic water supply revealed a statistically significant difference (p-value = 3.72e-05) across regions. A subsequent Tukey’s HSD post-hoc test showed that Baalbek-Hermel governorate exhibited a significantly higher domestic water supply compared to nearly all other regions (Figure 4). This result may be attributed to the presence of specific local water sources, lower population density in certain areas, or more resilient local management structures. However, it also underscores the vulnerability of other, more densely populated or resource-scarce regions.
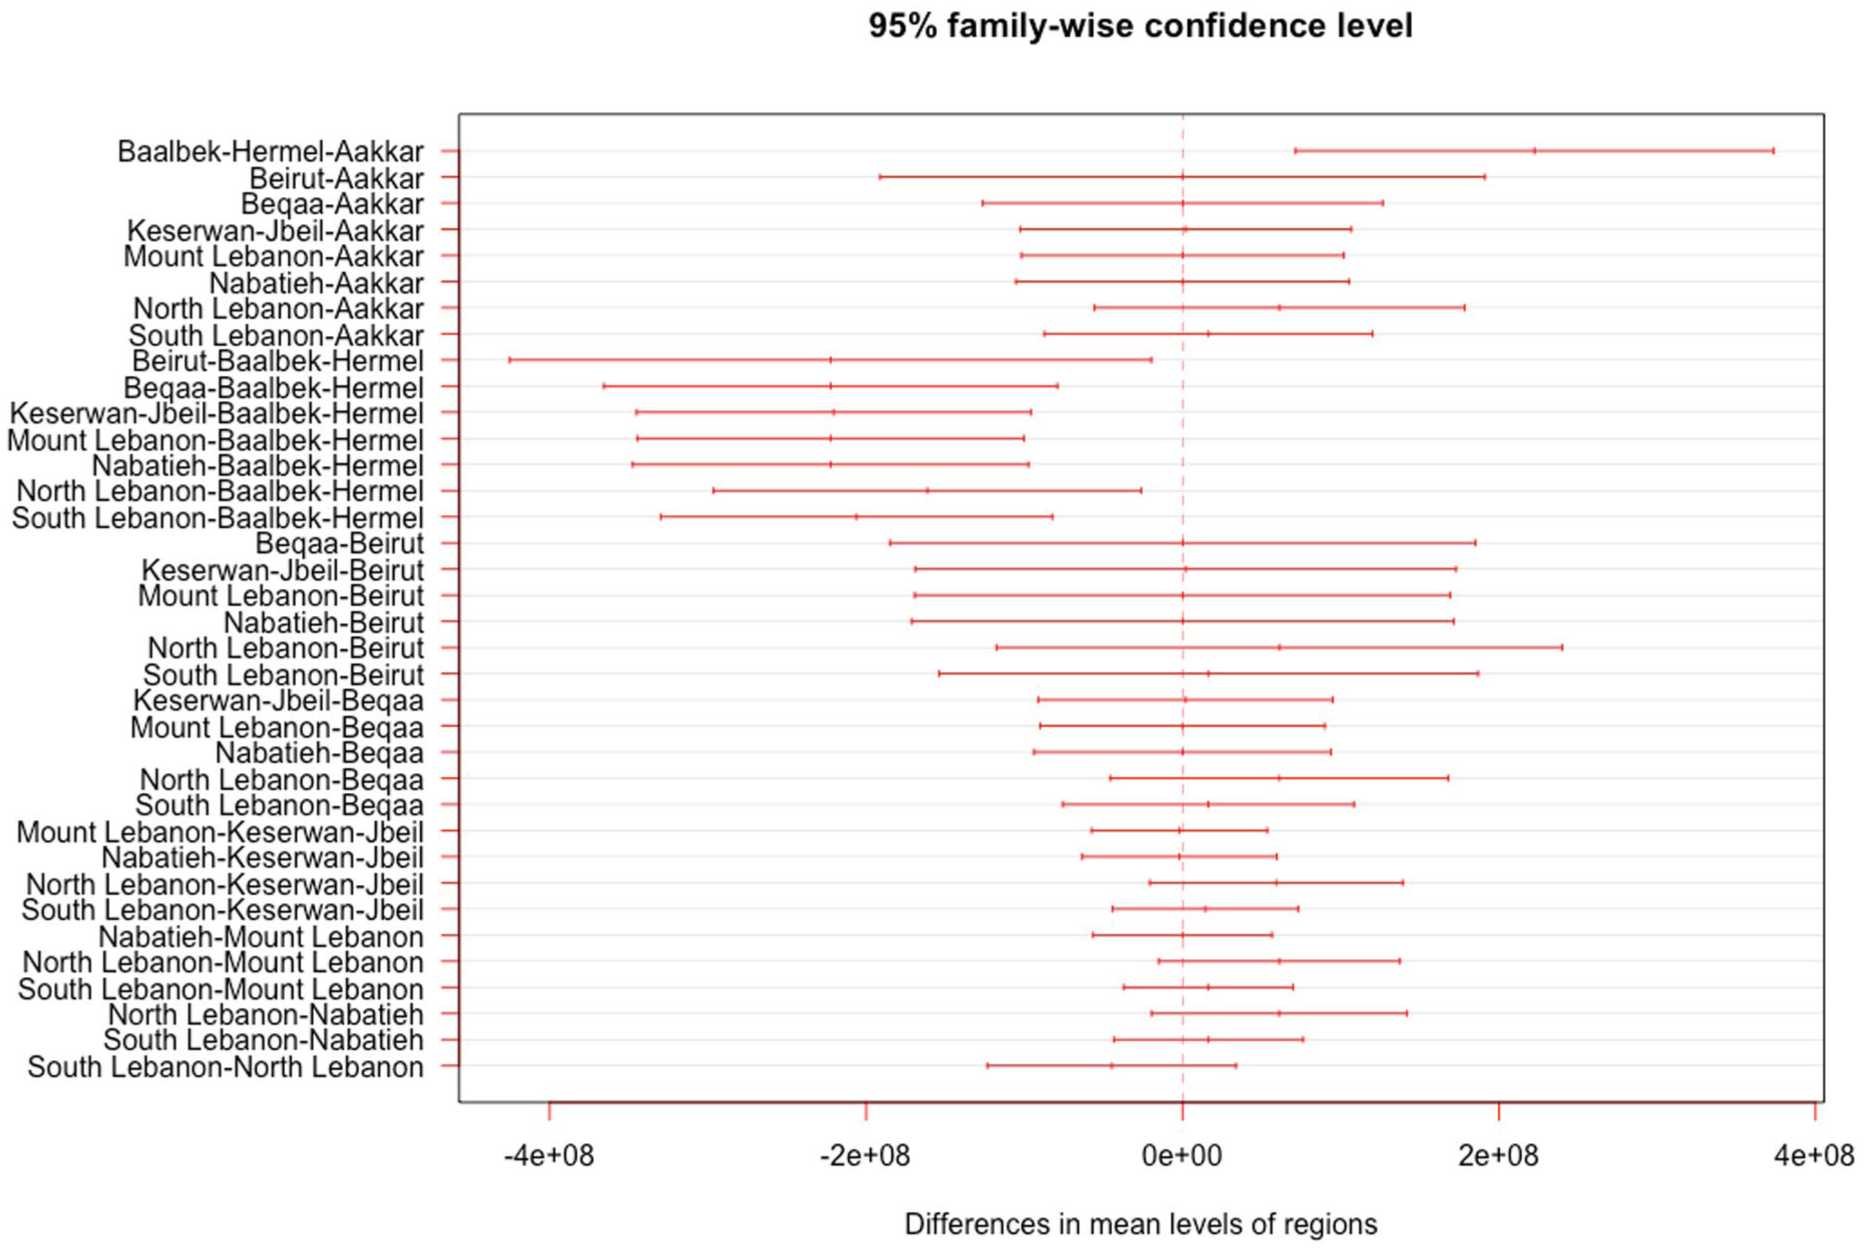
Post-hoc analysis for domestic water supply (error bars represent the 95% family-wise confidence intervals for the pairwise differences in regional means, computed using the Tukey HSD test.).
The analysis of industrial water supply also yielded highly significant results (p-value < 2e-16). Beirut, as the capital and economic hub, showed a significantly higher industrial water supply than all other regions by the Tukey HSD test. This suggests a prioritization of industrial activity in the capital, potentially at the expense of domestic supply in other areas, or may simply reflect the centralization of industrial and commercial activities in Beirut.
Furthermore, an examination of the total volume of water supply reinforced the regional findings (p-value = 0). Consistent with the domestic supply findings, Baalbek-Hermel exhibited a significantly higher total water supply compared to many other regions according to Tukey HSD test, reinforcing its relatively better position in terms of water resources during the crisis.
Effect-size statistics indicate that the disparities are not merely statistically detectable but also practically large, underscoring the uneven distribution of basic water services across the country for almost all variables (Table 1).
Effect-Size for ANOVA.

Multivariate Analysis of Variance and Covariance
MANOVA was first employed to examine the effect of the governorate (as an explanatory variable) on the adoption of green energy. The results showed no significant multivariate effect (p-value = .7313). In contrast, a subsequent MANCOVA was performed on the water-related variables, specifically assessing their dependence on region and crisis timing (before/after) while controlling for the influence of total population (including both Lebanese citizens and refugees). This analysis, which included the water-related variables as response measures and governorate and timing as explanatory variables, revealed more nuanced multivariable effects. Consequently, further regression analysis was performed to study the effect of the covariates (population size and refugees) on water variables across governorates.
Akkar had the most pronounced decline in water supply following the crisis. North Lebanon showed a relatively higher post-crisis water supply compared to Akkar (p = .0784), while Mount Lebanon (p = .0551) and Beqaa (p = .0455) demonstrated marginal significant differences in how the crisis affected water supply relative to Akkar. Other governorates did not show statistically significant differences.
For domestic water consumption, Akkar experienced a significant drop after the crisis.
North Lebanon reported significantly higher post-crisis domestic consumption compared to Akkar (p = .07) with pre-crisis domestic consumption increasing by 75.86 units less than Akkar. Mount Lebanon (p = .06) and Beqaa (p = .03) also exhibited notable differences in the impact of the crisis on domestic consumption. Moreover, Beqaa had a significantly smaller increase in pre-crisis domestic consumption compared to Akkar, with consumption levels 81.23 units lower. Other governorates did not show any statistically significant changes.
Regarding industrial water use, Akkar again showed a significant decline following the crisis. North Lebanon had a near-significant increase in post-crisis industrial consumption (p = .0895), while mount Lebanon (p = .07) and Beqaa (p = .0483) displayed near-significant differences in crisis-related impacts. Additionally, Beqaa recorded a significantly smaller pre-crisis rise compared to Akkar, with consumption levels 41.17 units lower. Other governorates showed no statistically differences.
It is noteworthy that, compared to Beirut, all other governorates exhibited lower estimates in all water-related variables. The effect size table for MANOVA is provided in the Supplemental Material (Table s3).
The MANOVA/MANCOVA combined results show a coherent pattern: municipalities with higher refugee-to-host population ratios and larger total populations tend to experience both lower per capita domestic water supply and greater variability in service continuity, even after controlling for governorate-level effects. In contrast, municipalities with greater penetration of on-site renewable energy (e.g. solar PV) and a more diversified mix of supply sources exhibit relatively higher domestic and industrial water availability. While these associations do not imply causality given the cross-sectional nature of the data, they highlight plausible pathways through which demographic stress and adaptive investments jointly shape observed resilience outcomes.
Dimensionality Reduction and Clustering
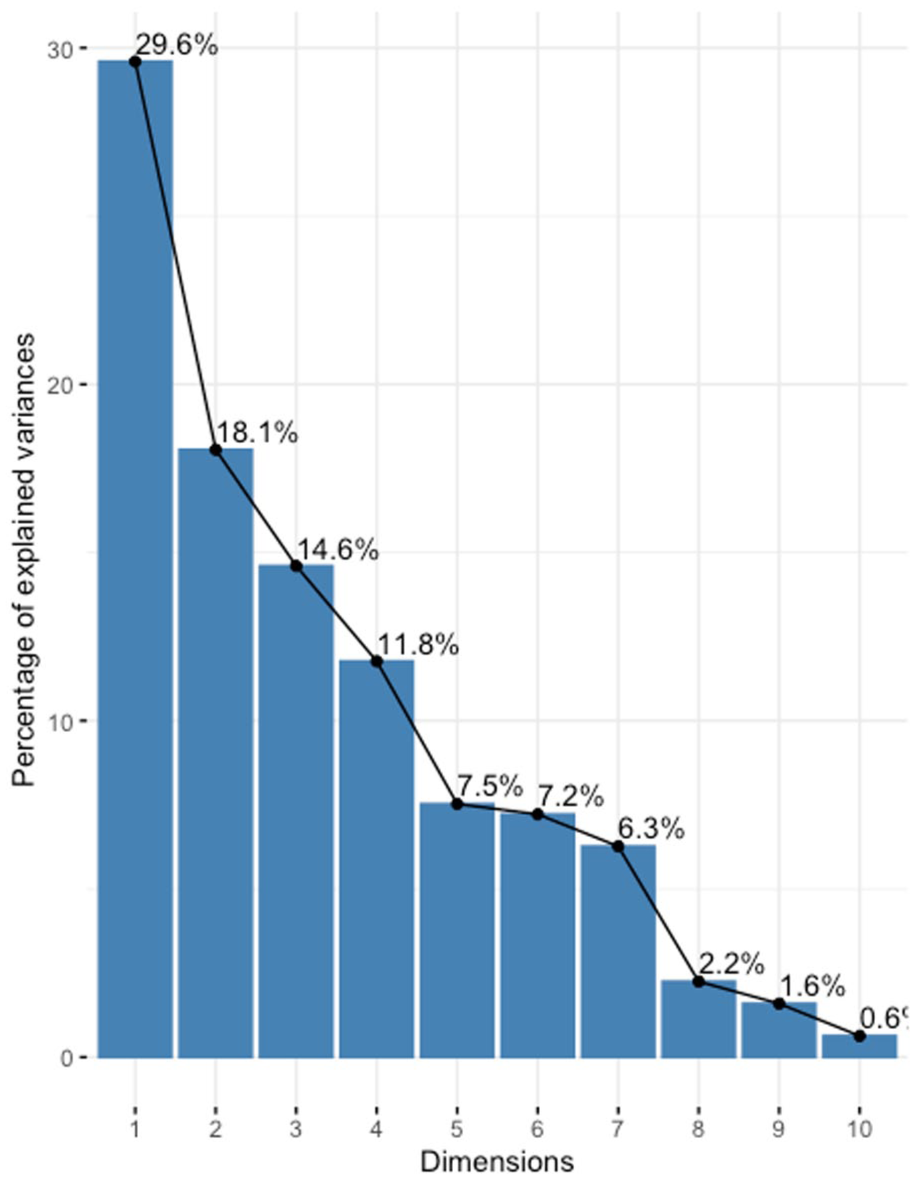
For water-related variables, the scree plot generated from the PCA (Figure 2) suggested retaining the first three principal components, which collectively explained approximately 89% of the total variance in the dataset. This indicates that a substantial portion of the variability in water supply and usage across municipalities can be captured by these few underlying dimensions. The proportion of variance and vector loadings are provided as Supplemental Material in Tables s4 and s5.
The PCA scores plot (Figure 5), which visually represents municipalities in a reduced dimensional space, consistently identified two specific municipalities as distinct outliers: Village 10 (Tripoli) and Village 38 (Qaa in Baalbek-Hermel). These municipalities differed significantly from the main clusters, suggesting unique challenges or characteristics related to their water infrastructure and supply. For instance, Tripoli, a major urban center, likely faces immense pressure due to high population density and aging infrastructure. In contrast, Qaa, a more rural area, may be affected by geographical isolation or specific resource constraints.

Scree plot for water data with elbow method.
For the energy-related variables, the first four principal components explained about 74% of the total variance (Figure 6). The proportion of variance and vector loadings are provided as Supplemental Material in Tables s6 and s7.

PCA plot with K-means clustering for water data (PC1 = First principal component, the direction that explains the most variation in the dataset; PC2 = second Principal Component, the direction that explains the second most variation; PC3 = third Principal Component, the third direction of maximum variation).
Similar to the water data, PCA scores plot for energy data identified specific municipalities as outliers: Village 2 (Bissareye) and Village 4 (Qa in South Lebanon). These municipalities formed separate clusters, indicating distinct energy adoption patterns or challenges compared to the majority of municipalities (Figure 7). Their outlier status may be attributed to factors such as unique local initiatives, specific economic conditions, or particular energy demands (Figure 8).
Scree plot for energy data with elbow method.

PCA plot with K-means clustering for energy data.
Exploratory Factor Analysis (EFA) was also conducted on the water-related variables to uncover latent constructs. Based on scree plots and parallel analysis (Figure 9), three latent factors were retained, collectively explaining 76.44% of the total variance.

Parallel Analysis scree plot for water data.
These factors were primarily associated with:
Volume-related variables, reflecting the overall quantity of water supplied;
Water supply variables, pertaining to the regularity and hours of water provision; and
Population-related variables, indicating the demographic influence on water demand and access (Figure 10).

Factor loading diagram for water data (MR = Main Rotation).
This factor structure provides a more parsimonious and interpretable understanding of the complex interrelationships within the water sector data.
Rotated factor loadings for latent factors representing water data are shown in the Supplemental Material (Table s8).
For the energy-related variables, EFA retained two factors, explaining 51% of the total variance (Figure 11).

Parallel analysis scree plot for energy data.
These factors were primarily associated with:
PV systems, reflecting the adoption and reliance on solar photovoltaic technology; and
Solar water heaters, indicating the adoption of solar thermal solutions for domestic heating (Figure 12).

Factor loading diagram for energy data.
This finding suggests that, although both technologies are solar-based, their adoption patterns may be influenced by different underlying drivers or serve distinct purposes within households and municipalities. Rotated factor loadings of observed energy variables on two extracted latent factors are shown in the Supplemental Materials (Table s9).
The factor-analytic results reveal three broad latent dimensions that are particularly informative for resilience assessment. The first factor, which we interpret as service continuity and network reliability, loads positively on indicators such as average daily supply hours and negatively on reported interruption frequencies. The second factor, renewable energy diversification, is characterized by high loadings on solar PV adoption, solar water heating, and non-grid electricity sources, capturing the extent to which municipalities have developed alternative energy pathways for securing water services. The third factor, grid-dependence and tanker reliance, loads inversely on renewable energy indicators and positively on the use of private generators and tanker-delivered water.
Municipalities with high scores on the first two factors and low scores on the third can be characterized as having relatively robust and diversified water-energy configurations, while those with the opposite profile exhibit more fragile, grid-dependent systems. Outlier municipalities such as Tripoli (Village 10) and Qaa (Village 38) occupy extreme positions on these dimensions: Tripoli combines high population density and complex networked infrastructure with significant reliance on private generators, whereas Qaa represents a peripheral, historically underserved border municipality with elevated dependence on tanker water and limited renewable energy penetration. These contrasting profiles illustrate how different combinations of infrastructural, demographic, and geographic conditions can produce distinct resilience challenges, even when both municipalities are flagged as outliers in the same statistical framework.
Clustering Techniques
The findings from the dimensionality reduction analyses were strongly supported by the clustering techniques results. For the water data, both hierarchical and K-means clustering techniques consistently corroborated the outlier status of Village 10 (Tripoli) and Village 38 (Qaa in Baalbek-Hermel). These municipalities were characterized by consistently very low mean values for water-related variables (e.g. hours of supply, volume) and low silhouette scores, indicating that they were poorly matched to any other cluster and stood apart from the main municipal groupings. This highlights the need for highly localized and targeted interventions in these specific areas. A silhouette plot for k-means clustering is provided in Supplemental Material (Figure s1).
Similarly, clustering analyses for the Energy Data confirmed Village 2 (Bissareye) and Village 4 (Qa in South Lebanon) as outliers (Figure 13). These municipalities exhibited distinct energy adoption patterns, suggesting unique local contexts or policy responses that differentiate them from the broader national trends. Understanding these exceptional cases can provide valuable insights and lessons for future energy policy design and implementation.
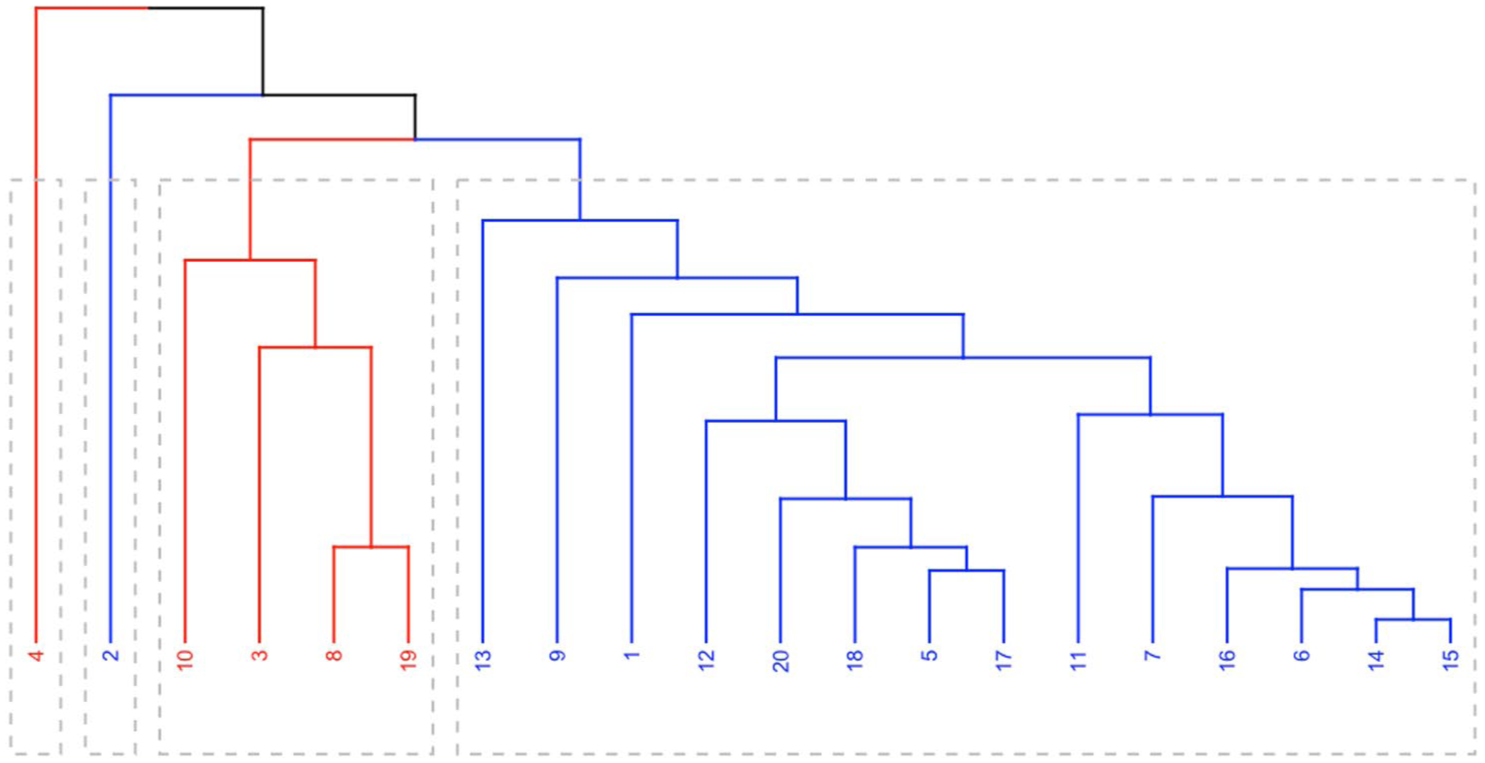
Dendrogram of k-means clustering for energy data.
Rather than treating clusters as purely statistical artifacts, we interpret them as municipal resilience profiles. One cluster, for example, is characterized by relatively high domestic water supply, moderate population density, and widespread adoption of solar PV, suggesting comparatively strong robustness and adaptive capacity. Another cluster combines low domestic and industrial water availability with high tanker reliance and weak renewable energy uptake, indicating low robustness and limited redundancy. A third, more mixed cluster includes municipalities with intermediate levels of supply but marked internal variability, pointing to heterogeneous local governance and service delivery arrangements.
Regression Analysis of Population Impact
Regression analysis was employed to quantify the relationships between various population demographics and water and energy supply parameters.
The presence of refugee populations showed a significant positive impact on domestic water supply both before (R-squared = 0.5945, p = 0) and after (R-squared = 0.5053, p = 0) the crisis. This suggests that areas with larger refugee populations tend to have a higher domestic water supply, which could be attributed to humanitarian interventions or infrastructure development in refugee-hosting communities. A positive relationship was also observed on industrial water supply (R-squared before = 0.12 with p = .0356, R-squared after = 0.10 with p = .04524). For overall water supply, a positive association was also noted, but with comparatively lower R-squared values.
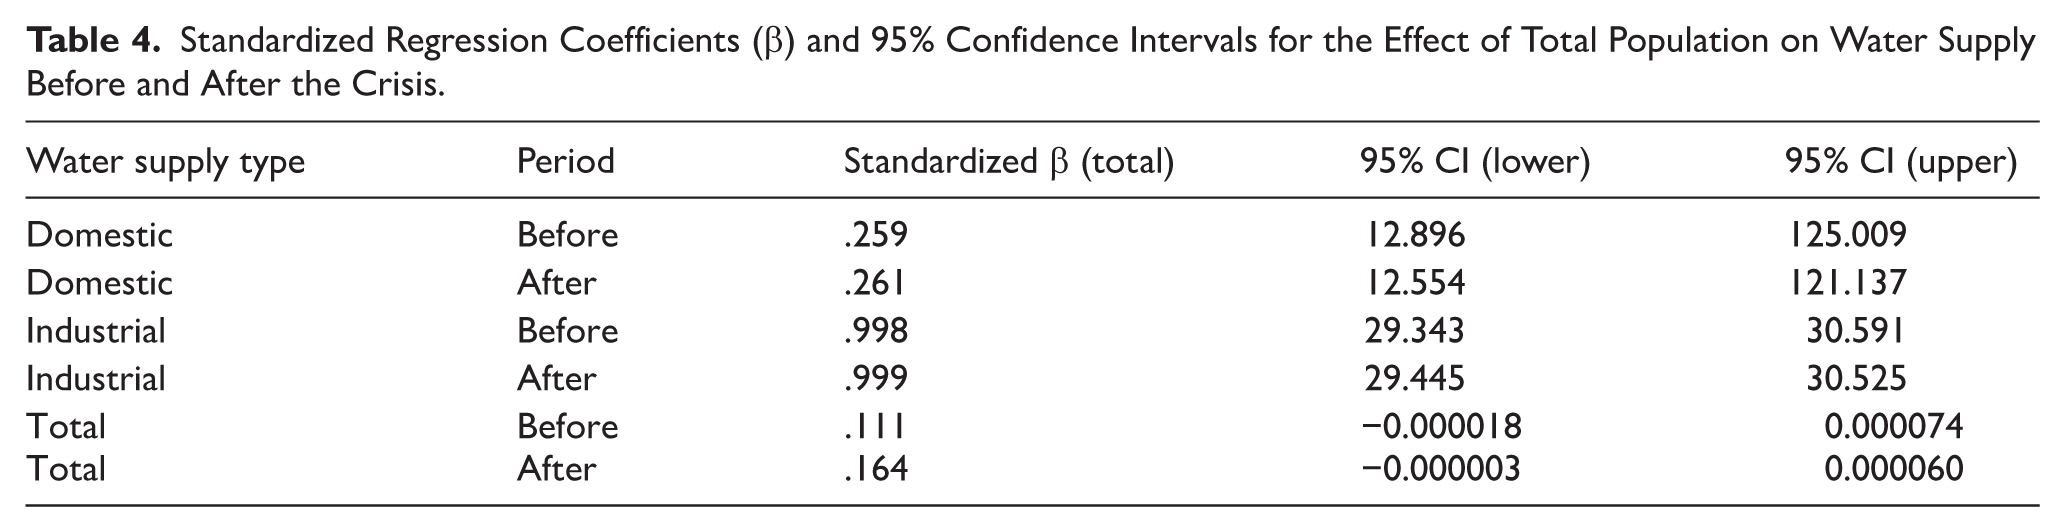
Conversely, the Lebanese population demonstrated an extremely strong positive relationship with industrial water supply both before and after the crisis (R-squared = 0.9962, p = 0 for both). This remarkably high R-squared value indicates that the variations in the Lebanese population explain a substantial proportion of the variance in industrial water use, likely reflecting a direct link between industrial activity and population-driven economic demand. However, its relationship with domestic and overall water supply was weak or statistically non-significant (p = .054 before, p = .0497 after). The total population (Lebanese + refugee) showed a significant positive relationship with domestic water supply (p = .01654 before and p = .01644 after) and a highly significant positive relationship with industrial water supply both before and after the crisis (R-squared = 0.9961 before and 0.997 after, p = 0 in both cases). Its relationship with overall water supply was marginally significant after the crisis (p = .074) but not before (p = .22). These findings highlight the aggregate demographic pressure on water resources, particularly in driving industrial water demand, and underline the differentiated effects of resident and refugee populations on various components of the water supply system.
A multivariate linear regression model confirmed that the Lebanese population was significantly associated with an increase in industrial water use (p value ~0, estimate = 30.23). Conversely, refugee populations were associated with a significant decrease in industrial water use (p = .006, estimate = −78.4), which may reflect their limited involvement in industrial activities or their concentration in areas with less industrial infrastructure. Furthermore, regression analyses examining the relationship between demographic factors (refugee population, Lebanese population, and total population) and green energy adoption (solar water heaters, solar PV systems, and wind turbines) generally showed no statistically significant associations. This suggests that population size or composition alone does not directly influence the adoption rates of these green energy technologies.
The standardized regression coefficients are provided along with corresponding 95% confidence intervals in Tables 2 to 4.
Standardized Regression Coefficients (β) and 95% Confidence Intervals for Refugee Population.

Standardized Regression Coefficients (β) and 95% Confidence Intervals for the Effect of Lebanese Population on Water Supply Before and After the Crisis.

Standardized Regression Coefficients (β) and 95% Confidence Intervals for the Effect of Total Population on Water Supply Before and After the Crisis.
Discussion
Linking Statistical Findings to Resilience Dimensions
Our empirical findings can be interpreted through the lens of resilience theory, particularly the dimensions of robustness, redundancy, adaptive capacity, and equity in water-energy systems. Municipalities clustered in the high-supply, high-renewables group exhibit greater robustness, in the sense that they can maintain higher levels of domestic and industrial water supply despite broader crises. Their diversified energy portfolios, reflected in high scores on the “renewable energy diversification” factor, provide redundancy by reducing dependence on any single supply pathway. At the same time, the strong association between demographic pressure and reduced water availability in other clusters underscores limits to adaptive capacity where local institutions lack the resources or autonomy to invest in alternative infrastructures.
The sharp disparities identified by ANOVA and regression analyses are also fundamentally questions of equity. Municipalities in the low-resilience cluster are not just statistically different; they represent communities where households receive substantially fewer liters of water per capita per day and fewer hours of service than their counterparts elsewhere. From a resilience perspective, these differences translate into unequal exposure to risk and unequal ability to cope with and adapt to prolonged crises.
Situating Findings Within Lebanon’s Institutional Framework
These patterns must be read within Lebanon’s fragmented institutional landscape. Water supply is managed by regional water establishments with differing capacities and performance, while municipalities vary sharply in their fiscal resources, technical expertise, and access to donor-funded projects. Municipalities that appear in the high-resilience cluster often coincide with areas where local authorities, NGOs, or international agencies have invested in solar PV for water pumping or in network rehabilitation. Conversely, municipalities in the low-resilience cluster frequently rely on ad-hoc arrangements, such as tanker deliveries and private generators, that reflect both infrastructural deficits and limited institutional capacity. Outlier municipalities, such as Tripoli and Qaa, illustrate how dense urban centers and peripheral border areas can both fall outside national averages but for very different institutional reasons: the former due to complex interaction between municipal services, private provision, and informal networks; the latter due to geographic marginalization and historically lower levels of investment.
By embedding these statistical profiles in the institutional realities of Lebanon, the results move beyond describing where disparities exist to explaining why they arise and which levers: regulatory, financial, or technical, might plausibly be activated to strengthen resilience.
To better situate our Lebanese case within broader cross-sectoral and basin-scale debates, we frame our findings using recent WEF-nexus and basin resilience proposals. Incorporating these perspectives highlights two points. First, the vulnerabilities we measure at the household and irrigation-system level reflect basin-scale hydrosocial interdependencies that require multi-scalar governance responses rather than sectoral fixes (Li et al., 2025). Second, the adaptation options we discuss, demand-side water savings, diversified irrigation energy sources, and cross-sectoral policy coordination, align with the multi-dimensional resilience pathways recommended by regionally adaptive WEF studies (Li et al., 2025), which emphasize flexible, context-sensitive mixes of technical, institutional, and social measures. Additionally, related Agricultural Water Management research offers complementary insights into basin-scale water allocation and agricultural resource pressures (Qi et al., 2025). We therefore interpret our empirical results as evidence that Lebanon’s adaptation strategy would benefit from integrating basin-scale governance instruments (water allocation rules, intersectoral planning platforms) alongside local technical interventions to achieve sustained WEF resilience.
Conclusions and Policy Implications
This study shows that Lebanon’s economic collapse has not only reduced overall water availability, but also deepened spatial inequalities in water-energy resilience. Across the 150 surveyed municipalities, weekly domestic water supply and industrial water volumes declined markedly between 2019 and 2023, with the burden of scarcity falling disproportionately on crisis-exposed regions such as Akkar and parts of North Lebanon, while Baalbek-Hermel and, for industrial uses, Beirut retained comparatively higher supply levels. At the same time, the rapid expansion of solar PV for pumping and general household use, together with widespread solar water heating, indicates a structural shift toward decentralized energy solutions that partially substitute failing grid and diesel-based services. PCA, EFA, and clustering reveal that a small group of municipalities namely Tripoli, Qaa, Bissareye and Qa, form distinct outlier clusters with either exceptionally low service levels or atypical renewable adoption patterns, while most municipalities fall into a limited number of resilience profiles shaped by volume, regularity of supply, and population pressure.
Policy Implications
Taken together, these obtained empirical patterns translate into several core policy-relevant insights for strengthening Lebanon’s water-energy system amid and beyond the economic crisis. First, water-energy resilience is highly uneven: some municipalities combine low hours of piped supply, high reliance on tanker-delivered water, and limited renewable uptake, whereas others exhibit relatively buffered conditions. Policy interventions should therefore be geographically targeted, prioritizing high-vulnerability clusters, particularly in Akkar and selected outlier municipalities such as Tripoli and Qaa, for emergency support to restore minimum service levels, reduce tanker dependence, and secure critical industrial and domestic uses. Second, the emergence of municipalities with comparatively higher solar penetration and more diversified water sources demonstrates that decentralization can materially enhance resilience when local authorities are empowered and resourced to develop their own water-energy portfolios. Decentralization in this context should be operationalized through regulated local utilities, performance-based Public-Private Partnerships for solar-powered pumping, community-level water boards, micro-credit schemes, and technical standards for solar water systems. Third, the weak association between population size and renewable uptake, compared with the strong coupling between population and industrial water use, implies that the ongoing renewable transition is driven more by cost and supply shocks than by demographic characteristics. Policy instruments should therefore focus on lowering transaction costs and investment risks of municipal-scale solar PV and solar water heating. Fourth, linking SDG 6 and SDG 7 through the lens of adaptive governance can improve both conceptual and practical coherence: institutional coordination between water establishments, municipal authorities, and energy regulators, via joint planning units, shared data systems, and participatory decision-making, can reduce inefficiencies arising from sectoral fragmentation and enhance resilience at multiple scales. Fifth, refugee-hosting municipalities require targeted support, as regression analyses indicate that refugee populations significantly influence water demand. Donor-supported programs should ensure equitable infrastructure investment and avoid overburdening local service providers. Finally, building on recent basin-scale resilience frameworks (Li et al., 2025), Lebanon should adopt integrated planning approaches that combine drought management, aquifer protection, renewable energy integration, and cross-sectoral coordination to strengthen multi-dimensional water-energy resilience. Collectively, these recommendations aim to improve crisis response while setting the foundation for a more sustainable and resilient water-energy future.
Limitations and Uncertainties
These conclusions should be interpreted in light of several methodological and data limitations. The analysis relies on a sample of 150 municipalities, with underrepresentation of some governorates (notably Baalbek-Hermel and Akkar), which may bias resilience estimates for those regions. The indicators are derived from interviews with municipal officials rather than household surveys or direct metering, introducing potential institutional bias and under-reporting of service failures. The temporal design compares two relatively narrow windows (February–April 2019 and February–April 2023), capturing crisis-related shifts but not seasonal variability or longer-term adaptation trajectories. Finally, the analysis is confined to Lebanon’s institutional and infrastructural context, limiting the direct generalizability of the quantitative results to other regional or international settings, even if the analytical framework is transferable. Acknowledging these uncertainties is essential to avoid over interpreting statistically strong relationships (high R2 values in some regressions that reflect structural coupling rather than causal dominance) and to frame the findings as indicative rather than definitive.
Future Research Directions
Future work should move beyond cross-sectional comparison toward explicit resilience metrics and dynamic modeling. One priority is to construct composite water-energy resilience indices, grounded in the factor structures identified here, that aggregate volume, regularity, and population pressure into interpretable scores for each municipality and cluster. These indices could then be embedded in multivariate time-series models or panel data frameworks to track how shocks, policy reforms, and infrastructure investments alter resilience over time. A second avenue is to develop governance-resilience models that explicitly couple quantitative indicators (water hours, solar penetration, tanker dependence) with institutional variables such as municipal fiscal capacity, regulatory mandates, and forms of community participation. Such integrated models would enable the evaluation of decentralization scenarios, Public-Private Partnerships designs, and renewable investment programs, yielding more robust, context-specific guidance for strengthening water-energy resilience under protracted economic crisis.
Supplemental Material
sj-docx-1-asw-10.1177_11786221261437582 – Supplemental material for Water-Energy Status Under Economic Collapse: A Statistical Perspective From Lebanon
Supplemental material, sj-docx-1-asw-10.1177_11786221261437582 for Water-Energy Status Under Economic Collapse: A Statistical Perspective From Lebanon by Hana ElMerehbi, Macole Sabat, Jimmy Romanos and Mira Sabat in Air, Soil and Water Research
Footnotes
Ethical Considerations
The Institutional Review Board at the Lebanese American University approved our interviews (approval: IRB # LAU.SAS.JR1.3/Mar/2023) on 3 March 2023.
Consent to Participate
Respondents were informed about the study’s objectives, and verbal consent was obtained before participation. Participation was voluntary and anonymous, and no incentives were offered. Interviews were conducted with municipal officials acting in their professional capacity, and no personal or sensitive information was collected. Participants were fully informed about the study’s objectives, their voluntary participation, and data confidentiality before consent was obtained.
Author Contributions
Hana ElMerehbi contributed to formal analysis, data interpretation, visualization, and writing the original draft and reviewing and editing the manuscript. Macole Sabat contributed to conceptualization, formal analysis, and writing the original draft and reviewing and editing the manuscript. Jimmy Romanos contributed to data curation, formal analysis, and writing the original draft and reviewing and editing the manuscript. Mira Sabat contributed to conceptualization, methodology, investigation, supervision, and project administration, as well as formal analysis and data interpretation, and writing the original draft and reviewing and editing the manuscript.
Funding
The authors received no financial support for the research, authorship, and/or publication of this article.
Declaration of Conflicting Interests
The authors declared no potential conflicts of interest with respect to the research, authorship, and/or publication of this article.
Data Availability Statement
Data supporting the findings of this study are available from the corresponding author upon request.*
Supplemental Material
Supplemental material for this article is available online.