
Abstract
Despite advances in remote sensing, vineyard yield prediction often suffers from limited multi-source data integration, low spatial resolution, and a lack of reproducibility in Mediterranean environments. This study addresses these gaps by presenting an innovative, standardized methodology that integrates multi-temporal satellite data (Sentinel-2, PlanetScope, and VHR), high-resolution UAV imagery (1–3 cm2), and soil property measurements with machine learning (ML) algorithms to improve yield prediction and crop management. The research was conducted in a 9.2 ha experimental vineyard in Villamena, Granada (Spain). A statistically significant difference was detected between vegetation indices obtained from different sensors (p < .05), highlighting that sensor type strongly affects the measured index values. Vegetation indices and soil variables were analyzed using advanced ML algorithms (KNN, SVM, DT, and RF) to identify key patterns influencing crop vigor and performance. Model evaluation metrics included Pearson’s correlation coefficient, Mean Absolute Percentage Error (MAPE), Mean Absolute Error (MAE), and Root Mean Squared Error (RMSE). Among the tested models, KNN achieved the highest accuracy, particularly when using PlanetScope imagery (r = .9988, RMSE = 0.0105). The findings demonstrate the practical value of data integration: UAVs provide precise, site-specific monitoring during key growth phases, while satellite imagery supports broader temporal and spatial coverage. By applying this methodology, farmers and agronomists can make informed decisions regarding fertilization, irrigation, and harvest timing, optimizing resource use and enhancing sustainability. Furthermore, the developed models are transferable to other Mediterranean vineyard regions. This work provides a concise framework for implementing precision viticulture strategies, bridging the gap between advanced remote sensing analytics and actionable agricultural management.
Keywords
Introduction
Agriculture has transformed its monitoring and management systems over recent decades, culminating in the highly mechanized practices observed today (Pathmudi et al., 2023). Precision Agriculture (PA), also referred to as Agriculture 4.0, involves the application of advanced technologies to food and fiber production systems (Erickson & Fausti, 2021). Achieving this transformation requires the use of satellite imagery, Unmanned Aerial Vehicles (UAVs), and in situ sensors for real-time monitoring of crop variability and physiological changes (Zhai et al., 2020). These technologies significantly reduce the time and labor associated with traditional methods, enabling efficient data acquisition with lower environmental impact (Lowenberg-DeBoer & Erickson, 2019).
These advances have generated vast datasets, commonly referred to as Big Data (Coble et al., 2018), fostering the development of automated analytical methods driven by computational intelligence and advanced analytics (Issad et al., 2019). Consequently, the interpretation and management of this information require professionals with strong skills in statistical and computational tools to support the ongoing digitization of agricultural systems (Bendre et al., 2015).
Building on this paradigm, machine learning (ML) is recognized as a key tool for pattern recognition and predictive modeling in environmental and agricultural studies (Demir & Çağ, 2025). ML algorithms enhance predictive accuracy and facilitate detailed analysis of complex environmental and territorial variables, contributing to more precise and robust models for sustainable natural resource management (Demir et al., 2024). Within PA, these applications support optimal soil and plant management, promoting nature-based solutions (Keesstra et al., 2023). Remote sensing, in particular, has become a foundational tool for crop management throughout all phenological stages (Sishodia et al., 2020). A core PA strategy involves correlating multi-source data through multi-temporal analyses to better understand crop evolution, considering key drivers such as precipitation and temperature that influence vegetation indices (Serrano et al., 2012). In parallel, decision-support tools combining geospatial analysis with analytic hierarchy processes (AHP) are gaining attention for land suitability assessment (Moisa et al., 2025).
The Mediterranean corridor in Spain represents a major hub for high-quality woody crop production, including vineyards, olive groves, and fruit orchards (Almonacid & Martínez, 2019). Although PA implementation has traditionally been constrained by cultural and economic barriers (Beluhova-Uzunova & Dunchev, 2019), these limitations are progressively diminishing as digital technologies—such as artificial intelligence (AI), ML, and the Internet of Things (IoT)—are increasingly embedded in agricultural software, satellite platforms, and UAV systems (Sadjadi & Fernández, 2023). In woody crops, PA is particularly effective when high-resolution spatial data (e.g. plot-level variability and nutritional requirements) are combined with adequate mechanization, ensuring both environmental and economic benefits (Alamo et al., 2012). These technologies enable the optimization of inputs such as fertilizers, thereby enhancing sustainability and resource-use efficiency (Rejeb et al., 2022). Satellite-derived products, for example, provide estimates of Leaf Area Index that support fruit yield prediction and irrigation scheduling (Sams et al., 2022).
In recent years, multispectral imaging has gained substantial attention in precision viticulture due to its ability to provide timely, non-destructive, and spatially explicit information on vineyard health and productivity (Cambronero et al., 2025; Govi et al., 2024; Khlghatyan et al., 2025). By capturing spectral reflectance, multispectral sensors allow the calculation of vegetation indices—such as NDVI, SAVI, and GNDVI—which are widely used to monitor vine vigor, detect water stress, and assess canopy structure (Demir et al., 2024; Govi et al., 2024; Rondeaux et al., 1996; Sandonís-Pozo et al., 2024; Zhang et al., 2025). Among these applications, yield prediction using remote sensing has become increasingly relevant. NDVI derived from UAV imagery, for instance, supports yield estimation through chlorophyll content assessment, thereby improving nutrient use efficiency (NUE; Zhang et al., 2025). Furthermore, remote sensing facilitates large-scale characterization of soil properties and their spatial variability (Zhai et al., 2020), which is particularly critical in Mediterranean agroecosystems where climate variability demands efficient and adaptive management approaches. Despite these advances, a lack of unified and reproducible protocols integrating geographical, pedological, and climatic contexts persists.
To promote broader adoption of PA, the development of standardized and reproducible protocols adaptable across spatial scales and crop types is essential. Although early methodological efforts exist (Das et al., 2015), they often lack the integration of high-resolution remote sensing data within a comprehensive and operational framework. To the best of our knowledge, no previous study has combined multi-scale UAV and high-resolution satellite imagery with detailed soil property datasets within a unified protocol for yield prediction in woody crops.
Previous modeling approaches frequently rely on single-source data or overlook the synergistic integration of soil properties with multi-scale vegetation indices when training advanced ML models. This omission is critical, as soil characteristics—such as texture, depth, and water-holding capacity—are primary drivers of long-term spatial variability in vine vigor and yield (Leolini et al., 2023). Moreover, the consistency and accuracy of vegetation indices derived from different sensor types require further evaluation when incorporated into ML-based frameworks. Spectral band misalignment and radiometric inconsistencies among UAV, very high-resolution (VHR), and satellite platforms pose significant technical challenges for effective data fusion (Jiang et al., 2022).
To date, no study has systematically evaluated and compared the combined performance of UAV, VHR satellite, and soil-derived variables integrated within an ML-driven framework, nor assessed their consistency for operational PA applications. Understanding environmental variability through PA is essential for enabling site-specific management aligned with Land Degradation Neutrality objectives and the Sustainable Development Goals (Bhakta et al., 2019).
To address these gaps, this study proposes and validates an innovative, standardized, and reproducible methodology that integrates multi-source precision agriculture technologies—including UAV- and satellite-based remote sensing, soil property data, and ML algorithms (Khlghatyan et al., 2025). The methodology is articulated through a transparent, step-by-step workflow to ensure technical reproducibility across diverse agro-environmental contexts. This comprehensive integration represents a significant advance over traditional single-source approaches, providing a more robust and transferable framework.
The central research question guiding this study is: Can the integration of multi-scale remote sensing data (UAV and VHR satellites) with soil properties through advanced machine learning algorithms significantly outperform traditional single-source models in predicting yield and managing spatial variability in Mediterranean woody crops?
Accordingly, the main objective is to develop and validate this integrated methodology. The research was conducted in a 9.2 ha experimental vineyard in Villamena, Granada (Spain), previously managed under conventional practices. Since mid-2022, high-resolution multispectral imagery (1–3 cm2) has been acquired using UAVs, alongside multi-temporal data from Sentinel-2 and PlanetScope satellites. Vegetation indices and soil variables were analyzed using advanced ML models—K-Nearest Neighbors, Support Vector Machines, Decision Trees, and Random Forests—to identify key patterns influencing vine vigor and yield (Adar, 2024; Beriain, 2023; Dias et al., 2024; Fahim & Sužiedelytė Visockienė, 2023; Pacheco et al., 2025). We hypothesize that (1) high-resolution imagery significantly improves yield prediction accuracy compared to lower-resolution sources, and (2) ML models trained on integrated vegetation and soil datasets outperform traditional approaches in capturing spatial variability. This methodology is intended to serve as a reference framework for researchers and practitioners seeking to implement efficient, sustainable, and data-driven precision agriculture solutions.
Materials and Methods
Study Area
The experimental site is a 9.2 ha vineyard owned by Bodegas Calvente, located in Villamena, Granada, southern Spain (UTM Zone 30N: 444,578; 4,093,427). Four grape varieties coexist within the plot: Cabernet Sauvignon, Tempranillo, Petit Verdot, and Merlot. The vineyard is planted using a trellis system with a 2.3 × 1.4 m spacing. Rows are oriented north–south (Figure 1), and the inter-row areas are kept free of vegetation cover.

(A) Study area. Coordinate system UTM Zone 30N (EPSG: 32630); (B) Classified Yield Map by Sectors in 2022. Data Provided by the Farmer. (C) UAV photography in fieldwork; (D) photography of the vineyard plot in Villamena, Granada, Spain.
The area is characterized by a Mediterranean climate (Csa) according to the Köppen–Geiger classification (Andrade & Contente, 2020). Based on data from the nearest meteorological station (Padul, approximately 10 km away; URL: https://www.juntadeandalucia.es/agriculturaypesca/ifapa/riaweb/web/estacion/18/10), the following average values were recorded for 2022: mean annual temperature of 16.9°C, total annual precipitation of 240.7 mm, mean relative humidity of 56.2%, and annual reference evapotranspiration of 3.2 mm.
The vineyard is managed under conventional practices. Every 2 to 3 years, the winegrower applies an NPK (nitrogen, phosphorus, and potassium) nutritional treatment, which is essential for proper vine development: nitrogen promotes vegetative growth, phosphorus plays a key role in photosynthesis, and potassium enhances water uptake, increasing plant tolerance to drought and salinity. In addition, the vineyard receives applications of animal manure and dehydrated, pelletized plant material.
Irrigation is carried out through a localized drip fertigation system, delivering 4 l/h for 7 hr every 10 days during the summer period.
Data Sources
Ground Data
The methodological workflow of this study—including data acquisition, preprocessing, modeling, and evaluation steps—is summarized in a flowchart to enhance the clarity, logical consistency, and reproducibility of the proposed precision viticulture approach (Figure 2). To complement the remote sensing data with edaphic and topographic information, key physicochemical and geomorphological variables previously obtained from the same experimental plot were integrated to analyze their influence on vine vigor and yield (R. Rodrigo-Comino et al., 2024).
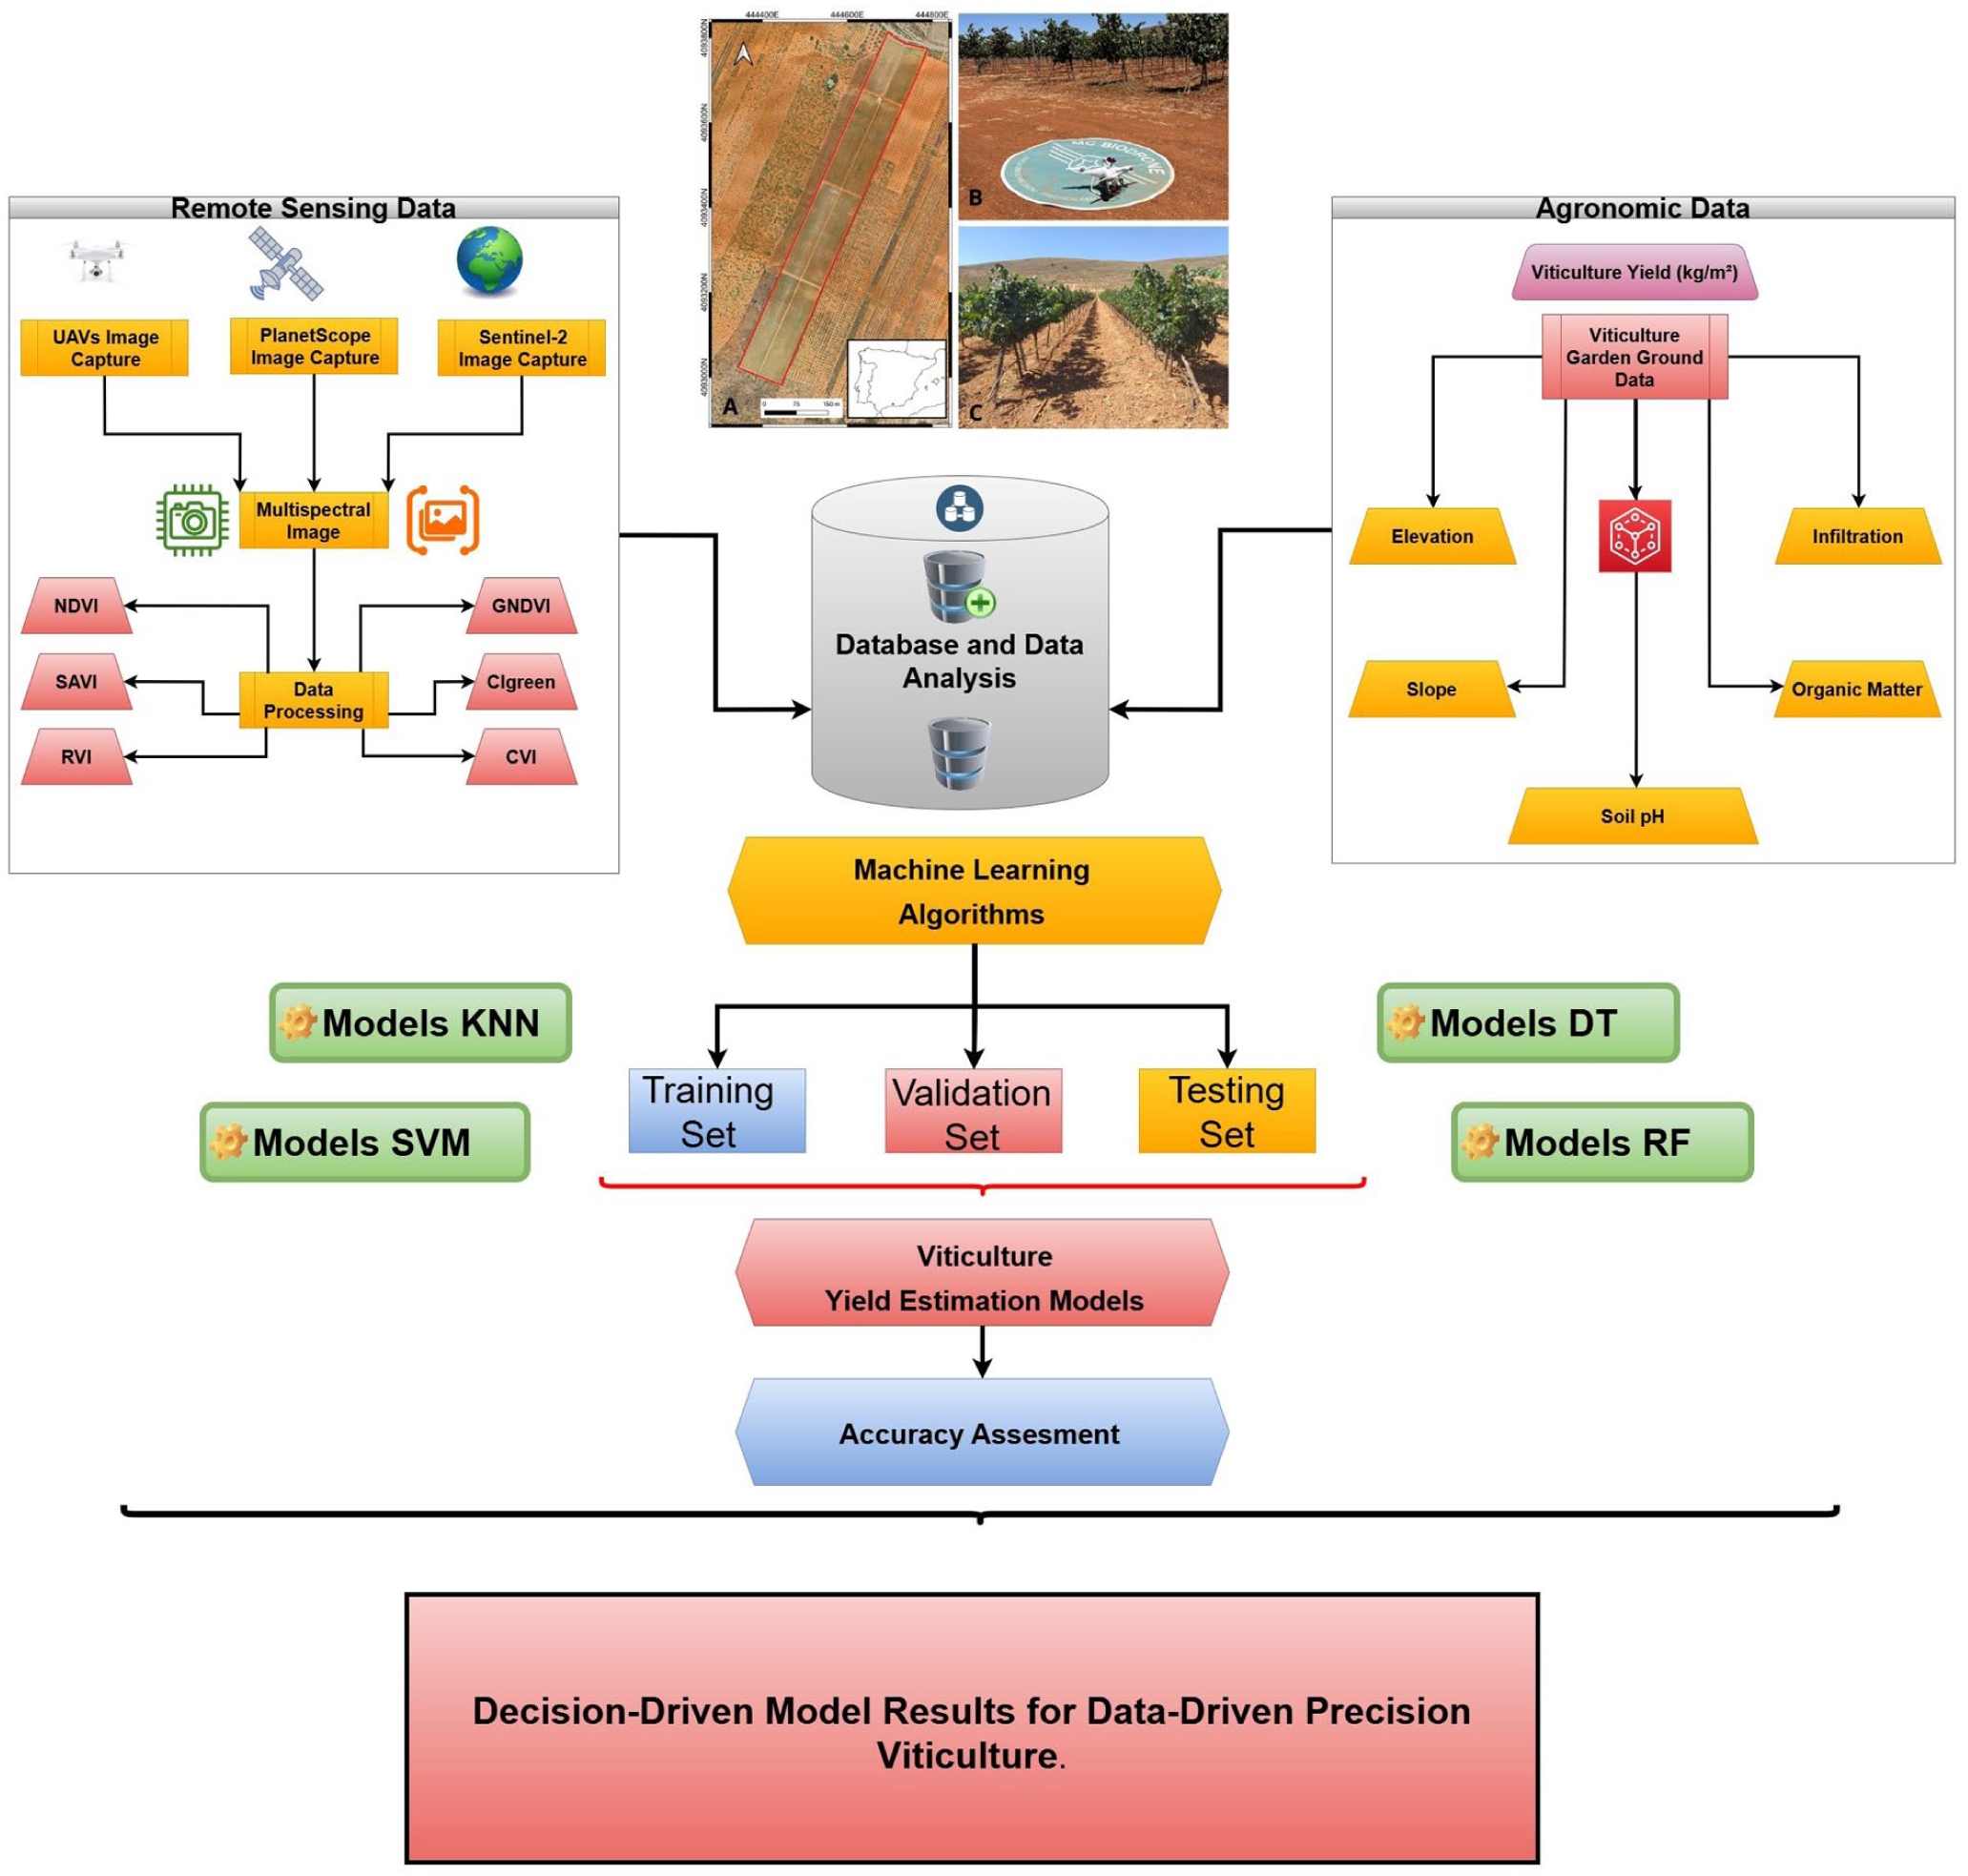
Methodological workflow of the study. Diagram showing the sequence of steps from data acquisition (UAV and satellite imagery) to processing, vegetation index calculation, and Machine Learning analysis for vineyard monitoring.
These parameters include the geomorphological variables of elevation and slope, as well as the physicochemical variables of soil pH, infiltration rate (mm s-1), and organic matter content (%). Elevation data were obtained from a high-precision topographic survey conducted using an EMLID Reach RS2 GNSS receiver, achieving centimeter-level accuracy. Soil pH data were derived from a previous pedological characterization study, while infiltration, organic matter, and slope data were incorporated based on a prior field investigation (Parra Ortega et al., 2024).
All datasets were georeferenced and spatially linked with multispectral imagery acquired by UAVs and satellite platforms (Sentinel-2, PlanetScope, and VHR). These pedological and topographic variables were subsequently cross-referenced with vegetation indices derived from the imagery and incorporated into advanced machine learning models. This integrated approach enabled the identification of key spatial patterns influencing vine vigor and yield, as depicted in Figure 2.
UAV (Unmanned Aerial Vehicle)
The UAV flight was conducted on July 27, 2022, at 12:00 local time. Environmental conditions were selected to ensure reliable multispectral data acquisition, including 0% cloud cover, approximately 45% relative humidity, and low wind speed (⩽5 m s-1). These optimal conditions minimized motion blur, sensor noise, and illumination variability, in accordance with established operational guidelines. The UAV platform used was a DJI Phantom 4 Pro (Table 1), one of the most widely employed systems in professional and research applications (Kurbanov & Litvinov, 2020). The UAV was equipped with a Parrot Sequoia multispectral sensor (Costa et al., 2025; Kurbanov & Litvinov, 2020), which captures four spectral bands (green, red, near-infrared, and red edge), along with the built-in 1-inch 20 MP CMOS RGB sensor for high-resolution orthophotography. Flight parameters included an altitude of 60 m, a ground speed of 6 m s-1, and a 70% image overlap.
UAV Platforms and Sensors Used in Vineyard Monitoring.
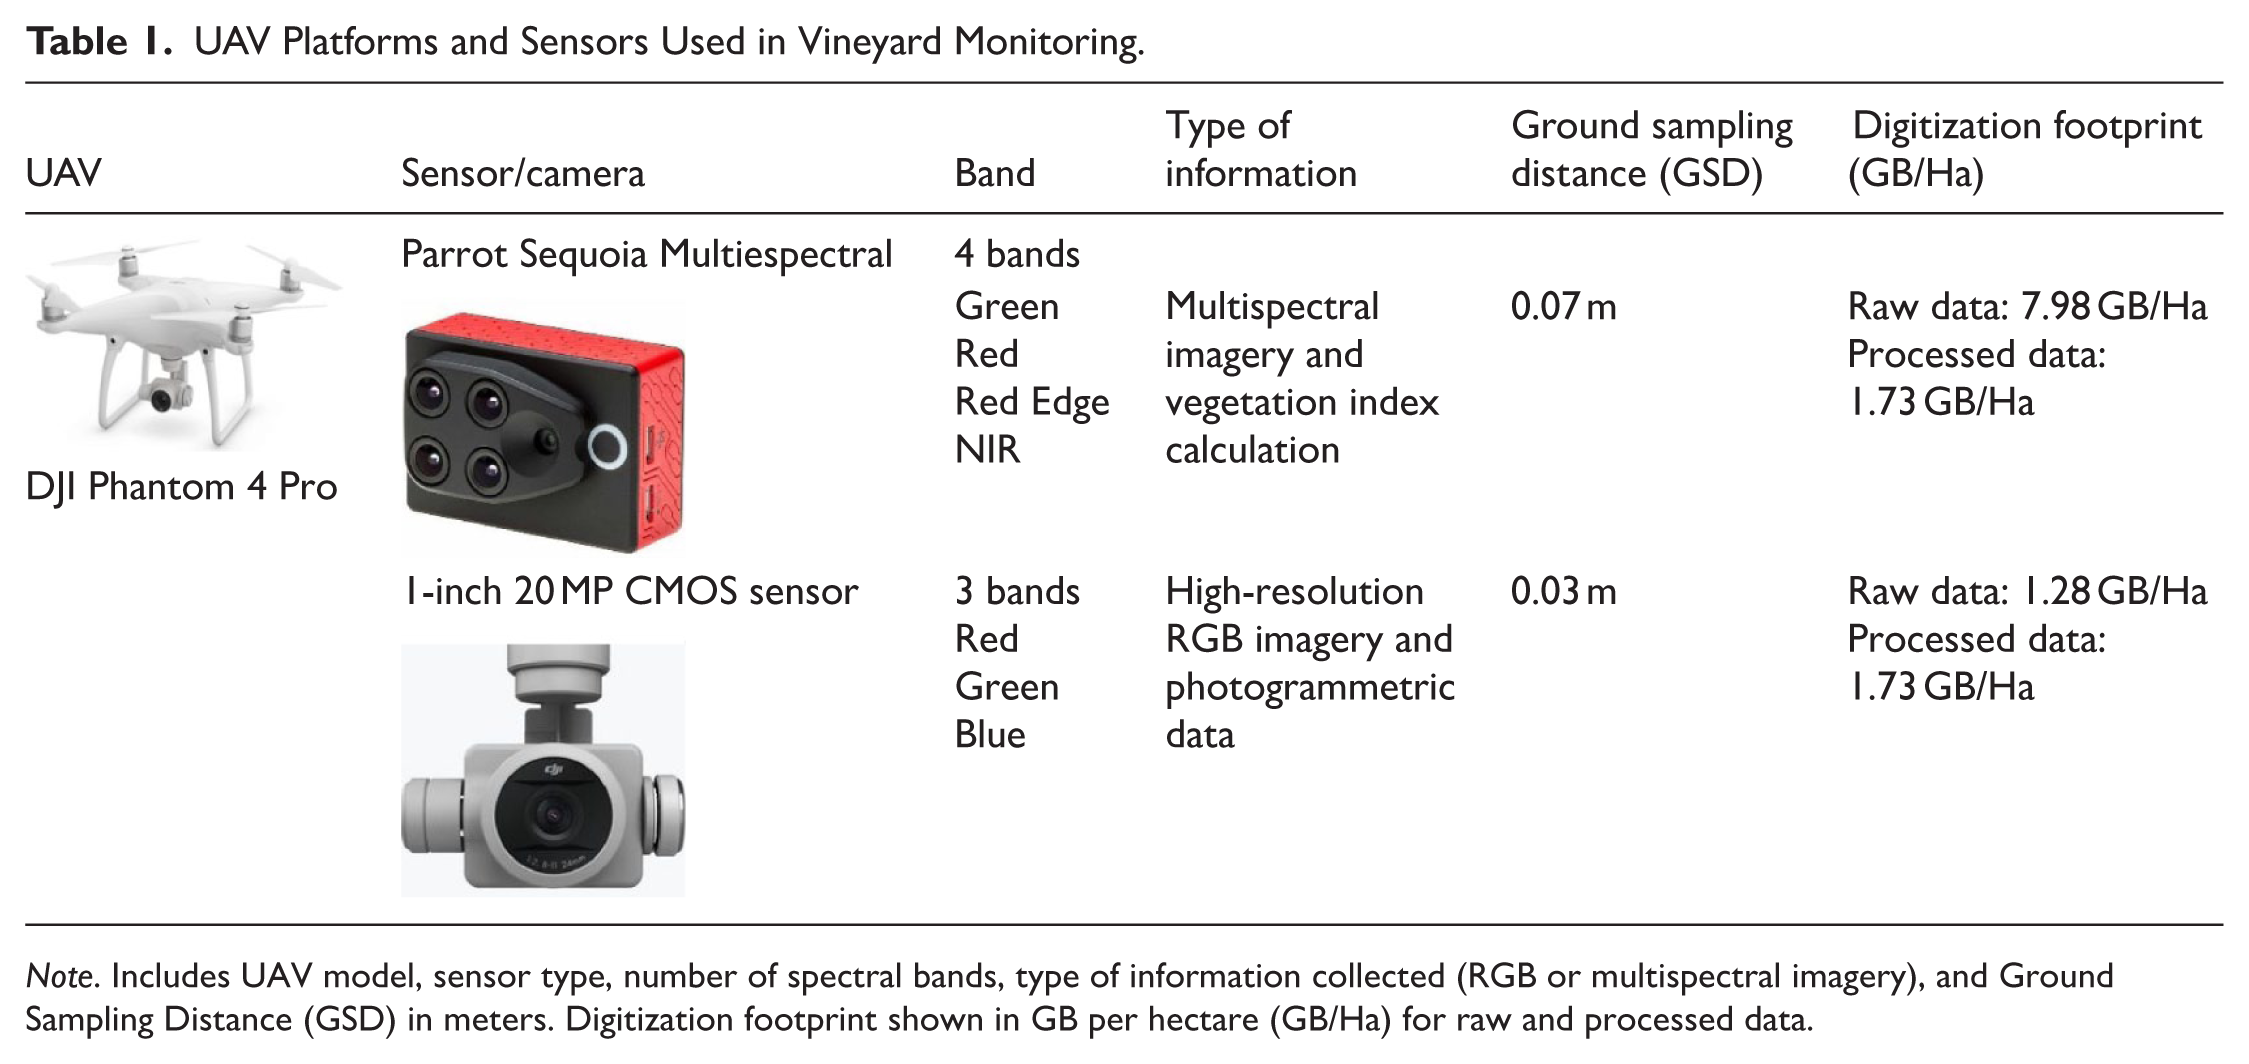

Note. Includes UAV model, sensor type, number of spectral bands, type of information collected (RGB or multispectral imagery), and Ground Sampling Distance (GSD) in meters. Digitization footprint shown in GB per hectare (GB/Ha) for raw and processed data.
Multispectral and RGB data were processed using Pix4Dmapper (Pix4D, Switzerland), a widely used software platform for precision agriculture applications. The processing workflow included quality assessment of the flight execution and the generation of key products, such as calibrated spectral bands, orthomosaics, and Digital Terrain Models (DTMs). Subsequently, the processed datasets were transferred to QGIS 3.34.2 “Prizren” for further spatial analysis. This software was used to mosaic the processed bands and to manually compute vegetation indices using mathematical expressions that combine the spectral bands through the Raster Calculator tool.
Satellite Images
Data were collected from multiple satellite platforms (Table 2). Although Sentinel-2 imagery is widely used in agricultural applications due to its open accessibility, its 10 m spatial resolution is often insufficient for monitoring crops with heterogeneous canopy structures, such as trellised vineyards, where finer spatial detail is required (Guevara-Torres et al., 2025; Roselli et al., 2025). Consequently, the use of satellites providing high-resolution (HR) imagery (e.g. 3 m spatial resolution) is recommended, as it substantially improves the accuracy of vineyard variability mapping.
Satellite Sensors Used for Precision Agriculture.
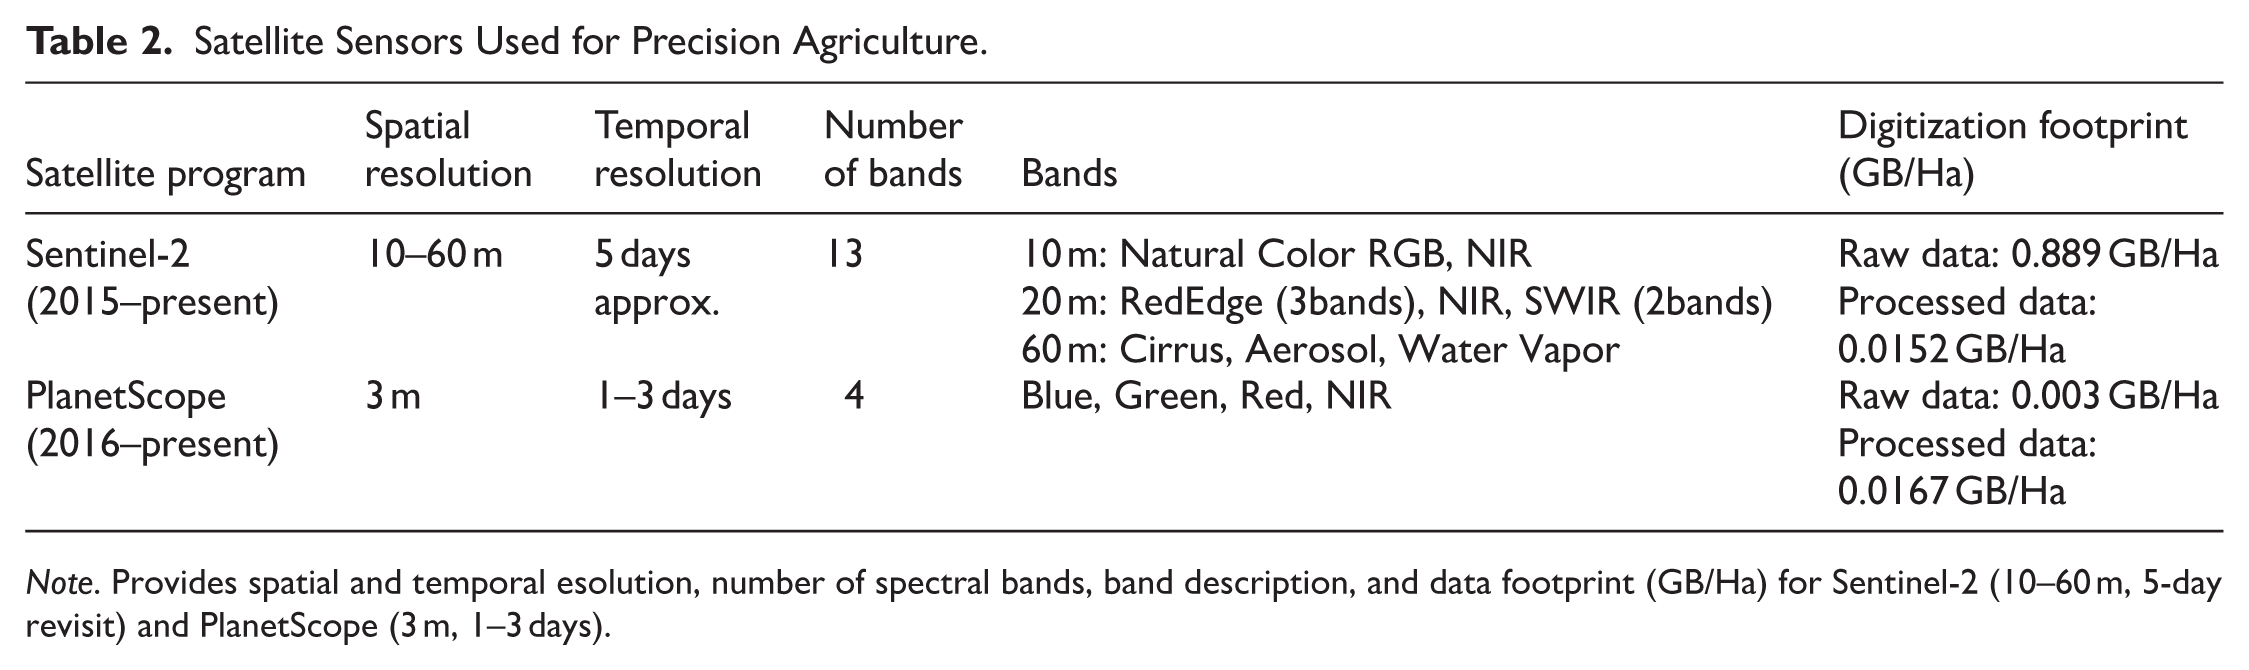
Note. Provides spatial and temporal esolution, number of spectral bands, band description, and data footprint (GB/Ha) for Sentinel-2 (10–60 m, 5-day revisit) and PlanetScope (3 m, 1–3 days).
Raw satellite data, including PlanetScope and Sentinel-2 imagery, were supplied by Graniot Satellite Technologies S.L., a GIS company collaborating in the acquisition of both commercial (PlanetScope) and freely available (Sentinel-2) datasets. These raw images were subsequently processed and analyzed by the authors using QGIS 3.34.2 “Prizren.”
The processing of satellite data began with the generation of vegetation indices for each acquisition date, enabling the construction of time series for multitemporal analysis and monitoring. A specific preprocessing workflow was applied according to the data source, as detailed as follows: (i) Sentinel-2: Level-2A (L2A) products, which include atmospheric correction, were downloaded from the Copernicus platform. The imagery was subsequently reprojected to the ETRS89 / UTM Zone 30N coordinate system and spatially cropped to the exact vineyard boundary. Sentinel-2 imagery was available from mid-2017. (ii) PlanetScope: Orthorectified and radiometrically corrected products (Level 3 or Level 4), processed by the data provider, were used. These preprocessing steps correct geometric distortions and ensure accurate surface reflectance values. The imagery was then spatially cropped to match the vineyard extent. PlanetScope imagery was available from mid-2019.
Measurement of Vegetation Indexes Using Multispectral Images
Raw data were acquired from the spectral bands of UAV-based multispectral sensors and satellite imagery. These spectral bands were subsequently processed following the same methodological framework described above, using specific mathematical algorithms to derive information on crop condition. All vegetation indices included in this study (Table 3) were calculated manually using the QGIS Field Calculator.
Vegetation Indices Used in the Study. Includes index name, formula, estimated values (e.g. vigor, chlorophyll content), and bibliographic reference. All indices selected for spectral consistency across UAV and satellite datasets.
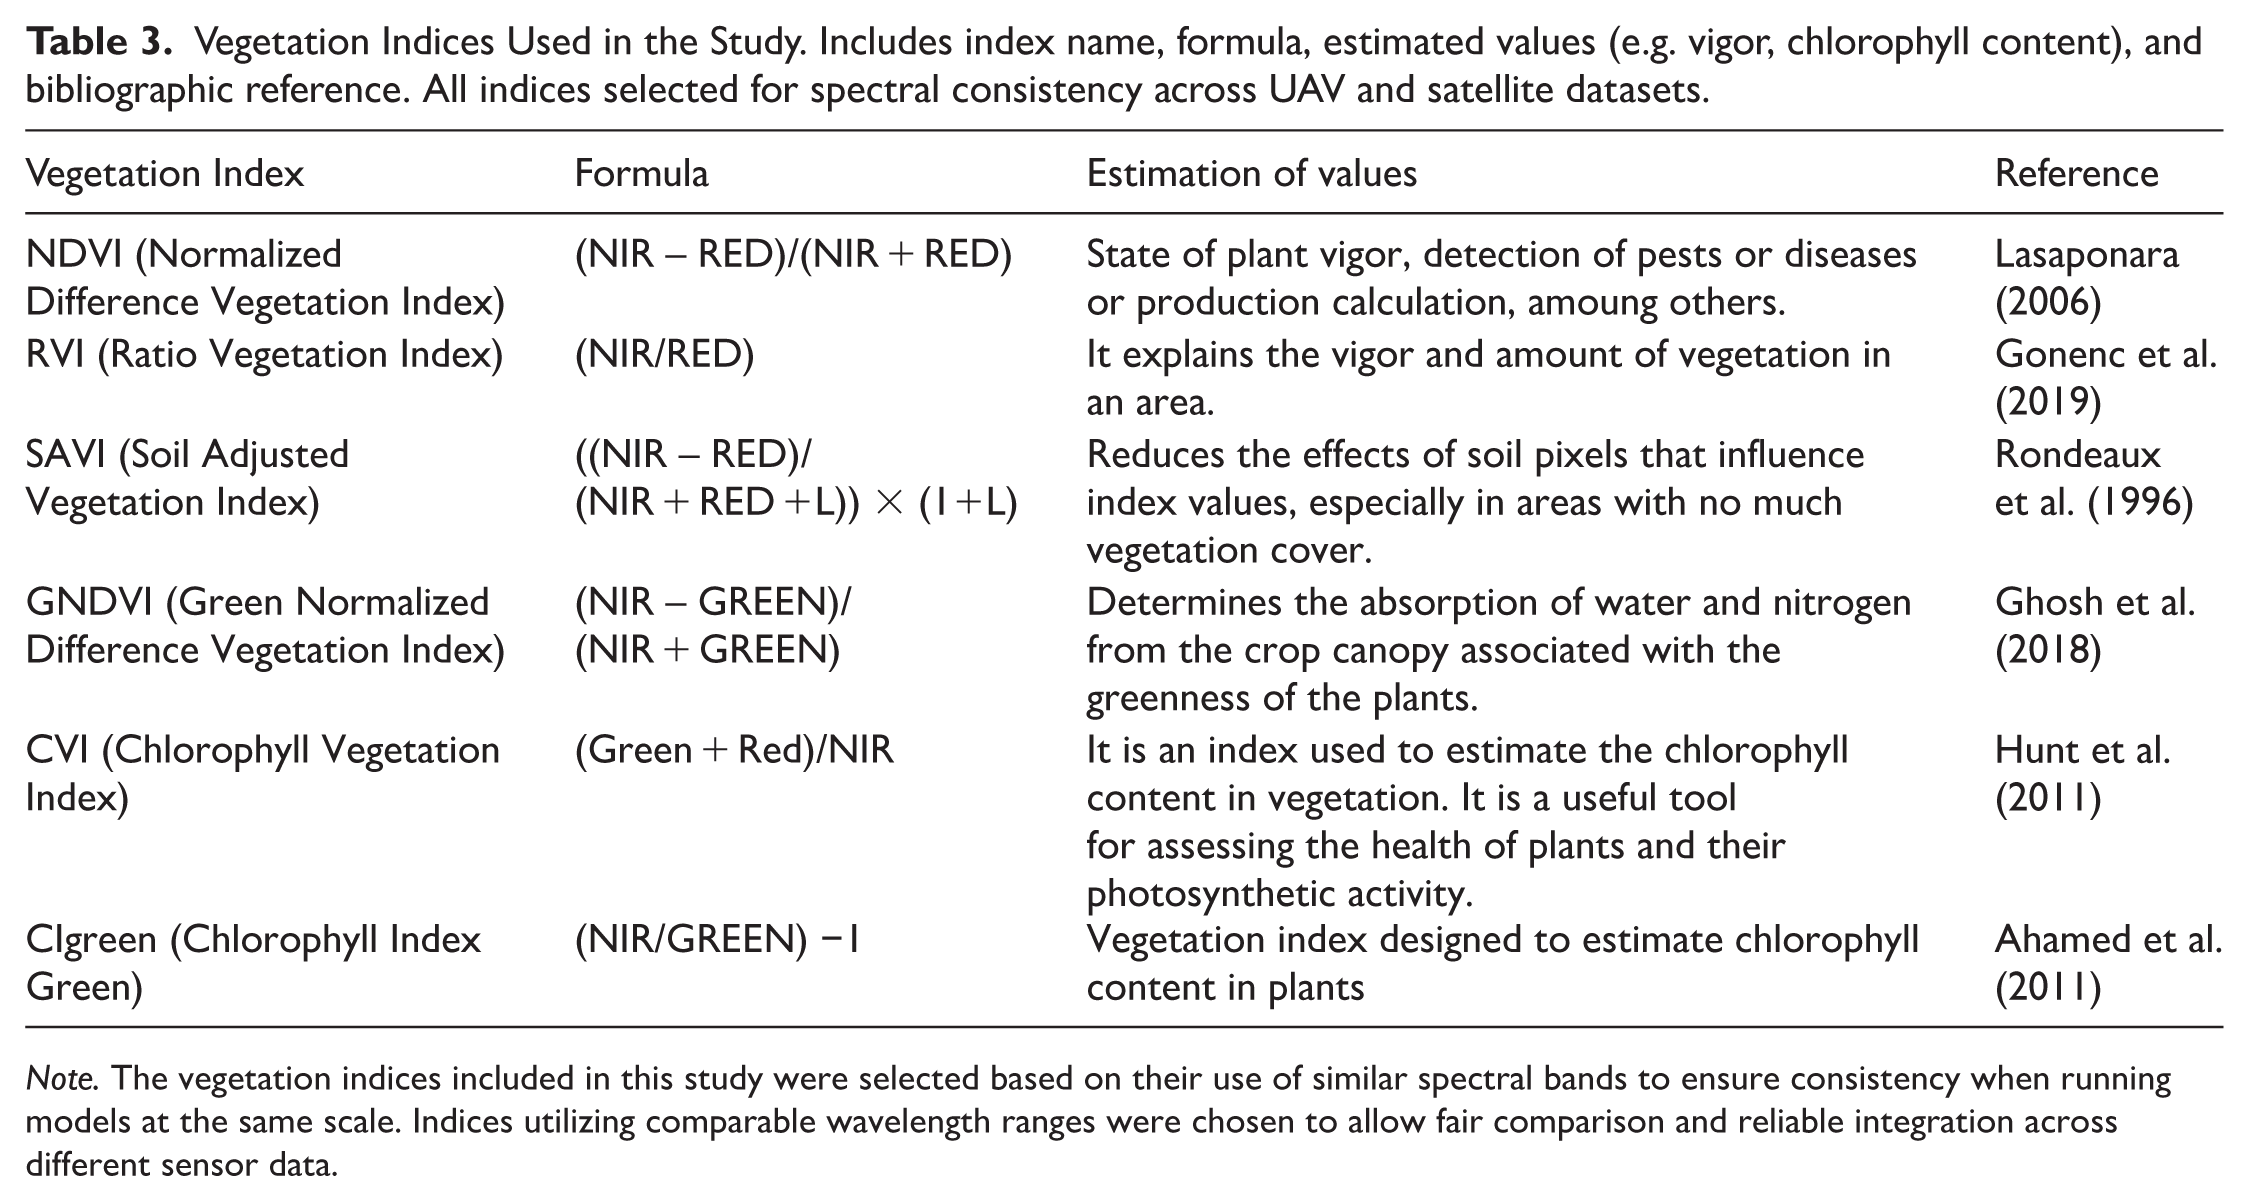
Note. The vegetation indices included in this study were selected based on their use of similar spectral bands to ensure consistency when running models at the same scale. Indices utilizing comparable wavelength ranges were chosen to allow fair comparison and reliable integration across different sensor data.
To ensure high geospatial fidelity and spatial correspondence, 75 Ground Control Points (GCPs) were established across the study area using an Emlid Reach RS2 GNSS receiver, achieving centimeter-level accuracy. These GCPs served as spatial references for the co-registration and geometric correction of both the high-resolution UAV orthophotograph and the multi-source satellite data (Sentinel-2 and PlanetScope), ensuring negligible spatial error across all platforms.
From the initial set of 75 control points, a subset of 70 spatially representative sampling points was selected for modeling, based on the stratified sampling strategy described in Section 2.2.3. At these 70 locations, three replicate measurements were collected across 25 distinct areas to reduce local variability, resulting in a total of 210 datasets per platform. Pixel values of the vegetation indices corresponding to these georeferenced points were subsequently matched with square-meter yield measurements, thereby enhancing the reliability and spatial generalizability of the machine learning models.
Regarding the SAVI index (Rondeaux et al., 1996), it complements NDVI by reducing the influence of soil brightness, which is a critical consideration in sparsely vegetated areas such as the study site. The L factor adjusts for soil influence, where values close to 0 denote high vegetation density and values close to 1 indicate low vegetation density (with 0.5 representing moderately exposed soil). In this study, an L factor of 1 was applied due to the absence of vegetation cover during the UAV flight.
Statistical Analysis for Vegetation Index Data
In this study, vegetation index values derived from three different sensors—Sentinel-2, UAV, and PlanetScope—were compared to assess whether significant differences existed among them. Using Minitab 17 software, descriptive statistics were calculated exclusively to summarize the fundamental distributional characteristics of each vegetation index (NDVI, SAVI, RVI, GNDVI, CI_green, and CVI) across the three sensor platforms (PlanetScope, Sentinel-2, and UAV).
Prior to parametric analyses, data normality was assessed using the Kolmogorov–Smirnov (KS) test in RStudio 4.3.1. The results indicated that the datasets followed a normal distribution (p > .05). Following this verification, Pearson correlation analysis was conducted in RStudio to quantify relationships among vegetation indices, and confidence intervals for the correlation coefficients were calculated at the .05, .01, and .001 significance levels (Demir & Başyiğit, 2023).
A one-way analysis of variance (ANOVA) was performed to evaluate differences in mean vegetation index values across sensors with varying spatial resolutions. Prior to ANOVA application, the assumptions of normality (Kolmogorov–Smirnov test) and homogeneity of variances (Levene’s test) were verified. When statistically significant differences were detected, Tukey’s Honest Significant Difference (HSD) post hoc test was applied to identify specific pairwise differences among sensor-derived values.
Additionally, skewness and kurtosis values across all platforms generally indicated that vegetation index data approximated a normal distribution. This statistical behavior supports the validity of applying parametric statistical methods and strengthens the robustness of the subsequent machine learning modeling strategies. The near-normal distribution of the data is particularly advantageous for predictive modeling and statistical inference in precision viticulture applications.
All statistical analyses were conducted at a 95% confidence level (p < .05; Ahamed et al., 2011; Demir & Çağ, 2025). Statistical analyses and selected descriptive statistics were performed using the Minitab 17 software package.
Descriptive Statistics
To clarify the structure of the statistical analysis presented in the manuscript, it is important to distinguish between the descriptive and inferential components of the workflow. Descriptive statistics (Table 5) were generated solely to summarize the basic distributional properties of each vegetation index (NDVI, SAVI, RVI, GNDVI, CI_green, and CVI) across the three sensor platforms (PlanetScope, Sentinel-2, and UAV). These metrics—sample size, minimum, maximum, mean, standard deviation, coefficient of variation, skewness, and kurtosis—were obtained in Minitab using Stat > Basic Statistics > Display Descriptive Statistics, with sensor type selected as the “By” variable (Figure 3). This table does not include or imply any hypothesis testing; therefore, no p-values, statistical tests, or test sidedness apply to Table 5.

Descriptive statistics output from Minitab 17 for vegetation indices.
Analysis of Variance
Before performing the analysis of variance, the assumptions of normality and homogeneity of variances were verified. In addition to formal assumption checks, the skewness and kurtosis values reported in the descriptive statistics (Table 5) were re-examined to ensure that the distributional characteristics of each vegetation index were consistent with normality requirements. After confirming that these prerequisites were satisfied, a two-sided test with a 95% confidence level was conducted using Type III adjusted sums of squares. The ANOVA was implemented in Minitab 17 without applying any Box–Cox transformation, and factor coding was set to (−1, 0, +1).
Using the General Linear Model (GLM) framework, Tukey’s Honest Significant Difference (HSD) post hoc test was employed (Figure 4) to perform pairwise comparisons among sensor groups. The complete inferential analysis—including verification of normality based on skewness–kurtosis diagnostics and model residual assessment, as well as homogeneity of variances—was conducted for each vegetation index prior to the ANOVA. Once these assumptions were confirmed, the two-sided ANOVA based on Type III adjusted sums of squares was performed within Minitab’s GLM framework.

General Linear Model (GLM) factor coding output in Minitab 17.
Subsequently, Tukey’s HSD post hoc test was applied to evaluate pairwise differences among sensor platforms. The full results of these analyses—including F-values, degrees of freedom, and corresponding p-values—are summarized in Table 6. For all vegetation indices, the computed p-values were <.001, indicating statistically significant differences among sensor platforms at the 95% confidence level.
A one-way analysis of variance (One-way ANOVA / GLM) was performed using a single factor, Sensor (three levels: PlanetScope, Sentinel-2, and UAV). Prior to the ANOVA, all prerequisite assumptions—including normality and homogeneity of variances—were thoroughly evaluated through formal tests, examination of model residuals, and a re-assessment of the skewness and kurtosis values presented in the descriptive statistics. Since these assumptions were satisfactorily met, no data transformation was applied.
Following this verification, a two-sided ANOVA with a 95% confidence level was conducted using Type III adjusted sums of squares in Minitab 17, with factor coding set to (−1, 0, +1). Tukey’s HSD post-hoc test was subsequently used to evaluate pairwise differences among sensor groups. The complete results—including F-values, degrees of freedom, and p-values—are summarized in Table 6, where all vegetation indices yielded a p-value of .000, indicating statistically significant differences among the three sensor platforms.
Machine Learning Approaches and Performance
In this study, predictive models for yield estimation were developed using datasets at three different spatial resolutions. Each dataset comprised the target variable Yield and 11 predictor variables: Elevation (m), Slope (%), Infiltration (mm s-1), Organic Matter (%), Soil pH, NDVI (Normalized Difference Vegetation Index), SAVI (Soil-Adjusted Vegetation Index), RVI (Ratio Vegetation Index), GNDVI (Green Normalized Difference Vegetation Index), CI_green (Chlorophyll Index Green), and CVI (Chlorophyll Vegetation Index). The objective of this study was to develop vineyard yield prediction models using machine learning algorithms, specifically Decision Tree (DT), K-Nearest Neighbors (KNN), Support Vector Machine (SVM), and Random Forest (RF). These models were trained using data from three different remote sensing platforms: Sentinel-2, PlanetScope, and UAVs. Data collected from these platforms consisted of multispectral imagery, which was processed to generate vegetation indices. These indices, together with additional soil property data, formed the basis for grapevine yield prediction.
Model training was performed using 70% of the dataset, while the remaining 30% was reserved for model evaluation (Demir et al., 2024). Multiple machine learning algorithms—including KNN, SVR, DT, and RF—were implemented using the Weka software package (version 3.8.6). All models were optimized using consistent parameter settings across datasets to enable comparative performance analysis. The machine learning models were configured with the following specifications: (i) KNN: Implemented using the IBk classifier with k = 1. Inverse distance weighting was applied to assign greater influence to closer neighbors, and LinearNNSearch with Euclidean distance was used as the distance metric. (ii) SVR: Implemented using the SMOreg algorithm with a Radial Basis Function (RBF) kernel. Model parameters were set to C = 10.0 and gamma = 0.01. Training was conducted using a 70% training and 30% testing data split. (iii) DT: Implemented using the RandomTree algorithm. All available attributes were considered at each split (K = 0), with the minimum number of instances per leaf set to 1 and the minimum variance proportion set to 0.001. Bagging was enabled to reduce overfitting, and a fixed random seed was used to ensure reproducibility. (iv) RF: Implemented using the RandomForest algorithm. The model was configured to build 100 trees, with no restriction on maximum tree depth and all attributes considered at each node. Out-of-bag (OOB) error estimation and feature importance calculation were enabled. A fixed seed (seed = 1) was assigned to control the random number generator, ensuring consistent results across runs. The fixed-seed approach refers to manually specifying a constant integer so that all stochastic processes within the model—including bootstrap sampling, random feature selection at each split, and tree construction—follow the same sequence of random numbers in every run. This procedure guarantees reproducibility of tree structures, OOB error estimates, feature importance scores, and predicted values and is widely recommended in machine learning experiments (Demir & Çağ, 2025).
The overall objective was to develop robust, scalable, and generalizable predictive models that can be applied to similar datasets across different spatial resolutions without requiring extensive domain-specific expertise. The selected predictor variables—including elevation (m), slope (%), infiltration (mm s-1), soil properties, and vegetation indices—provided the basis for yield prediction model development (see Table 3 for details). These variables were integrated into a comprehensive dataset derived from satellite and UAV imagery, together with local field measurements, to ensure detailed and robust yield prediction.
Model performance was evaluated using four commonly applied regression metrics: Pearson’s correlation coefficient (r): Measures the strength and direction of the linear relationship between observed and predicted values.
Mean Absolute Percentage Error (MAPE): Represents the average absolute percent difference between predicted and actual values, indicating relative accuracy.
Mean Absolute Error (MAE): Provides the average of the absolute differences between predicted and observed values, reflecting overall prediction error in original units.
Root Mean Squared Error (RMSE): Calculates the square root of the average squared differences between predicted and actual values, penalizing larger errors more heavily.
These metrics allowed for the assessment of model accuracy and comparison between different algorithms. The use of RStudio version 4.3.1. and Weka version 3.8.6 facilitated the development and training of the machine learning models. The mathematical formulations and definitions of these metrics are available in Demir et al. (2024).
After model evaluation, correlation matrix plots were used to visually compare the prediction quality of the different models. This approach provides a clear representation of the relationships between environmental and vegetative variables and the model-predicted values, facilitating interpretation of the factors that most strongly influence vineyard productivity. In addition, the correlation matrices enabled a comparative assessment of the performance of different algorithms, supporting the selection of the most suitable model for yield prediction. This strategy is particularly effective when integrating data from satellites, UAVs, and field measurements, as it supports informed decision-making in agricultural management (Pogačar et al., 2022; Taşan et al., 2024; Uppalapati et al., 2025).
Compared with previous empirical approaches in viticulture, the methodology proposed in this study integrates multispectral data from UAV and satellite platforms with detailed soil and topographic information, combined with advanced machine learning algorithms for yield prediction. This multi-source framework enables high-resolution mapping of intra-vineyard variability and captures fine-scale heterogeneity that is not detectable using conventional satellite-only methods. At the regional scale, the proposed approach offers a scalable decision-support tool for Mediterranean vineyards, facilitating the extrapolation of predictive models to other plots with similar environmental and management conditions. By combining accessible digital tools, a rigorous sampling design, and robust statistical and machine learning techniques, this methodology provides both a scientific contribution and a practical solution for precision viticulture, supporting site-specific management and resource optimization.
Operational Analysis for Precision Agriculture Users
Beyond the technical performance and the spatial or temporal resolution of imagery acquired from UAVs and satellites, it is essential to consider the operational demands associated with each approach. A comparative analysis was conducted to evaluate the time and economic resources required for data acquisition, processing, and analysis across both platforms. The matrix presented in Table 4 includes not only the hours devoted to flight planning, documentation management, and equipment preparation in the case of UAV operations, but also distinguishes between direct processing—defined as the active time required to configure software parameters prior to execution—and indirect processing, referring to the time the computer system autonomously requires to complete processing, assuming a medium-performance workstation. Additional components, such as data download, post-processing, integration with other data sources, and result interpretation, are also considered.
Time and Resource Requirements for Data Acquisition, Processing, and Analysis Across UAV and Satellite Platforms.
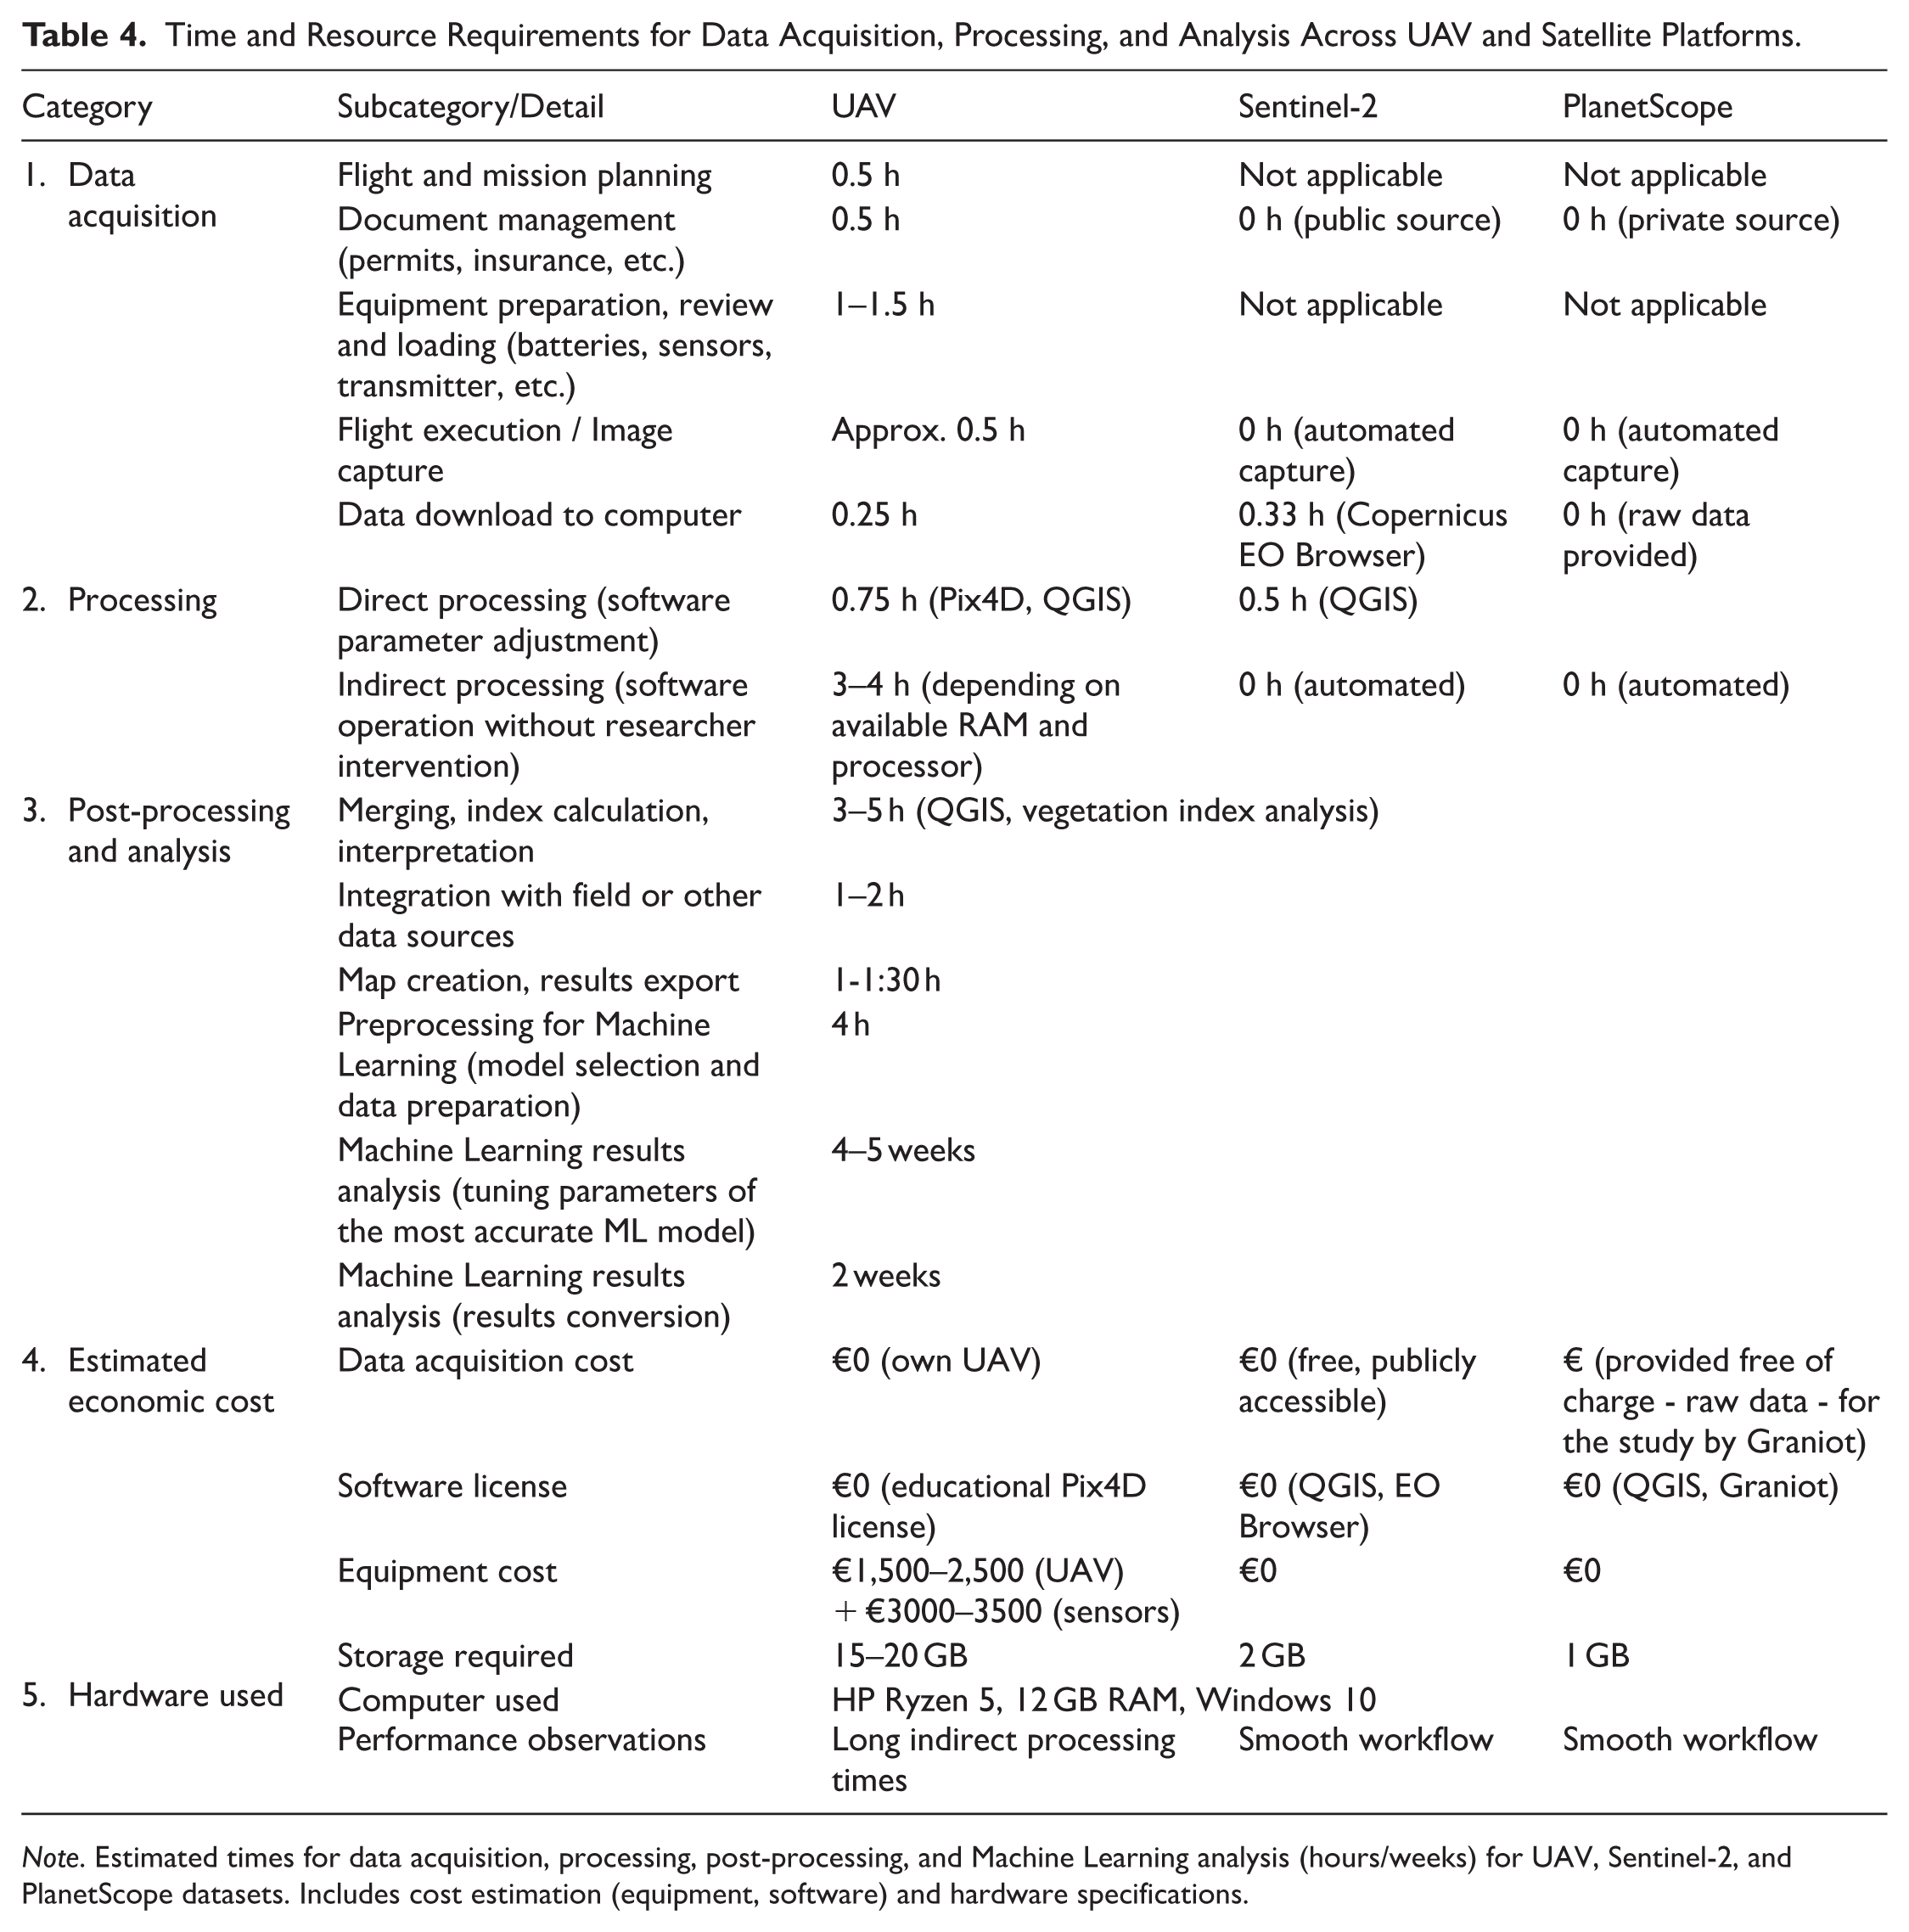
Note. Estimated times for data acquisition, processing, post-processing, and Machine Learning analysis (hours/weeks) for UAV, Sentinel-2, and PlanetScope datasets. Includes cost estimation (equipment, software) and hardware specifications.
To ensure reproducibility, transparency, and scientific rigor, this study deliberately employed widely used and well-established machine learning algorithms. The primary objective was to evaluate whether predictive modeling approaches based on artificial intelligence and machine learning can reliably estimate vineyard yield when derived from remote sensing data with varying spatial resolutions. By integrating vegetation indices obtained from Sentinel-2, UAV, and PlanetScope platforms with ground-based measurements, the study provides a multi-scale assessment of the feasibility of AI-driven yield prediction. The extended duration of the data preparation process reflects the combined effort required for field data collection, laboratory analyses, and the harmonization of multisource remote sensing datasets. This integrated workflow was essential to accurately align ground measurements with spatial imagery and to minimize biases introduced during preprocessing. Detailed documentation of these procedures enhances methodological traceability and strengthens the reproducibility of the findings.
Furthermore, the predictive models developed in this study were trained using variables that are commonly available or easily derivable in other viticultural regions. Because both the feature set and the modeling workflow rely on generalizable parameters, the models have potential applicability beyond the study area. This allows other researchers and practitioners to replicate the analysis, adapt the models to their own datasets, or extend the methodology to different agroecological contexts.
The methodological choices were guided by the central research question: Can machine learning and artificial intelligence techniques, when powered by remote sensing data of varying spatial resolutions, be effectively used to estimate vineyard yield? The modeling strategy, data integration framework, and variable selection were all designed to address this question systematically. By employing widely accepted machine learning models and maintaining a transparent workflow, this study provides robust evidence of the operational potential of AI-based yield prediction in precision viticulture. The modeling strategy, data integration steps, and algorithm selection were aligned with the overarching objective of determining whether machine learning and AI-based approaches can be reliably applied to vineyard yield estimation using remote sensing data at multiple spatial resolutions. This structured and reproducible framework strengthens both the scientific contribution and the practical relevance of the study.
Results
UAV and Satellite Images
Figure 5 presents the high-resolution aerial orthophotograph generated from UAV imagery, with the spatial distribution of the 70 Ground Control Points (GCPs) superimposed. In addition, Figure 5B shows the Digital Surface Model (DSM) derived from the UAV data, providing a detailed representation of topographic variation within the vineyard plot. These elevation data were critical for interpreting vegetation indices and for contextualizing soil-related patterns identified in subsequent analyses. The terrain shows a slight elevation gradient from south to north, with elevations ranging from 740.16 to 722.50 m. At the time of UAV acquisition, no vegetation cover was present between the vine rows, which is clearly visible in the aerial imagery (Figure 5A) and is relevant for interpreting the recorded spectral responses.

(A) UAV data overview. (A) High-resolution RGB aerial photograph of the vineyard. (B) Digital Surface Model (DSM) in meters; minimum elevation 722.04 m, maximum 740.16 m. Date of acquisition: July 27th, 2022.
Figures 6 to 8 present composite maps of vegetation indices derived from satellite imagery (Sentinel-2 and PlanetScope) and UAV data. These indices enable a quantitative assessment of vine vigor and leaf chlorophyll content during the final ripening stage. Furthermore, the spatial distribution of vegetation index values facilitates the analysis of relationships between vegetation patterns and site-specific soil characteristics, such as slope, soil composition, and moisture.

(A) Vegetation index map generated from UAV data. (A) NDVI (Normalized Difference Vegetation Index), (B) RVI (Ratio Vegetation Index), (C) SAVI (Soil Adjusted Vegetation Index), (D) GNDVI (Green Normalized Difference Vegetation Index), (E) CVI (Chlorophyll Vegetation Index), and (F) CIgreen (Chlorophyll Index Green). Date of acquisition: July 27th, 2022.

(A) Vegetation index map generated from Sentinel-2. (A) NDVI (Normalized Difference Vegetation Index), (B) RVI (Ratio Vegetation Index), (C) SAVI (Soil Adjusted Vegetation Index), (D) GNDVI (Green Normalized Difference Vegetation Index), (E) CVI (Chlorophyll Vegetation Index), and (F) CIgreen (Chlorophyll Index Green). Date of acquisition: July 27th, 2022.

(A) Vegetation index map generated from PlanetScope. (A) NDVI (Normalized Difference Vegetation Index), (B) RVI (Ratio Vegetation Index), (C) SAVI (Soil Adjusted Vegetation Index), (D) GNDVI (Green Normalized Difference Vegetation Index), (E) CVI (Chlorophyll Vegetation Index), and (F) CIgreen (Chlorophyll Index Green). Date of acquisition: July 27th, 2022.
In addition, Figure 5B presents the Digital Surface Model (DSM) derived from the UAV data, providing a detailed representation of topographic variation within the plot. These elevation data were critical for interpreting vegetation indices and for contextualizing soil-related patterns observed in subsequent analyses. The terrain exhibits a slight elevation gradient from south to north, with elevations ranging from 740.16 to 722.50 m. At the time of UAV acquisition, no vegetation was present between the vine rows, which is clearly visible in the aerial imagery (Figure 5A) and is relevant for interpreting the recorded spectral values. Figures 6 to 8 show composite maps of vegetation indices derived from satellite imagery (Sentinel-2 and PlanetScope) and UAV data. These indices enable a quantitative assessment of vine vigor and leaf chlorophyll content during the final ripening stage. The spatial distribution of vegetation index values also facilitates the correlation of vegetation variability with specific soil characteristics, such as slope, soil composition, and moisture.
As shown in Table 5, vegetation indices derived from UAV, Sentinel-2, and PlanetScope imagery exhibit notably different statistical properties, reflecting variations in spatial resolution and sensor characteristics. Among these platforms, UAV-derived data present the highest coefficients of variation (CV%), particularly for indices such as SAVI (37.07%) and CVI (27.84%). These elevated CV% values indicate a substantial degree of fine-scale heterogeneity captured by the high spatial resolution of UAV imagery. The maps generated from UAV, Sentinel-2, and PlanetScope data reveal clear spatial variability in vegetation status across the study area, as indicated by key vegetation indices (NDVI, SAVI, RVI, GNDVI, CI_green, and CVI). Higher index values consistently correspond to healthier and denser vegetation, whereas lower values indicate sparse or stressed plants. Collectively, these indices reflect vegetation health, biomass, and chlorophyll content: higher values are generally associated with healthier canopies and increased photosynthetic activity, while lower values suggest stress, sparse cover, or nutrient deficiencies. UAV-derived maps, owing to their finer spatial resolution, capture detailed variability at the plot scale and are therefore well suited for precision management applications (Figure 6). In contrast, Sentinel-2 and PlanetScope maps provide broader spatial coverage appropriate for regional monitoring, albeit with reduced spatial detail (Figures 7 and 8).
Descriptive Statistics of Vegetation Indices Derived From Multispectral Data Over Vineyard Parcels.
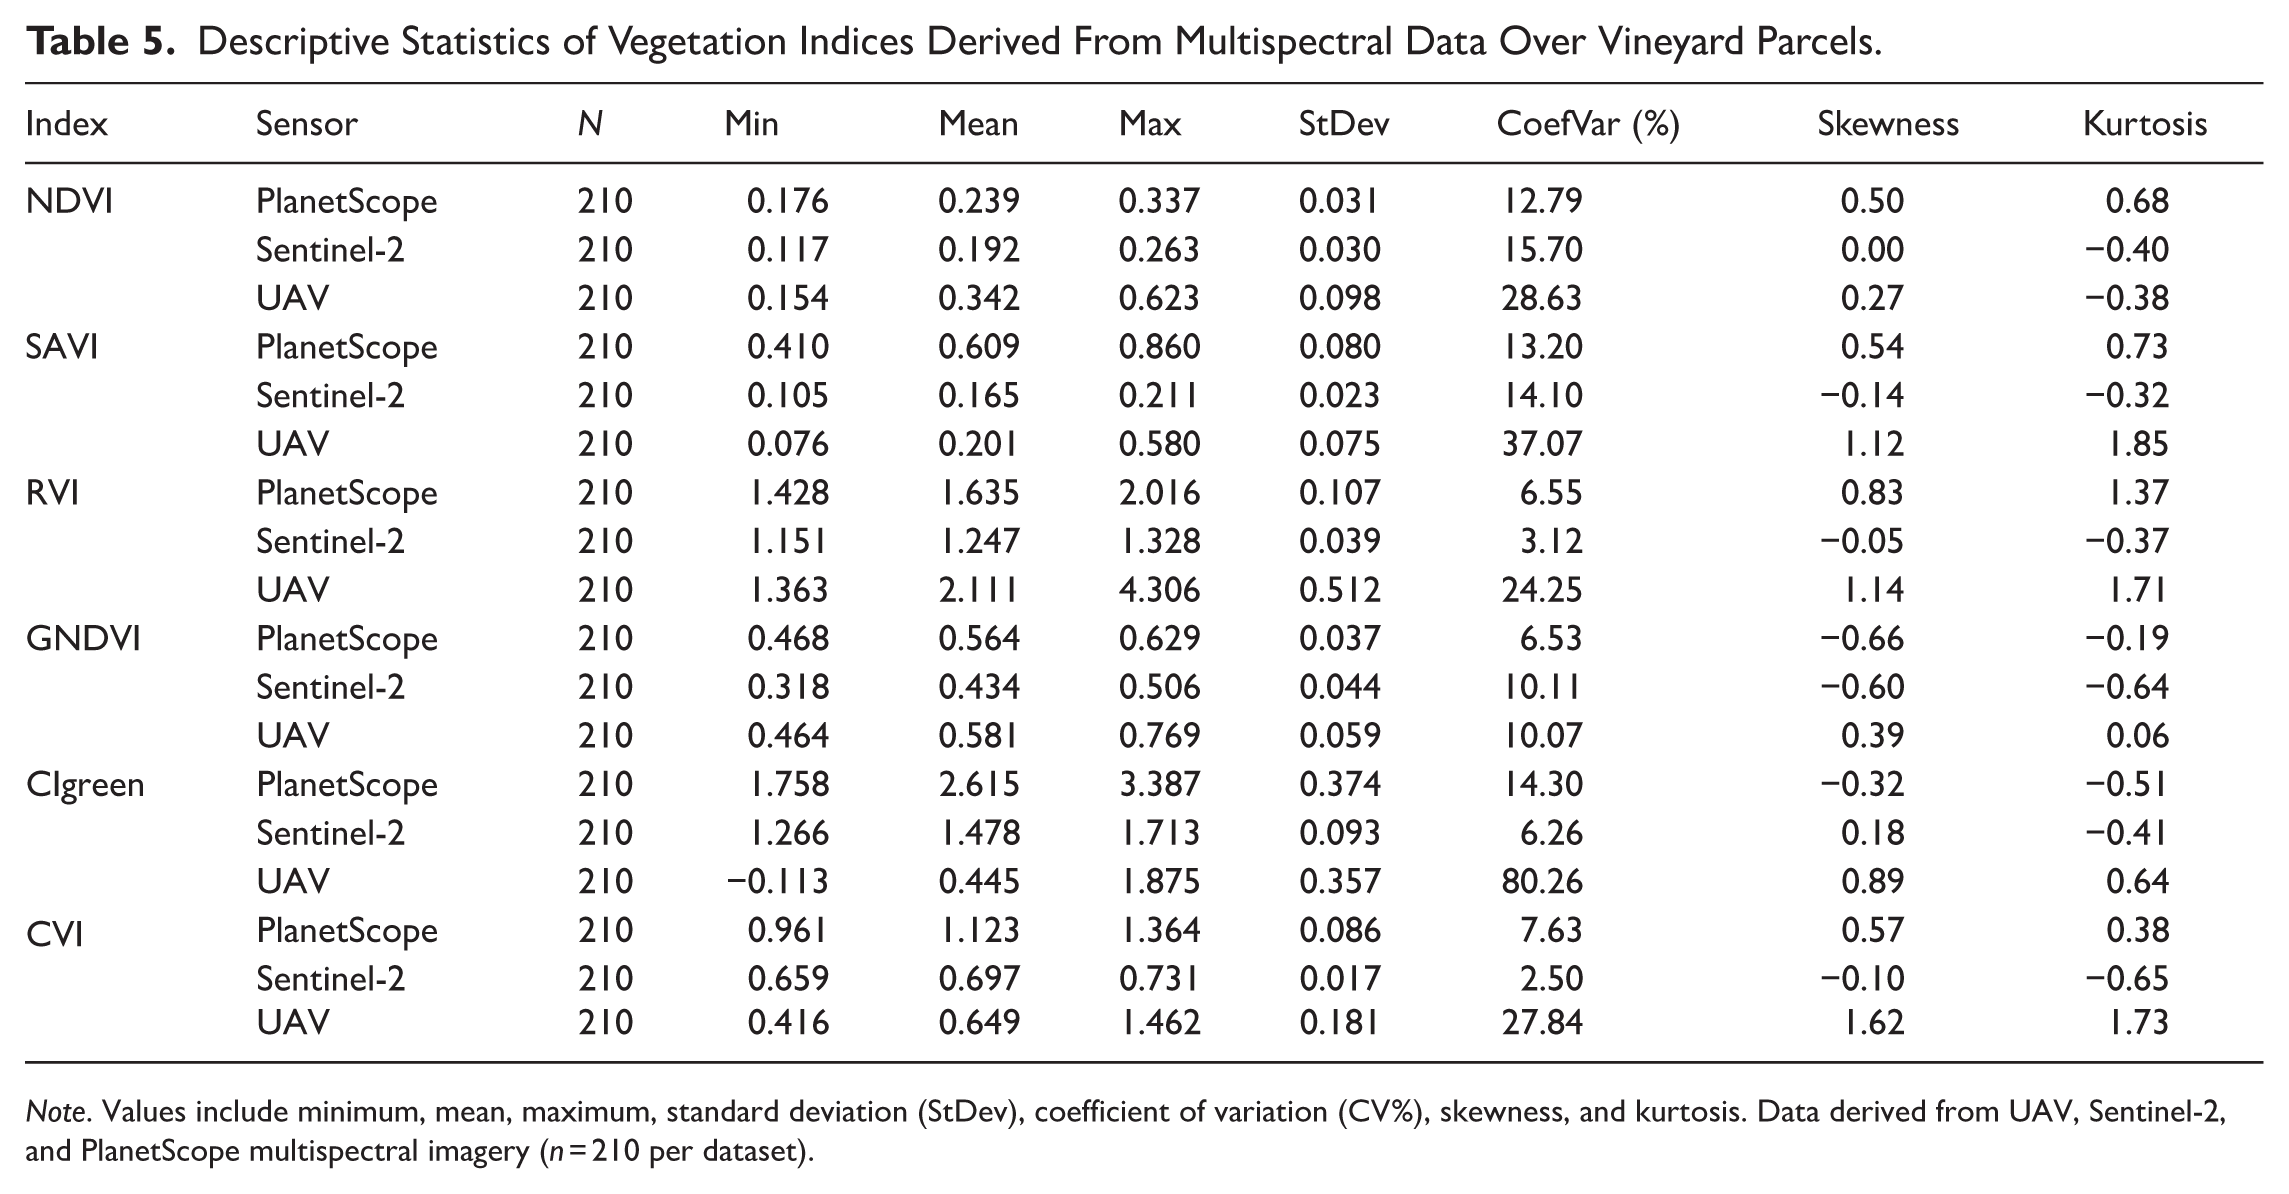
Note. Values include minimum, mean, maximum, standard deviation (StDev), coefficient of variation (CV%), skewness, and kurtosis. Data derived from UAV, Sentinel-2, and PlanetScope multispectral imagery (n = 210 per dataset).
Analysis of variance (ANOVA) revealed statistically significant differences (p < .05) in vegetation index values derived from the different multispectral sensors (UAV, Sentinel-2, and PlanetScope; Table 6). As indicated by the post hoc grouping (denoted by different uppercase letters), UAV data produced the highest mean NDVI (0.342 ± 0.007) and GNDVI (0.581 ± 0.004) values, reflecting its high spatial resolution and sensitivity to canopy characteristics. Conversely, PlanetScope yielded the highest SAVI (0.609 ± 0.006), CI_green (2.615 ± 0.026), and CVI (1.123 ± 0.006) values, suggesting enhanced performance in detecting chlorophyll-related attributes. Sentinel-2 values were generally intermediate or the lowest across most indices, including NDVI (0.192 ± 0.002) and SAVI (0.165 ± 0.002).
Analysis of Variance (ANOVA) Results for Vegetation Indices Derived From Datasets With Different Spatial Resolutions (n = 210 for Each Resolution).
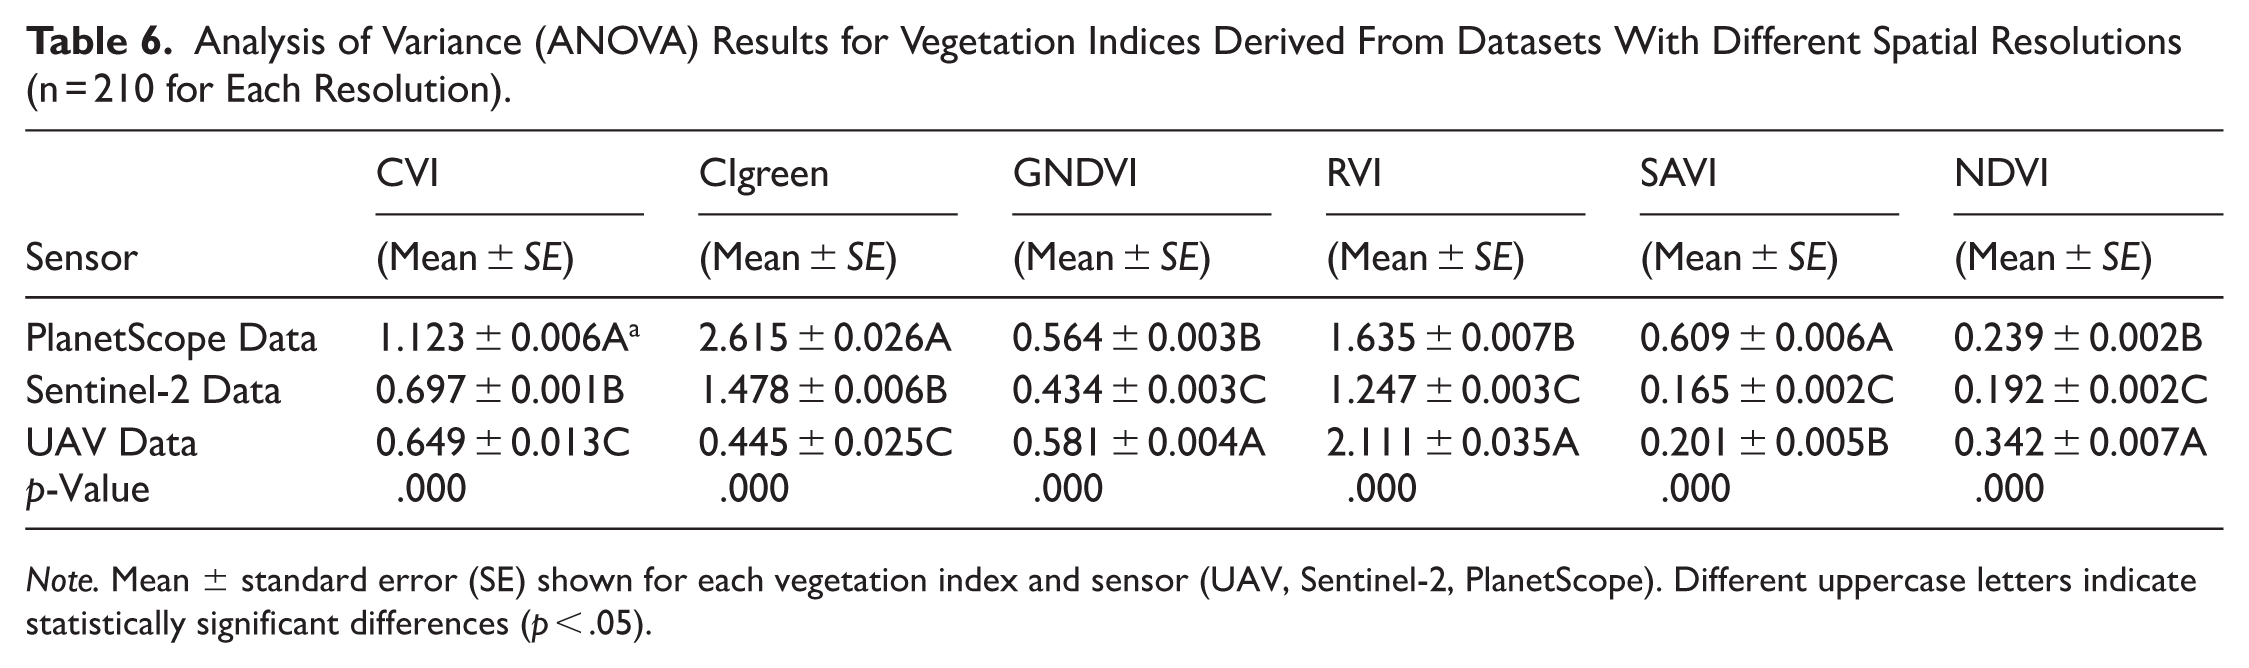
Note. Mean ± standard error (SE) shown for each vegetation index and sensor (UAV, Sentinel-2, PlanetScope). Different uppercase letters indicate statistically significant differences (p < .05).
Modeling the Relationship Between Pedological, Topographical, and Vegetative Variables Using Machine Learning Algorithms
Figure 9 presents the correlation matrices corresponding to UAV, Sentinel-2, and PlanetScope imagery, illustrating the relationships between environmental variables, vegetation indices, and vineyard yield. All three sensors (UAV, Sentinel-2, and PlanetScope) exhibit a highly consistent correlation structure. In all cases, the edaphic variables show positive correlations with yield. Slope is the variable most strongly associated with yield (r ≈ .68), followed by soil organic matter (r ≈ .44), while infiltration shows a weaker positive relationship (r ≈ .21). These correlation values are nearly identical across the three datasets, indicating that the influence of soil conditions on yield is stable regardless of the sensor employed.

Correlation matrices between environmental variables and vegetation indices obtained from UAV, Sentinel-2, and PlanetScope imagery.
In contrast, all spectral indices display negative correlations with yield, with magnitudes ranging from 0 to −0.36. RVI consistently exhibits the strongest negative correlations across sensors, followed by SAVI, CVI, NDVI, and GNDVI, although differences among platforms are minor. Despite these variations, the overall behavior of the vegetation indices remains coherent across sensors. Internal correlations among indices are also high, particularly for NDVI, SAVI, and RVI, with correlation coefficients exceeding r > .85 for all sensors. This pattern confirms both the spectral redundancy and the similarity in the response of classical vegetation indices, independent of the image source.
Validation Considering Different Machine Learning Models
The models were trained using 70% of the dataset (141 instances) and evaluated on the remaining 30% (63 instances). Predictions on the test set are summarized in Table 7, which reports the observed and predicted values together with the corresponding errors for each instance. Table 7 also presents the comparative performance metrics of four machine learning algorithms—KNN, SVM, DT, and RF—applied to PlanetScope-, Sentinel-2-, and UAV-derived datasets. Model performance was assessed using Pearson’s correlation coefficient (r), Mean Absolute Percentage Error (MAPE), Mean Absolute Error (MAE), and Root Mean Squared Error (RMSE).
Machine Learning Model Performance Metrics.
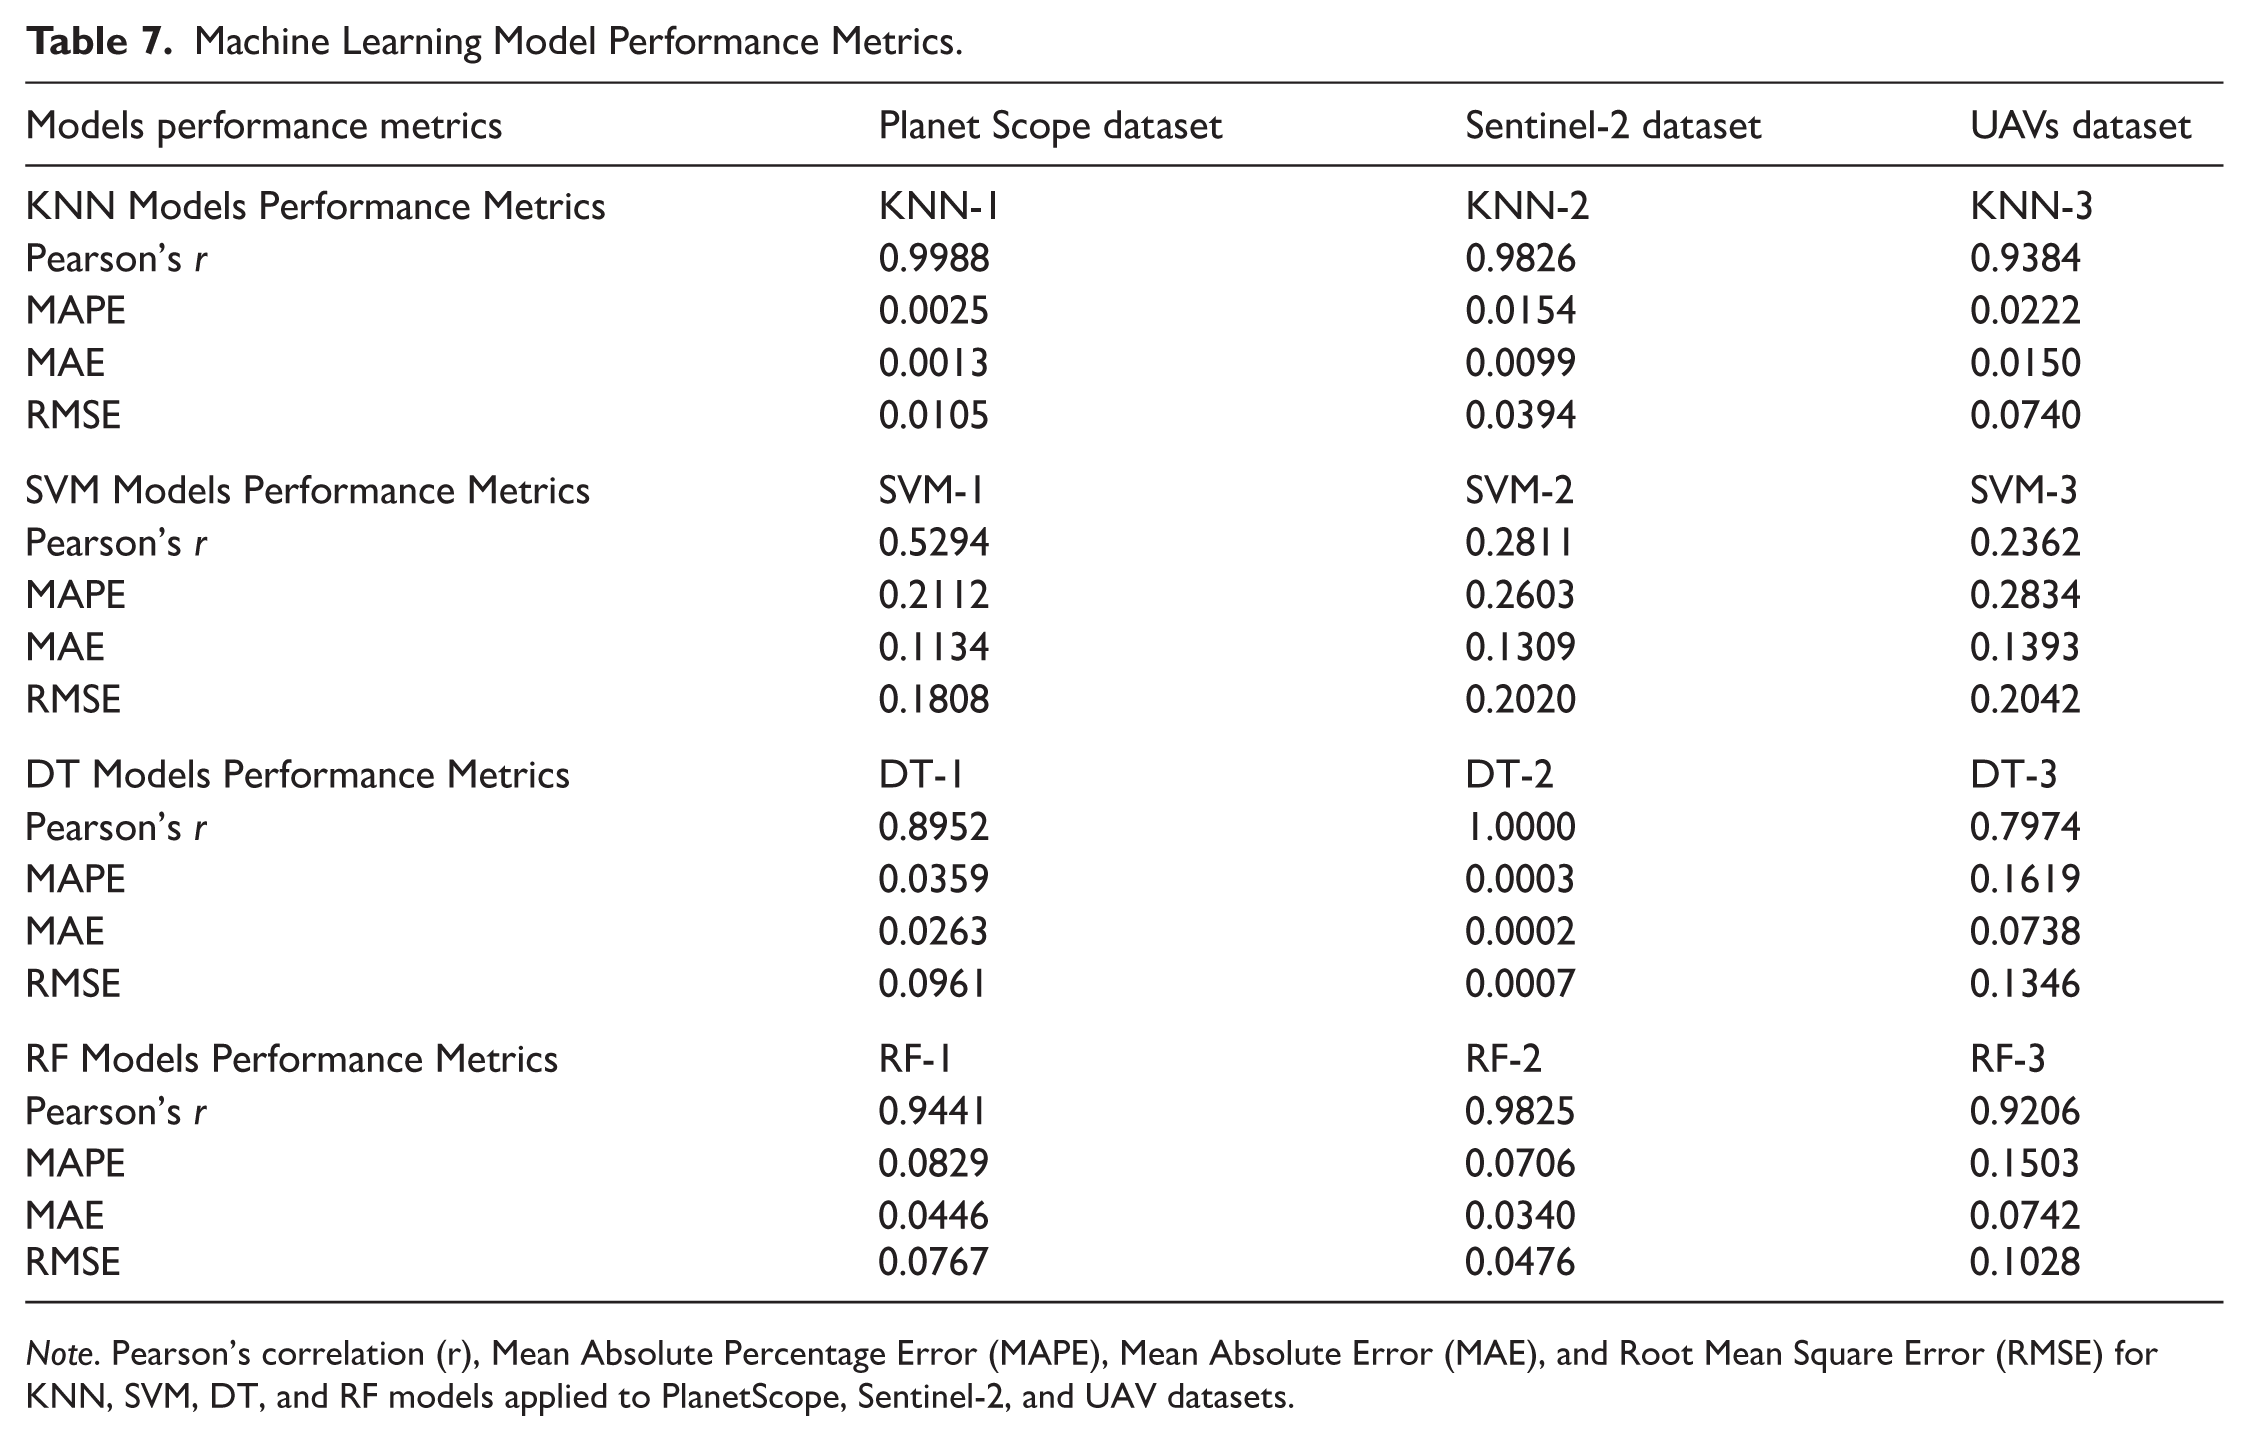
Note. Pearson’s correlation (r), Mean Absolute Percentage Error (MAPE), Mean Absolute Error (MAE), and Root Mean Square Error (RMSE) for KNN, SVM, DT, and RF models applied to PlanetScope, Sentinel-2, and UAV datasets.
Among the evaluated models, the KNN algorithm consistently demonstrated superior performance across all datasets, achieving the highest Pearson’s r values (.9988 for PlanetScope, .9826 for Sentinel-2, and .9384 for UAV data) together with the lowest error metrics. In particular, KNN-1 yielded near-perfect performance on the PlanetScope dataset, with an MAPE of 0.0025, MAE of 0.0013, and RMSE of 0.0105, highlighting its effectiveness when applied to high-resolution optical imagery with minimal noise. In contrast, the SVM models exhibited the weakest predictive performance across all platforms. Their correlation coefficients were markedly lower (ranging from .2362 to .5294) and were associated with higher error values. These results suggest that, under the applied preprocessing procedures and parameter settings, SVM models were less effective at capturing the complex spectral and structural patterns present in vineyard data.
The DT model achieved a perfect correlation (r = 1.000) on the Sentinel-2 dataset (DT-2), with almost negligible prediction error (MAPE = .0003). This exceptionally high performance likely reflects model overfitting to the specific characteristics of the dataset. In contrast, DT-3, trained on UAV-derived data, showed reduced performance (r = .7974), indicating greater sensitivity to spatial resolution and intra-parcel variability. The RF models produced consistently robust results across all platforms. Performance was particularly strong for the Sentinel-2 (r = .9825, RMSE = 0.0476) and PlanetScope (r = .9441, RMSE = 0.0767) datasets. The ensemble-based learning structure of RF enhanced generalization compared with single-tree approaches, maintaining high predictive accuracy even for the more heterogeneous UAV-derived data (RF-3: r = .9206).
Regarding the evaluation of the machine learning models, the results indicate that the K-Nearest Neighbors (KNN) algorithm outperformed the other approaches across all datasets. Specifically, KNN achieved the highest accuracy when applied to PlanetScope imagery (r = .9988, RMSE = 0.0105), followed by Sentinel-2 imagery (r = .9826) and UAV-derived imagery (r = .9384). These results indicate that KNN was the most effective model for vineyard yield prediction, particularly when higher-resolution imagery was used.
Among the remaining algorithms, Random Forest (RF) demonstrated strong performance, especially when applied to Sentinel-2 data, achieving an r value of .9825 and an RMSE of .0476. Decision Tree (DT) models showed exceptionally high accuracy with Sentinel-2 imagery, reaching a perfect correlation coefficient (r = 1.0000) and a very low RMSE (.0007). In contrast, Support Vector Machine (SVM) models consistently underperformed across all datasets, yielding lower accuracy and higher RMSE values than the other algorithms.
Discussion
Comparison Between Satellite Images and UAV Images
The results highlight clear and logical differences between UAV, PlanetScope, and Sentinel-2 imagery, primarily driven by sensor spatial resolution. UAV-derived data exhibited the highest coefficients of variation (CV%), particularly for SAVI and CVI, confirming their superior ability to capture fine-scale spatial variability within the vineyard. This pattern (UAV CV% > Sentinel-2 CV%) is consistent with previous findings showing that Sentinel-2 imagery tends to underestimate canopy heterogeneity due to its coarser 10 m pixel size (Khaliq et al., 2019).
This limitation does not diminish the relevance of Sentinel-2 data, which remain essential for high-frequency monitoring and regional-scale analysis (Di Gennaro et al., 2019; Ortuani et al., 2024). The comparatively lower NDVI and SAVI values observed for Sentinel-2 reflect the well-known mixed-pixel effect in vineyards (Vallone et al., 2023), where spectral signals are strongly influenced by exposed soil between vine rows. Consequently, Sentinel-2 imagery is more suitable for capturing general spatial trends or advanced stress symptoms rather than detailed within-plot variability.
PlanetScope imagery provides an intermediate solution. Its 3 m spatial resolution reduces the averaging effects observed in Sentinel-2 data and improves row-level differentiation (Bhakta et al., 2019). This improvement is reflected in the superior performance of PlanetScope-based machine learning models, confirming that medium spatial resolution substantially enhances predictive capability compared with coarser satellite imagery.
Conversely, UAV imagery delivers the highest accuracy and spatial reliability. Previous reviews have emphasized the effectiveness of UAVs for canopy characterization and their capacity to capture topographic influences on vine vigor (Vera-Esmeraldas et al., 2025). In this study, UAV data revealed higher vigor in elevated areas with gentle slopes, a pattern consistent with agronomic evidence reported in similar vineyard systems (Govi et al., 2024; Pena et al., 2021). Furthermore, UAVs enable the generation of detailed cartographic products, such as Digital Terrain Models and contour maps (Hassija et al., 2021), which support topography-driven, site-specific management strategies, including variable-rate irrigation and early stress detection (J. Rodrigo-Comino et al., 2026).
The proposed methodology integrates low-, medium-, and very-high-resolution imagery to monitor Mediterranean woody crops by aligning data acquisition with key phenological stages. UAV flights were strategically conducted during the ripening phase, providing high-detail information at a critical decision-making moment. The integration of Sentinel-2, PlanetScope, and UAV data enriches spatial analysis and enables inter-seasonal comparisons, which are particularly relevant in trellised vineyards where coarse-resolution pixels are strongly affected by exposed soil.
From an economic perspective, operational constraints remain significant. UAV flights should be reserved for targeted diagnostic purposes (González-Moreno & Rodrigo-Comino, 2025), while satellite imagery can be effectively used for routine monitoring, anomaly detection, and flight planning (Murugan et al., 2017). Emerging very-high-resolution satellite platforms (e.g. SkySat, Pléiades Neo) and UAV-mounted hyperspectral sensors offer promising opportunities for more precise vegetation assessment, although their widespread adoption will depend on cost considerations and integration with predictive agronomic models.
Long-Term Approaches as a Tool to Support Farmers’ Decision-Making
Long-term monitoring based on the combined use of UAV and satellite imagery supports strategic vineyard management by integrating high spatial detail with broad temporal coverage (Matese & Di Gennaro, 2015; Sandonís-Pozo et al., 2024). This multi-scale approach enhances monitoring accuracy and provides valuable information to guide operational decisions throughout the growing season (Campos et al., 2021; Deng et al., 2018).
Vegetation indices such as NDVI require careful interpretation, as higher index values do not necessarily correspond to increased yield or improved fruit quality due to complex agronomic and environmental interactions (Mazzia et al., 2020). Consequently, the integration of remote sensing data with expert field knowledge is essential for meaningful interpretation and for developing precision agriculture protocols adapted to diverse management systems (Bazrafkan et al., 2025; Maimaitijiang et al., 2020).
The integration of remote sensing data with machine learning techniques creates new opportunities for advanced decision-support systems. Supervised algorithms, including Random Forest, Support Vector Machines, and neural networks, enable the classification of vigor zones, detection of disease symptoms, and prediction of moisture patterns (Gutiérrez et al., 2018). These models benefit from the spatial detail provided by UAV imagery and the temporal continuity offered by satellite data. When trained with historical yield information and topographic variables, they facilitate accurate forecasting and optimized input management, enabling a transition from reactive to predictive viticulture (Demir et al., 2024).
Within this framework, KNN and RF demonstrated high predictive reliability, particularly when higher-resolution datasets (PlanetScope and UAV) were used, compared with lower-resolution imagery such as Sentinel-2. This finding underscores the importance of spatial detail for yield estimation accuracy. By combining historical yield data, topographic features, and vegetation indices, machine learning models can forecast crop performance and optimize resource allocation with high precision. The synergy between machine learning and Earth observation data thus reduces uncertainty and contributes to more sustainable vineyard management (Demir et al., 2024).
Ultimately, the complementarity between UAVs and satellite platforms provides a robust and continuous data foundation for decision-making. This approach facilitates optimized field inspections, early identification of underperforming areas, and the implementation of site-specific treatments based on topographic variability, resulting in cost savings and improved environmental sustainability.
Cost and Effort Analysis of UAV and Satellite Imagery Workflows
Previous studies have highlighted the importance of economic evaluations when adopting remote sensing technologies (Pánková et al., 2020). The present analysis, grounded in practical experience, demonstrates that costs and operational effort are strongly influenced by UAV type, sensor configuration, and institutional resources (Cambronero et al., 2025).
UAV monitoring provides highly detailed spatial information but requires significant operational effort, including flight planning, data acquisition, and intensive processing. In contrast, satellite imagery offers coarser spatial resolution but requires fewer resources and enables coverage of larger areas, making it a cost-effective solution for routine monitoring. Standard photogrammetric software and computing equipment were sufficient for data processing, although processing times could be reduced with higher-performance hardware. The key operational recommendation is to deploy UAVs selectively when high spatial detail is required, while using satellite imagery as a cost-effective baseline for continuous monitoring and planning.
The integration of UAV and satellite imagery with machine learning models aligns directly with several Sustainable Development Goals (SDGs). These technologies support optimized yields (SDG 2), efficient input use (SDG 12), improved irrigation management (SDG 6), innovation in agricultural systems (SDG 9), and enhanced resilience to climate change (SDG 13).
Limitations and Challenges
Despite the robustness of the results, several limitations must be acknowledged. First, the methodology is not easily scalable for smallholders due to the financial costs, technical expertise, and infrastructure required for UAV operations and advanced machine learning workflows. Second, the study was limited to a single phenological stage within one growing season, which restricts the ability to capture interannual variability related to climate, pests, and management practices.
Third, model performance is highly dependent on data quality and spatial resolution. Lower-resolution satellite imagery results in reduced predictive accuracy, and multisensor integration requires careful preprocessing. Fourth, the workflow generates large datasets that demand substantial computational resources and processing time, which may limit practical implementation in contexts with limited hardware capacity. Finally, UAV operations are sensitive to weather conditions, and their cost-effectiveness for routine vineyard management remains context dependent.
The proposed multi-source methodology opens several promising avenues for future research. First, simplifying the data integration protocol would improve accessibility and replicability, particularly for small and medium-sized farms. Second, yield prediction models could be further optimized by incorporating additional soil variables, increasing sampling density, and integrating multi-year datasets and meteorological information to better capture spatial and temporal variability. Third, the integration of soil sensor data with UAV- and satellite-derived vegetation indices would provide a more comprehensive understanding of vine–soil interactions. Finally, extending the methodology to vineyards in other European regions would allow evaluation of its transferability, while educational initiatives could promote broader adoption of precision and sustainable viticulture practices.
Conclusions
The results of this study demonstrate how satellite imagery at different spatial resolutions, together with UAV-based data, can be effectively applied in agricultural remote sensing, with potential extrapolation to a wide range of crop types worldwide. High-spatial-resolution imagery (PlanetScope and UAV data) significantly improves the accuracy of yield prediction models, highlighting the critical role of fine-scale spatial detail in optimizing precision viticulture practices. The combined use of satellite and UAV data provides a more comprehensive and robust monitoring strategy by compensating for the inherent limitations of each technology. UAV imagery offers very high spatial resolution, enabling detailed intra-plot analysis and site-specific management, while satellite data (Sentinel-2 and PlanetScope) provide temporal continuity and regional scalability, offsetting the logistical complexity and processing demands associated with repeated drone operations. In this context, Sentinel-2 represents a cost-effective solution for large-scale comparison and long-term historical analysis, whereas UAV surveys serve to validate and refine observations at critical decision-making moments.
The predictive models developed using data from the three multispectral platforms can be transferred to other vineyard areas within the Mediterranean Basin that shows similar environmental and management conditions, thereby facilitating the broader implementation of precision viticulture strategies. From a temporal monitoring perspective, June and July emerge as the most suitable months for UAV surveys, as vineyards are typically in the final vegetative phase, allowing key management decisions to be made prior to harvest. In parallel, annual satellite monitoring enables continuous assessment of crop development and interannual variability. The proposed methodology provides a structured and adaptable framework that can be adopted by researchers and technical advisors to support yield prediction in Mediterranean vineyard systems. Although direct implementation by small-scale farmers may be constrained by technical and resource requirements, the generated outputs offer valuable guidance for practical management decisions related to fertilization, irrigation, and harvest timing, promoting more efficient, sustainable, and data-driven vineyard management.
Footnotes
Acknowledgements
We would like to express our gratitude to the owners of Bodegas Calvente, located in the municipality of Villamena (Granada, Spain), and to our colleagues who assisted with the field research.
Author Contributions
Conceptualization, JGV, SD, and JRC; methodology, JGV, SD and JRC; validation, and JRC; for-mal analysis, JGV and SD; investigation, JGV, SD, and JR; data curation, JGV; writing—original draft preparation. JGV and JRC; writing—review and editing, JGV, SD, and JRC; visualization, JGV; funding acquisition, JRC. All authors have read and agreed to the published version of the manuscript.”
Funding
The authors disclosed receipt of the following financial support for the research, authorship, and/or publication of this article: This work was supported by a 2021 Leonardo Grant for Researchers and Cultural Creators from the BBVA Foundation, for which we are deeply grateful. We also acknowledge the support from projects granted by the University of Granada within the Plan Propio: (i) PP2022.EI-01, “Caracterizando la degradación ambiental en el viñedo granadino. Un enfoque multidisciplinar a largo plazo utilizando parcelas experimentales y muestreos poblacionales”; 1 (ii) PPJIA2022-58, “Caracterización hídrica del suelo en viñedos para la optimización de recursos agrícolas y ambientales”; and (iii) Proyectos Innovadores 2022–2025 de Grupos Operativos AEI-agri (Andalucía): “Creación de una herramienta DSS (Decision Support System) para el manejo sostenible del suelo en viticultura.”
Declaration of Conflicting Interests
The authors declared no potential conflicts of interest with respect to the research, authorship, and/or publication of this article.
Data Availability Statement
Data will be shared upon due request.
Declaration of Generative AI and AI-Assisted Technologies in the Writing Process
During the preparation of this work the authors used Chat GTP Plus in order to check the grammar and flow of the text. After using this tool, the authors reviewed and edited the content as needed and take full responsibility for the content of the publication.