
Abstract
Recognizing the profound impact and importance of hillslope geometry and vegetation cover, and their planting patterns in managing and controlling runoff and soil loss, this research aimed to understand the one-sided and interaction effects of different Vetiver cover planting patterns and different geometry of complex hillslopes (CHSs) on surface runoff, and to compare the results with bare soil conditions. To achieve this, rainfall simulation experiments were utilized with plot sizes of 1 m ×2 m with different shapes of CHSs, along with Vetiver cuttings with square planting (SPP) and Rhombic planting (RPP) patterns. The results demonstrated that among hillslopes with convex profiles, those with divergent and convergent plans exhibited the highest runoff values and soil loss rates, respectively. Across all hillslopes, the RPP reduced the runoff more effectively than the SPP. Furthermore, the hillslopes’ geometry significantly affected the runoff values and soil loss (pvalue ⩽ 0.00). The results also showed that the lowest runoff volume amount was observed in the convex-convergent hillslope with the RPP pattern (0.19 L/m2) and the lowest soil loss amount was observed in the straight-parallel hillslope with the RPP pattern (0.37 g/m2).
Introduction
Topography plays a crucial and influential role in hydrological processes, including the determination of runoff, erosion, and sediment values. It is an inherent characteristic of a region and watershed (Sadeghi et al., 2018; Talebi et al., 2008). Understanding the impact of topography is essential for accurate and effective water resource management planning, as well as for runoff and sediment control operations. Among the significant factors influencing runoff production in hillslopes, their geometry holds a particular importance (Mombini et al., 2021). However, in many cases, the influence of topography on these processes has only been considered by assuming a straight, parallel plan shape for watersheds. The actual geometric characteristics such as whether the hillslopes are convergent or divergent, and their profile curvature, are not considered (Asgari et al., 2023; Talebi et al., 2007). In terms of profile curvature, hillslopes can be classified into three categories: straight, convex, and concave. Additionally, based on plan shape, hillslopes can be categorized into three types: convergent, divergent, and parallel (Kiani-Harchegani et al., 2022; Troch et al., 2002).
The natural hillslopes of a watershed are not always with uniformly shaped slopes and watersheds consist of hillslopes with different geometries which is called complex hillslopes (CHSs; Talebi et al., 2007, 2008; Troch et al., 2002). The hydrological response of hillslopes is influenced by their longitudinal profile and plan shape (Kiani-Harchegani et al., 2021). Investigating and better understanding the effect hillslopes with different geometries on surface runoff is vital for effective watershed management and accurate estimation of the hydrological status of the watershed (Geranian et al., 2013; Talebi et al., 2016).
Runoff consists of three sections, including surface runoff, subsurface runoff, and baseflow. In recent years, some authors have considered the shape of hillslopes has been considered an influential factor in the behavior of surface and subsurface runoff (Afshar Ardekani & Sabzevari, 2020). For instance, Agnese et al. (2007) noted that surface runoff travel time is shorter in divergent hillslopes compared to convergent ones, and convex hillslopes have the shortest travel time. Meshkat et al. (2019) explored the effect of surface roughness coefficient on surface runoff in CHSs and the lowest runoff threshold and sediment concentration were observed in the convex-convergent and convex-divergent hillslopes, respectively. Based on the findings of Monfared et al. (2021) the total amount of runoff volume in the protected treatment has decreased compared to the control treatment under straight-parallel and concave-parallel hillslopes, while in the convex-parallel hillslope, the runoff volume increased. Based on the results of Kiani-Harchegani et al. (2021) in laboratory conditions, the individual effects of consecutive storms and CHSs, as well as their mutual effects on surface runoff, were found to be significant (pvalue ⩽ .00). It was further observed that the surface runoff is more influenced by consecutive storms.
The presence of appropriate vegetation cover is essential for effective management and control of surface runoff, as well as soil erosion. Vegetation cover plays a crucial role in hydrological processes and mechanical soil erosion (Sun et al., 2021; Zhao et al., 2019). It enhances hydraulic resistance, improves physical connection among soil particles, increases surface runoff storage, and reduces both runoff and soil erosion (Kervroëdan et al., 2020; Lin et al., 2014).
Vegetation cover can be categorized into two types of biological protection and biological construction (Naylor, 2002). Vegetation barriers, such as the Vetiver plant (Vetiveria zizanioides), can form structures like vegetation mounds that trap runoff and sediments, thereby increasing permeability and reducing surface runoff (Kato et al., 2009; Lin et al., 2014; Sadeghi et al., 2021). The use of sustainable vegetation cover has become a widely adopted method for controlling surface runoff and is an important strategy in water and soil protection. It is a cost-effective approach for control and reducing runoff and sediment in watersheds and hillslopes (Burylo et al., 2012; Graf & Frei, 2013; Joshi & Tambe, 2010).
Numerous studies have demonstrated the reduction in runoff volume achieved by creating vegetation cover on the soil surface (J. Liu et al., 2018; R. Liu et al., 2021; Pan et al., 2010; Saleh et al., 2017; Tang et al., 2021; D. Wang, Yuan et al., 2021; J. Wang, Zhang et al., 2021). The Vetiver plant, due to its specific characteristics, has been considered due to its rapid growth and also its ability to reduce runoff. Vetiver can regenerate and grow rapidly even after damage caused by adverse weather conditions such as drought, freezing, and salinity. It can also tolerate alkaline soils and grow in soils contaminated with heavy metals and toxins (Loch et al., 2000; Truong et al., 2008; Zarotti, 2002). Due to its wide-ranging adaptability and effectiveness in reducing runoff, Vetiver plant has gained considerable attention for water and soil bioengineering in various regions.
As regards existing studies, which mostly focus on single hillslope shapes and lack an analysis of the interaction between CHSs and planting patterns. Hence, the primary objective of this research was to gain a comprehensive understanding of the individual and combined effects of different Vetiver planting patterns and CHSs geometry on intra- and inter-storm variation of hydrological variables in arid regions. In this regard, experiments were planned on a plot scale under laboratory conditions to manage the cost and reduce the number of experiments in a shorter period to better understand hydrological processes with high resolution. The obtained results were then compared with bare soil conditions. The novelty and advantage of this study lie in its focus on CHSs, which have often been overlooked in previous research in this field. By considering hillslopes in their actual form, this research aims to fill the gap in existing knowledge and provide valuable insights into surface runoff and soil loss rate management.
Materials and Methods
Study Area
Tahooneh paired watersheds are situated in the northwest of Yazd province and southwest of Ashkezar city. Their outlet is located in the northwest direction. These paired watersheds lie between longitudes 53°45′29″ and 53°58′12″ east and latitudes 31°47′45″ and 31°56′9″ north. The approximate combined area of these watersheds is 0.03 km2. The maximum elevation of the sample watershed is 2,523 m a.s.l. in the south eastern part, and the minimum is 1,994 m in the northwestern part. In the control watershed, the maximum elevation is 2,463 m in the southeastern part, while the minimum elevation is 1,896 m in the northwestern part. The average annual rainfall of the sample and control watersheds is 174.60 and 184.08 mm, respectively. The annual average temperature in the sample area is 12.9°C and in the control watershed 13.4°C. The soil texture in both areas is characterized by sandy-loam. The electrical conductivity of the soil of this watershed is about 1.7 dS/m and its soil infiltration capacity is about 1.35 cm/hr. This watershed is geologically composed of dolomite with chert bands and sandstone. Also, a large part of this watershed consists of barren and pasture lands. The dominant vegetation in this area is the Artemisia Sieberi. The climate of the studied paired basins is classified as cold dry on the Amberje method (Asgari et al., 2023). Figure 1 displays the location of the study area in Iran, within Yazd province, near Ashkezar city.

Location of Tahooneh Paired watershed in Iran and Yazd province, Ashkezar city.
Methods
The rainfall simulator is a valuable and widely employed tool in research for estimating soil erosion as the experiment conditions are repeatable and provide results that are closer to reality and natural (Salem & Meselhy, 2021). For the current research, a portable pressure rainfall simulator equipped with a Veejet 80100 oscillating nozzle was utilized. This device comprises several components, including an electric motor to provide the necessary electrical energy, a computer control system for managing nozzles, a water tank, a water pump, a pressure gauge, a raindrop spraying system (nozzles), an adjustable device frame up to a height of 240 cm, and a test plot. The simulator utilized a spray arm with nozzles that oscillate across the plot at different speeds to create varying rainfall intensities. The box surrounding the nozzle is employed to adjust the spray across the plot. The arm is connected to a gear motor, which receives control signals from the computer program (Gholami et al., 2024; Kavian et al., 2019). This gear motor adjusts the movement speed and swing angle of the arm. This setup aimed to simulate rainfall with an intensity of 45 mm/hr and a duration of 15 min, representing a return period of 25 to 30 years, by intensity duration frequency (IDF) curve in Tahooneh paired watersheds and according to the soil and water conservation activities in watersheds was carried out (Kiani-Harchegani et al., 2021). Additionally, the setup was designed to create a hillslope with the desired plan shape and profile curvature. Furthermore, the researchers investigated the effect of vegetation cover on this hillslope. To conduct the study, a plot with dimensions of 1 m × 2 m was used, as shown in Figure 2.
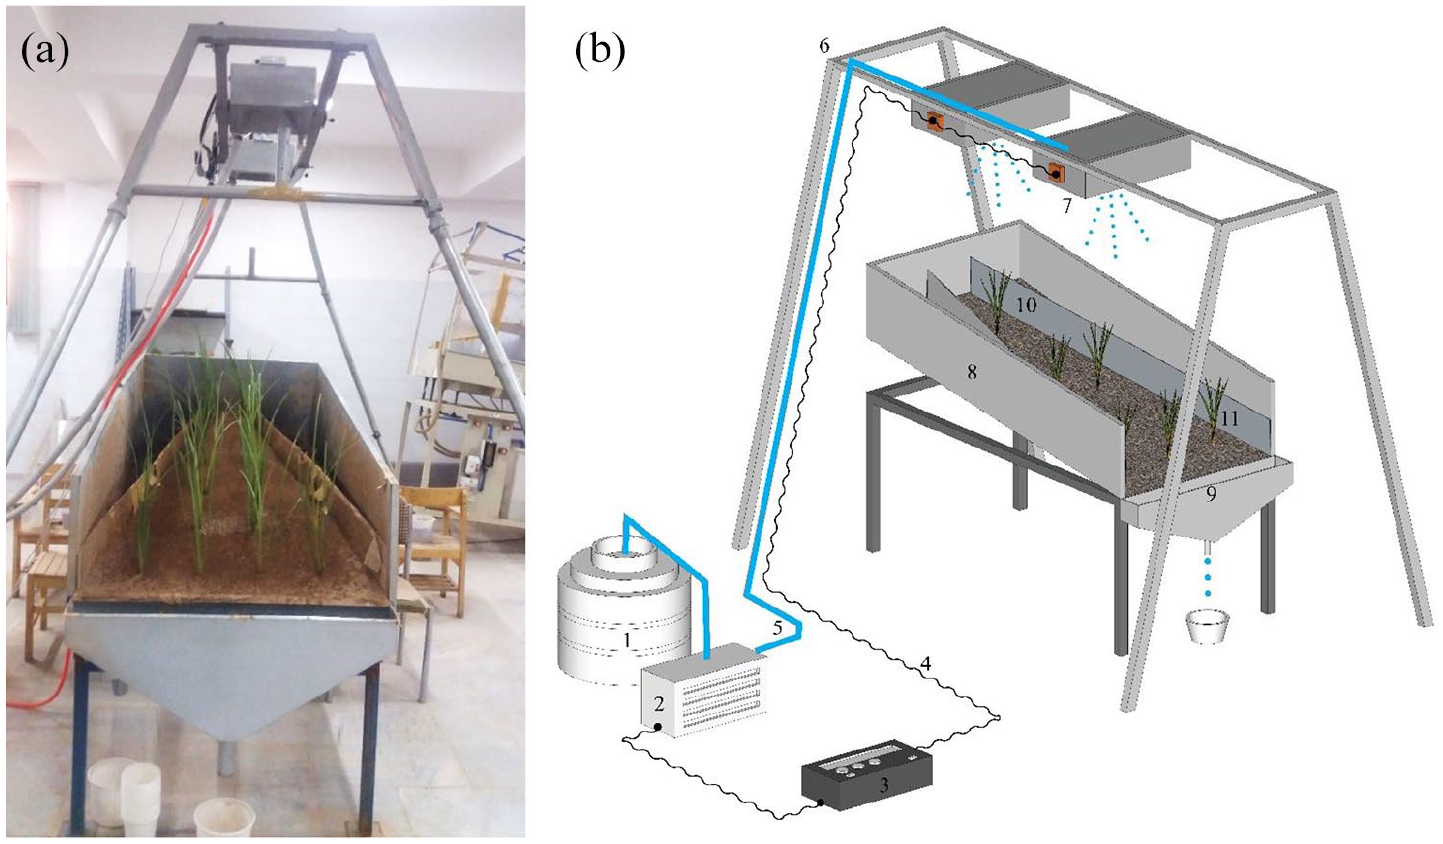
Rainfall simulator and components: (a) Rainfall and soil conservation simulation in the laboratory condition. (b) Schematic image of the rainmaker and plot used in the current research along with their components; (1) water tank, (2) electric generator, (3) control board, (4) electric cable, (5) water transfer hose, (6) adjustable bases and device frame, (7) swinging nozzle, (8) metal plot, (9) plot outlet, (10) plexigless sheet, and (11) Vetiver grass.
Plot Preparation With Complex Hillslopes
Hillslope geometries in the 2 m × 1 m plot were designed using plexiglass sheets for the convergent plan and mineral aggregate for the hillslope plan (Kiani-Harchegani et al., 2022; Mombini et al., 2021). The combination of profile curvature and hillslope plan shapes is depicted with each type of hillslope represented by horizontal lines (dark lines) in Figure 3.
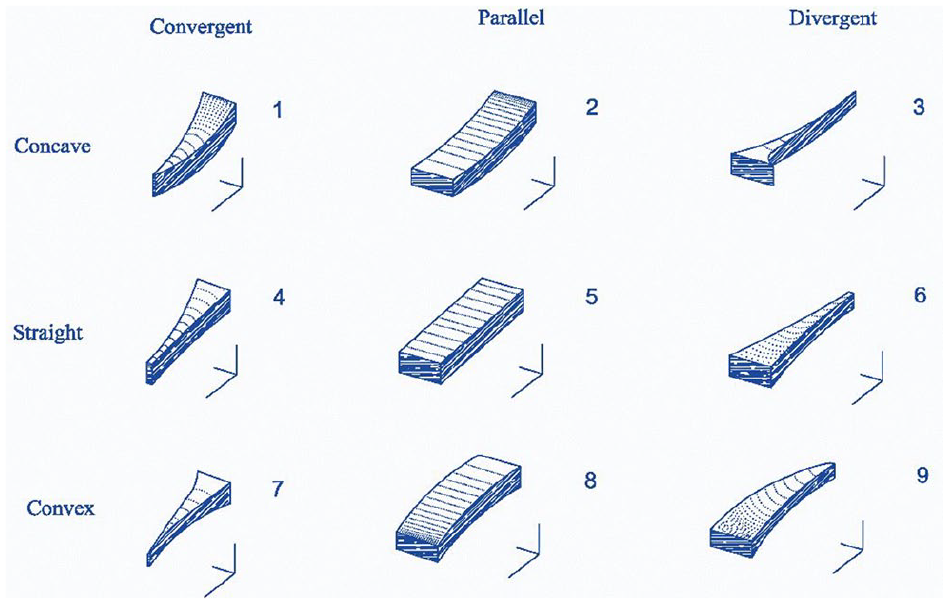
3D models of the nine complex hillslopes following the classification of Troch et al. (2002).
After setting the rainfall intensity in the rainfall simulator, 3D models of the nine complex hillslopes were employed to alter the plan shape and hillslope profile within the watershed (Troch et al., 2002). In the laboratory, a hillslope geometry model was created, considering three modes for plan shape hillslope (convergent, divergent, and parallel) and three modes for profile curvature hillslope (convex, concave, and straight). This resulted in nine different shapes, facilitating the investigation of hillslope runoff based on previous studies (Talebi et al., 2008). Profile curvature refers to the curvature along the direction of the slope of the flow, categorized as concave, straight, or convex. This is crucial as it influences the speed of mass movement along the hillslope. On the other hand, plan curvature refers to changes in the transverse slope perpendicular to the flow lines, affecting concentration and surface currents. Generally, plan curvature can indicate convergence and divergence.
According to Table 1 and Figure 4, the length and width of the plot were calculated using Equations 1 to 3 and utilizing plexiglass sheets and the profile elevation employing mineral aggregate for the various types of the CHSs and implemented on the 2 m × 1 m plot (Kiani-Harchegani et al., 2021; Talebi et al., 2008).


where z, x, and y are the elevation, the horizontal distance in the direction of the length of the hillslope toward the end of the basin, and the horizontal distance from the center of the gradient in the vertical direction toward the length of the hillslope, respectively (Figure 5). E and H are the minimum and maximum heights relative to the baseline, respectively. L is the length of the hillslope in meters, and n is the profile curvature parameter which has no dimension, ω is the plan shape parameter, cw defines the width of the hillslope at the outlet (x = L), cs defines the degree of topographic convergence (Talebi et al., 2008, 2016).
Geometric Features of CHSs.

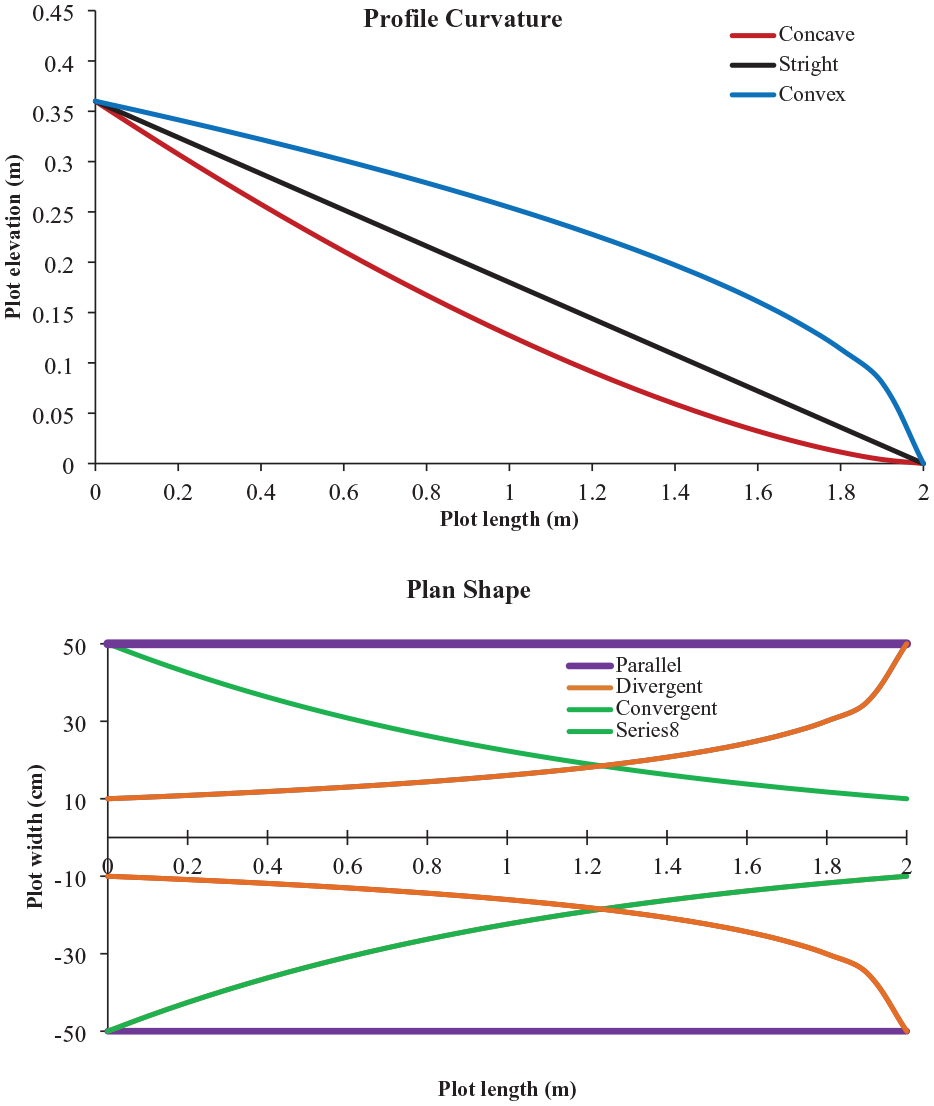
Shapes of plan curvature and profile curvature of hillslopes on the plot used in the experiments.

3D shape of a hillslope with convex profile.
Soil Preparation in the Plot
The plot used in this research measures 1 m in width and 2 m in length, with an adjustable slope, and it has a flume to collect runoff, which is built to measure the amount of runoff and sediments. Considering the role of slope in runoff production within watersheds and based on the previous research, an average slope of 20% was applied to the plot. Before introducing the soil into the plot, special care was taken to simulate natural soil conditions and create a simplified yet realistic hillslope profile curvature (convexity and concavity). To achieve this, a drainage layer consisting of mineral pumice with a gradual grain change from coarse to fine (filter structure) was placed on the plot floor, based on the Equations 1 to 3 for each type of hillslope and then a 15-cm-thick soil layer were placed at the plot (Kiani-Harchegani et al., 2021). A permeable hemp sack layer was used between the filter and soil layers. Hence, in addition to preventing the mixing of the soil on the bag with the filter below it, by increasing the friction coefficient, it prevents the increase in the runoff velocity at the place where the soil meets the metal wall of the plot (Darboux et al., 2001).
To achieve suitable plan shapes for convergent and divergent hillslopes, plexiglass sheets were used according to Equations 1 to 3 related to each of the hillslopes. The first 20 cm layer of the local soil was excavated using a spade to create hillslopes with suitable shapes from the local soil. The texture of this soil was sandy-loam (62% sand, 26% silt, and 12% clay) and bulk density of 1.37 g/cm3 (Kiani-Harchegani et al., 2021). Next, the soil underwent air-drying to attain the optimal moisture level (12%), as described by Fox and Bryan (1999). Subsequently, it passed through an 8 mm sieve to preserve the structure of the soil aggregates and plant remains and pebbles were removed. After transferring the soil into the plot and considering the importance and effects of apparent specific gravity in the surface resistance of the soil against raindrops and runoff, a metal tube with a diameter of 10 cm was used as a roller and the soil was beaten with the roller (Sadeghi et al., 2021). Before running the simulation, the soil moisture content of all experiments was standardized to be as uniform as possible by creating non-erosive rainfall with an intensity of 5 mm/hr, following the methods outlined in previous research (Kiani-Harchegani et al., 2018).
Vegetation Cover Preparation for Experiments
In this research, Vetiver plant was chosen due to its high resistance in complex environmental conditions, especially in arid areas. For the experiments, the vegetation cover percentage was determined, considering that the area’s natural vegetation cover is 20 %. Extensive research has shown that increasing the vegetation cover beyond 40% and 50% does not significantly affect the runoff values (Eshghizadeh et al., 2016; Zhao et al., 2014). The prevailing climate conditions in the region make it challenging to establish vegetation cover beyond this range. Considering cost limitations other and practical factors, an average value of 30% vegetation cover was considered the optimal choice for this specific region. To study the effects of vegetation cover on the plot, two planting patterns were selected: the square planting pattern (SPP) and the rhombic or zigzag planting pattern (RPP). In the SPP, the distance between two adjacent planting rows is equal to the distance between two adjacent plants on the same row, resulting in all four bushes forming the vertices of a square (Thakur et al., 2014). On the other hand, in the RPP, the three Vetiver plants are arranged to form an equilateral or equilateral triangle, with all four plants placed on the four vertices of a rhombus (Purba & Nasution, 2018). Figure 6 shows a schematic picture of the SPP and RPP in CHSs. Then the cuttings of the Vetiver plant were moved on the soil of the plot under the rainfall simulator with two arrangements of square planting and one in the middle (rhombus). Then simulation of rainfall with an intensity of 45 mm/hr during 15 min in the return period of 25 to 30 years.

Schematic image (a) SPP in convergent hillslopes, (b) RPP in convergent hillslopes, (c) SPP in divergent hillslopes, (d) RPP in divergent hillslopes, (e) SPP in straight hillslopes, and (f) RPP in straight hillslopes on the plot (with 30% coverage).
Measurements of Runoff Volume and Soil Loss Samples
The time when the first signs of runoff and soil loss appeared in the outlet of the plot, was recorded using a chronometer, and the runoff volume and the soil loss amount were measured at 1-min intervals using 1-L beakers. The runoff is sampled for 15 min. Then, the sediment was determined using the decantation method for 24 hr, emptying the supernatant, and drying the sediment in an oven at 105°C. Considering the varying areas of the CHSs, the amount of runoff volume (L) and soil loss (g) was divided by plan area (Table 1) to eliminate the effect of plan area. (Kiani-Harchegani et al., 2021). Each complex hillslope received the rainfall simulation with three repetitions to facilitate the statistical analysis by stabilizing the mean and the standard variation. Therefore, according to the nine forms of the complex hillslopes and three types of treatment (control, SPP, and RPP) in three replications, a total of 81 experiments were designed and executed.
Statistical Analysis
The runoff volume data obtained from the tests of protective treatments (SPP and RPP) and the control treatment (Cont.) were recorded and sorted with three repetitions. After the total number of 81 rainfall simulation experiments, descriptive statistics were calculated. For the comparative analysis of the effect of hillslopes and vegetation cover on surface runoff components, two-way ANOVA was conducted using SPSS statistics 26 (IBM, USA). If a significant effect was found, the means were compared using Duncan’s test as described in previous works of Kiani-Harchegani et al. (2018).
Results and Discussion
Intra- and Inter-Storm Variation of Runoff Volume in CHSs
To compare intra- and inter-storm variation under different treatments in CHSs, statistical characteristics were computed for the runoff value across different hillslopes and treatments. The results are presented in Table 2 and Figure 7a.
Descriptive Statistics Related to Runoff Volume (L/m2) and Soil Loss (g/m2) in Different Treatments Under CHSs Using Duncan’s Test.
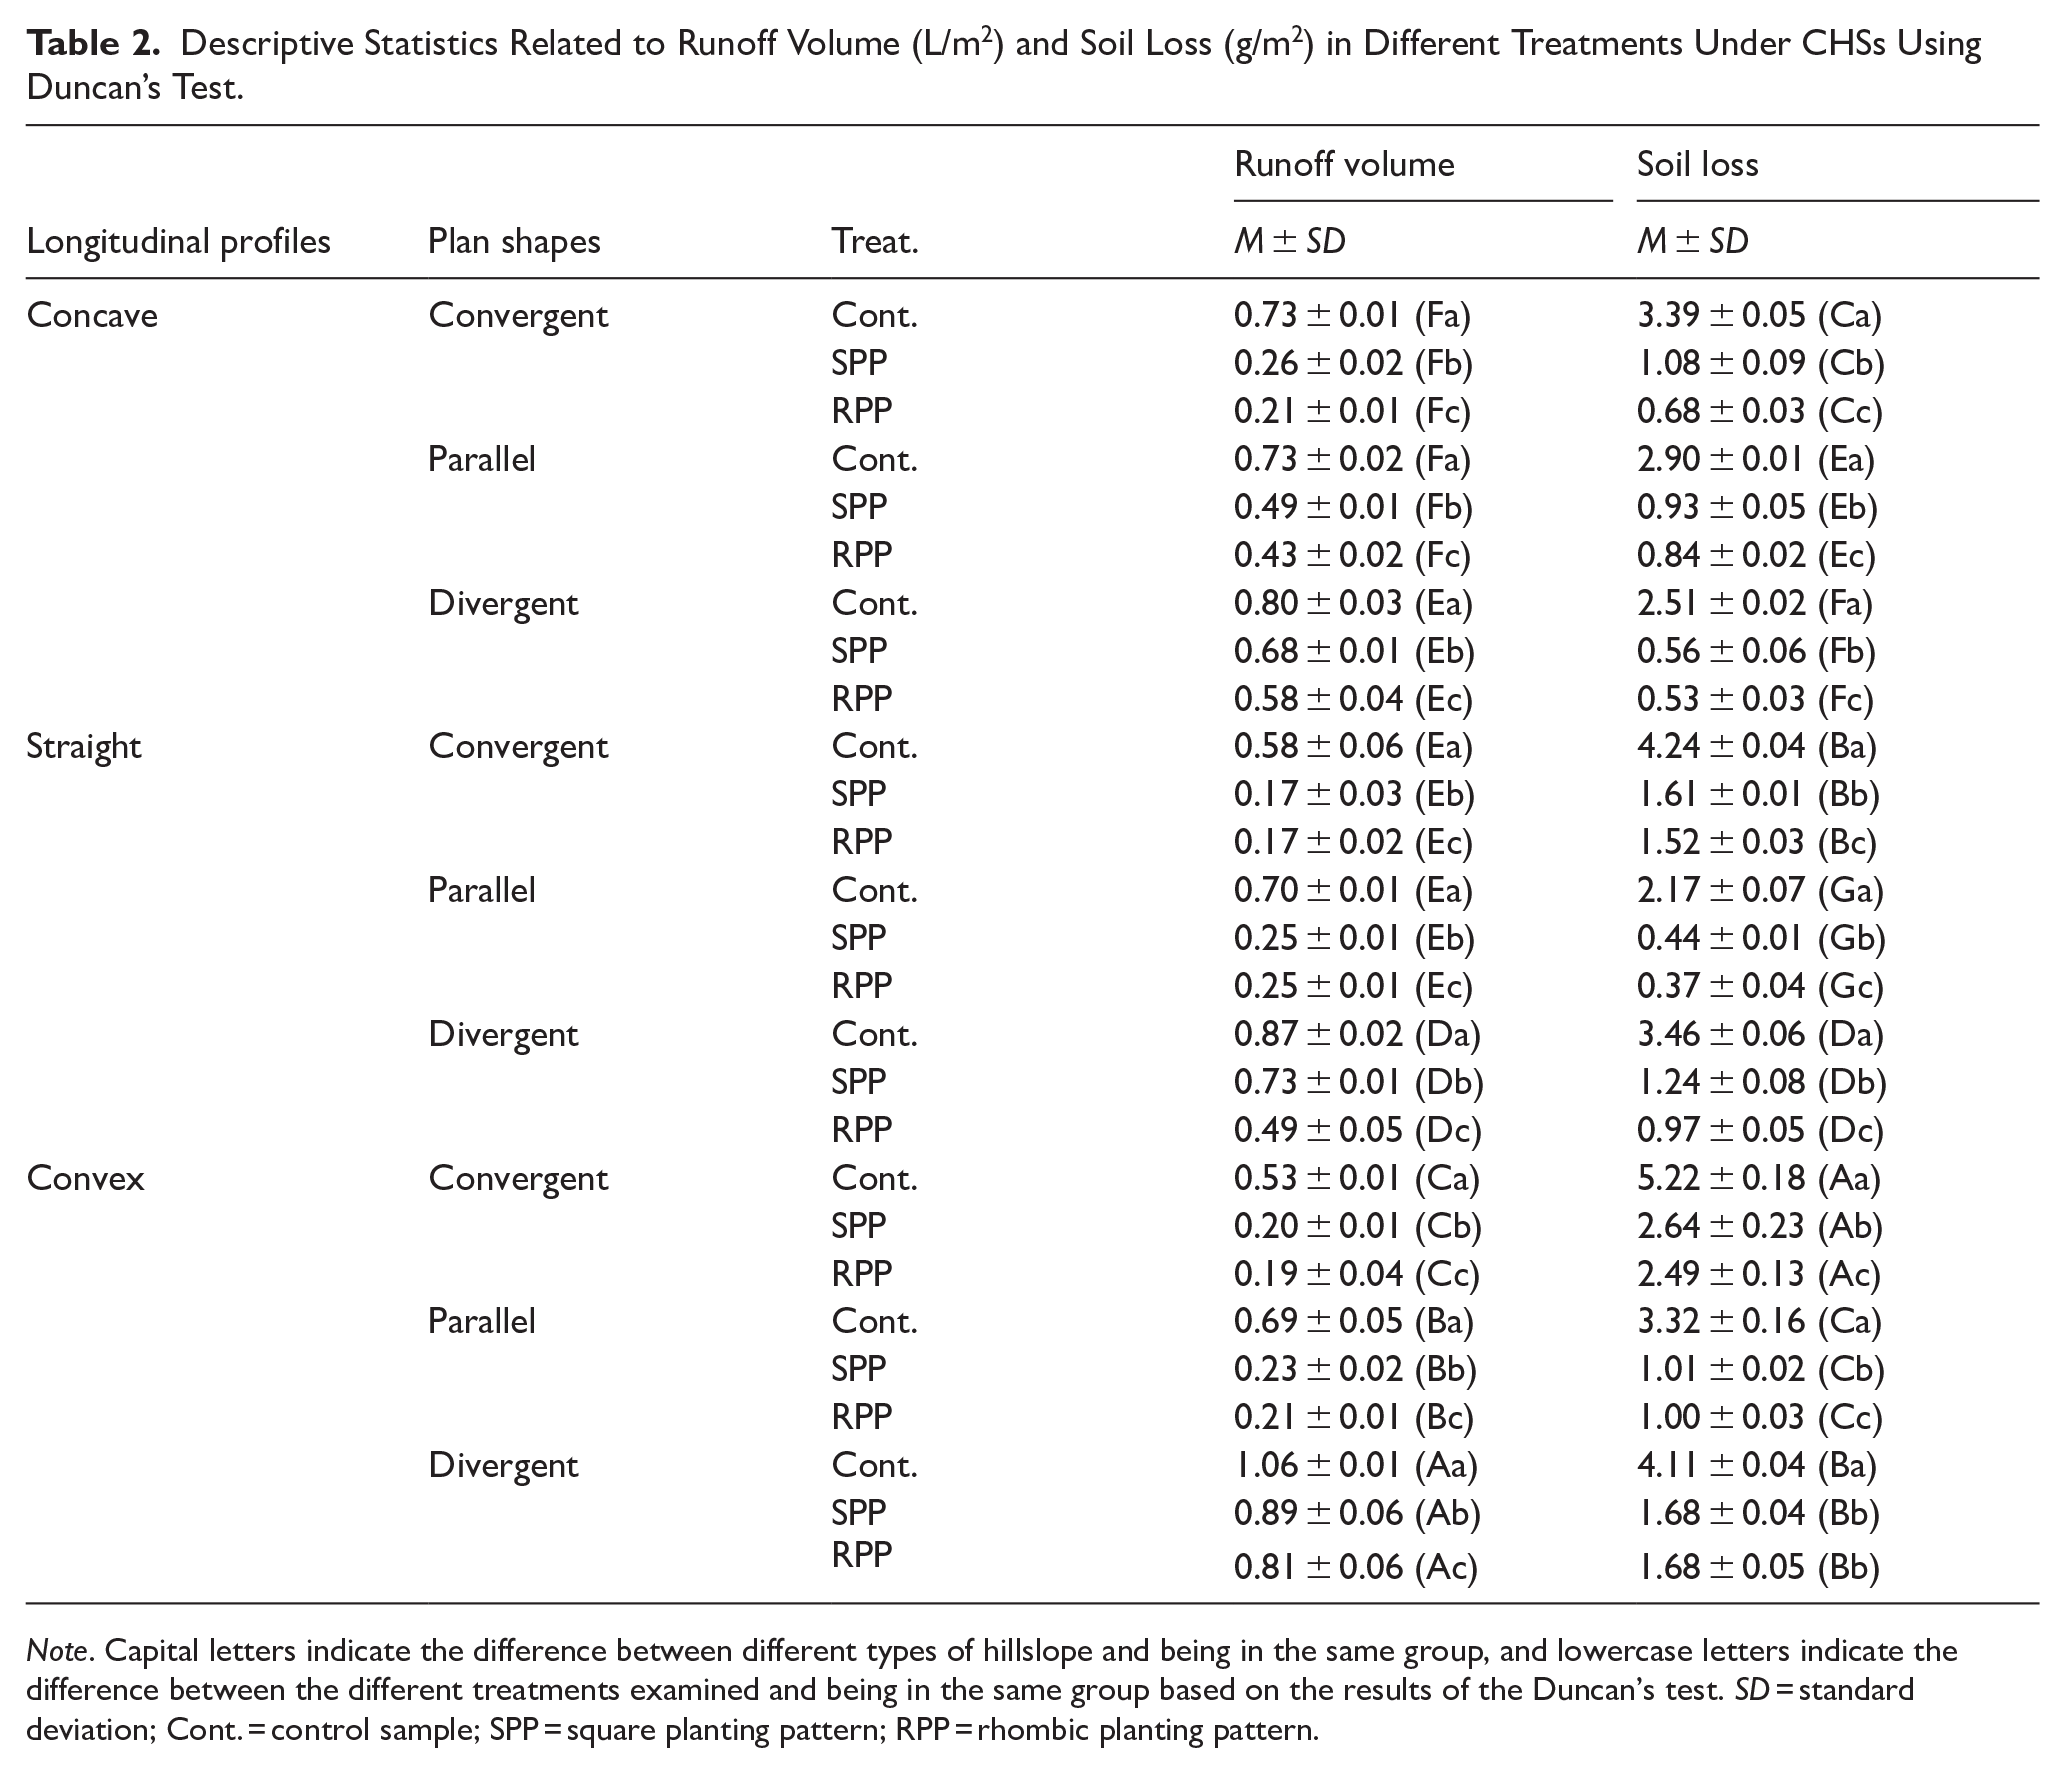
Note. Capital letters indicate the difference between different types of hillslope and being in the same group, and lowercase letters indicate the difference between the different treatments examined and being in the same group based on the results of the Duncan’s test. SD = standard deviation; Cont. = control sample; SPP = square planting pattern; RPP = rhombic planting pattern.

Box diagram related to intra-storms variability runoff volume (a) and soil loss (b) in different treatments including without vegetation cover (Cont.) and with vegetation cover (SPP and RPP) under complex hillslopes.
Based on the data presented in Table 2, the conserved (hillslope with vegetation cover) and control treatments (hillslope without vegetation cover) showed diverse trends across different types. Among all types, convex-divergent hillslopes exhibited the highest average runoff value (1.06 L/m2), while convex-convergent hillslopes had the lowest average runoff value (0.53 L/m2). When considering the square planting pattern (SPP), convex-divergent hillslope demonstrated the highest value (0.89 L/m2) compared to other hillslopes, whereas straight-convergent type has the lowest average runoff volume (0.17 L/m2). In the rhombic or zigzag planting pattern (RPP), the convex-divergent type still showed the highest average runoff value (0.81 L/m2), while the straight-convergent type had the lowest average runoff value (0.17 L/m2).
In all hillslopes, also based on results presented in Figure 7a, the intra- and inter-storm variation the runoff volume in the control treatment (Cont.) was observed to be higher compared to the SPP and RPP pattern treatments. Among the different hillslopes, the maximum runoff volume was observed in hillslope No. 9 (convex-divergent) under the control treatment, while the minimum runoff was recorded in hillslope No. 7 (convex-convergent) under the same treatment. Additionally, high runoff volumes were observed in hillslopes No. 6 (straight-divergent) and No. 3 (concave-divergent). These findings indicate the influence of hillslope type and treatment on the runoff volumes in the study area.
The size of the outlet section in divergent hillslopes is larger, resulting in higher average runoff values compared to convergent hillslopes. The smaller width in convergent hillslopes prevents the evacuation of all accumulated water, leading to lower runoff at the outlet compared to divergent hillslopes. Additionally, the surface storage of water in convergent hillslopes contributes to low runoff. In divergent hillslopes, the distribution of runoff leads to faster water movement toward the outlet, resulting in reduced water storage and increased runoff output from the plot (Geranian et al., 2013; Meshkat et al., 2019). On the other hand, concave hillslopes, with their low slope at the outlet of the plot and hillslope, tend to accumulate more water at the outlet, while convex hillslopes, with their higher slope, experience less water accumulation. Therefore, the amount of runoff in these hillslopes is more than in concave hillslopes (Kiani-Harchegani et al, 2022). The addition of vegetation cover reduced the average amount of runoff in both planting patterns, but the reduction was more significant in the RPP compared to the SPP. This can be attributed to the RPP creating more obstacles in the path of runoff from the simulated rainfall from the upstream of the plot to its outlet. In this context, the findings of Zhang, Liu, Yi, and Zhang (2014), and D. Wang, Yuan et al. (2021) also emphasized the effect of vegetation cover in reducing runoff by creating obstacles in the path of runoff.
The addition of the vegetation cover increases the threshold for the start of runoff, leading to a decrease in the total amount of runoff compared to the control state. These results are consistent with the results of Su et al. (2022), who observed that vegetation cover in convex hillslopes leads to a decrease in runoff. The amount of runoff reduction in hillslopes with a convergent plan is decreased due to the increase in the amount of storage in these types of hillslopes with the addition of vegetation cover, decrease in the runoff velocity and the increase in the amount of infiltration into the soil (Dong et al., 2015; Nunes, 2011). However, since infiltration is possible in both planting pattern systems (SPP and RPP), there is no significant difference between the two in this type of hillslope. On the other hand, in hillslopes with divergent plan due to its greater width at the outlet, the runoff reaches the outlet faster than the converging hillslopes, so the lack of sufficient opportunity for infiltration leads to less reduction in the amount of runoff with the addition of vegetation cover. Different types of divergent hillslopes have significant differences in this regard (pvalue < .05). Also, a greater amount of runoff volume reduction was observed in RPP than SPP due to the creation of more obstacles (Kumar Shit et al., 2014; Martin et al., 2010; Martínez-Zavala et al., 2008; Vasquez-Mendez et al., 2010; Zhang et al., 2011). For example, in a straight-divergent hillslope, the difference between RPP and SPP in the amount of runoff reduction is 0.21 L/m2. Straight hillslopes, due to their uniform slope, are intermediate between the other two types of hillslope plans in terms of runoff behavior.
The rhombic or zigzag planting pattern (RPP) dense arrangement creates less free space, leading to a more pronounced reduction in runoff in various hillslope types. The presence of plant stems in the runoff path divides the flow, slowing down the runoff velocity (Dong et al., 2018). The areas between the plants are effectively protected by the RPP, which creates a non-straight path for the movement of runoff resulting from precipitation. This pattern not only promotes water penetration but also fosters micro-topography development under the canopy of the Vetiver plants. The creation of micro-hill surfaces and affecting the soil surface and runoff dynamics (Abrahams et al., 2001; Dong et al., 2018; D. Wang, Yuan et al., 2021). Furthermore, vegetation cover in the RPP alters the characteristics of the runoff flow path, as documented by various studies (Bautista et al., 2007; Ludwig, Bartley, et al., 2007; Ludwig, Bastin, et al., 2007; Mayor et al., 2008; Puigdefábregas, 2005). The shape of the rows in the RPP results in shorter runoff path length (Dong et al., 2018; Dunkerley, 2004), caused by the collision of the runoff with the unevenness created through the vegetation cover, including collisions with the Vetiver plant trunks and micro-hills.
Intra- and Inter-Storm Variation of Soil Loss in CHSs
The mean and standard deviation of soil loss amount (g/m2) are presented in Table 2 and its intra- and inter-storm variation in different treatments under CHSs in Figure 7b.
The results of Table 2 and Figure 7b showed that the highest average soil loss was observed in the three treatments of control, SPP, and RPP in the convex-convergent hillslope, with values of 5.22, 2.64, and 2.49 g/m2, respectively. The lowest soil loss was also observed in the mentioned treatments in the straight-parallel hillslope, with values of 2.17, 0.44, and 0.37 g/m2, respectively. The amount of soil erosion in the RPP treatment is the least among all three treatments across all CHSs. The vegetation cover of rhombic or zigzag planting pattern (RPP) increases resistance against runoff and soil erosion, leading to a more significant impact on the amount of runoff and soil loss. The obstacles created by the RPP decrease the runoff velocity and promote increased infiltration, resulting in a decrease in the amount of runoff and soil loss at the plot’s output (Cao et al., 2015; Mu et al., 2019; Smith et al., 2007; D. Wang, Yuan et al., 2021). In this regard, these results are consistent with the findings of Pan et al. (2010) and Cao et al. (2015) who attributed this speed to the presence of more obstacles in the path of runoff movement. Additionally, it was observed that the hillslopes with concave longitudinal profiles exhibit higher soil erosion compared to those with convex profiles in each treatment. For instance, the converging-convex hillslope (hillslope 7) experiences the most soil loss among all hillslopes in the three treatments studied. This is because, in slopes with concave curvature, soil particle removal and separation occur in the upper sections of the hillslope, whereas sedimentation occurs in the lower sections near the outlet of the plot. In contrast, in hillslopes with convex profiles, the separation of soil from the hillslope surface takes place along the entire length. Overall, it can be concluded that the curvature of the profile has a far greater impact on the processes of sediment yield and soil loss than the plan shape. Therefore, considering the dynamics of runoff flow and sediment; the amount of sediment and soil loss produced in Convergent-convex hillslopes is higher than in other hillslopes (Mombini et al., 2021; Sabzevari & Noroozpour, 2014).
Effect of Different Treatments and CHSs and Their Interaction on Hydrological Variables
Two-way ANOVA was used to investigate the effect of CHSs and different treatments as well as their interaction effect on the runoff volume and soil loss at a confidence interval of 95%, and the results of this analysis are presented in Table 3.
Effect of Different Treatments and CHSs and Their Interaction on Hydrological Variables Using Two-Way ANOVA.

The mean difference is significant at the 0.05 level.
According to Table 3, it was demonstrated that the effect of hillslope variable on runoff value and soil loss is significant (pvalue ⩽ .00). The effect of different treatments (SPP, RPP, and Cont.) has a significant effect on runoff value and soil loss rate (pvalue ⩽ .00). The interaction effect between different types of hillslopes and different treatments on the runoff value and soil loss is also significant (pvalue ⩽ .00). According to the effect size of the variables on runoff value and soil loss rate, it was demonstrated that the effect size of different types of hillslopes (ηp2 ⩾ .97) is more than the parameter of different treatments (ηp2 ⩾ .96). Also, the effect size of mutual variables (ηp2 ⩾ .72) is less than the individual effect of parameters.
The hillslope morphology significantly influences the hydrological variables, especially in the hillslope output, where changes in hillslopes width play a crucial role (Agnese et al., 2007). This variability in hillslope design contributes to the different behavior of each hillslope type in response to the simulated rainfall. The divergent plan can efficiently collect all the runoff within the hillslope, whereas the convergent plan occurs water accumulation due to its smaller width at the plot output. In this regard, Meshkat et al. (2019) emphasized the significant impact of hillslope types on the runoff value. Also, the steep slope in the lower reach and the outlet of the convex-convergent hillslope, along with the high volume of runoff at the outlet of this hillslope due to the reduction in the width, leads to an increase in runoff velocity and consequently enhances soil erosion. However, the low runoff discharge per unit width in straight hillslopes results in a lower amount of runoff in these areas, which means this runoff does not have a high capacity for sediment transport. Therefore, the soil loss in these hillslopes is less than in other slopes. In the study by Talebi et al. (2016) and Mombini et al. (2021), the authors emphasized the significant soil loss in hillslopes with a convex profile while examining this component. Considering the positive effects of vegetation cover on sheet erosion control, the amount of changes in the runoff volume and soil loss rate in the state without and with vegetation cover has a significant difference with the investigated planting patterns, which is in line with the research results obtained by previous investigations (Dong et al., 2018; Dunkerley, 2004; Ludwig, Bastin, et al., 2007; D. Wang, Yuan et al., 2021). Increased obstacles in the direction of flow due to vegetation cover result in lower amounts of surface runoff and soil loss at the outlet. These findings have practical implications for managing watersheds and designing effective erosion control measures. Additional research in this area could explore how different combinations of hillslope plan and vegetation cover may further optimize runoff control and soil conservation efforts (Asgari et al., 2023; Monfared et al., 2021).
Conclusions
In conclusion, the current research demonstrated that hillslopes’ longitudinal profile and plan shape have significant effects on hydrological processes such as surface runoff and soil loss.
Vegetation cover and planting patterns, particularly Vetiver with a rhombic or zigzag planting pattern (RPP), showed promising results in controlling and reducing surface runoff and soil loss in complex hillslope systems (CHSs) in laboratory conditions.
Convex-divergent hillslopes exhibited higher runoff values due to lower water storage and larger width at the hillslope outlet, making them more susceptible to runoff. Therefore, effective management and control of surface runoff in convex-divergent hillslopes should be a priority.
The study revealed that vegetation cover, especially Vetiver with RPP, effectively reduced surface runoff and prevented erosion. The RPP created more obstacles in the runoff path, promoting greater infiltration and reducing the amount of surface runoff. Thus, Vetiver with RPP is recommended for managing and controlling surface runoff and soil erosion in different hillslope types.
The research also had limitations, such as being conducted on a laboratory scale and the omission of root dynamics, which may differ from field conditions. Future studies can consider conducting experiments in nature to obtain more realistic results and determine the differences between laboratory and field studies.
Investigating other hydrological components and using different plant covers in similar studies would provide a broader understanding of runoff control options.
Different patterns of vegetation cover arrangement can also be explored to identify the most optimal pattern for surface runoff control and soil loss in various situations.
This research contributes valuable insights into the influence of hillslope characteristics, vegetation cover, and planting patterns on surface runoff and soil loss in CHSs. It offers practical implications for watershed management and erosion control strategies, promoting more sustainable land management practices and enhancing the resilience of ecosystems to changing environmental conditions.
Footnotes
Acknowledgements
This work is part of the doctoral dissertation and was jointly supported by the Faculty of Natural Resources of Yazd University.
Author Contributions
Ebrahim Asgari: Conceptualization, Methodology, Investigation, Validation, Resources, Data curation, Software, Writing – review & editing, Supervision, Project administration, and Funding acquisition. Mahboobeh Kiani-Harchegani: Conceptualization, Methodology, Investigation, Formal analysis, Resources, Data curation, Software, Writing – original draft, and Writing – review & editing. Ali Talebi: Conceptualization, Methodology, Investigation, Formal analysis, Resources, Data curation, and Software. Victor Hugo Duran-Zuazo: Writing – review & editing.
Funding
The author(s) received no financial support for the research, authorship, and/or publication of this article.
Declaration of Conflicting Interests
The author(s) declared no potential conflicts of interest with respect to the research, authorship, and/or publication of this article.
Data Availability Statement
The necessary data are available upon request from the corresponding author.