
Abstract
Drought detection is crucial for managing risk, often using continuous drought indicators derived from satellite data, rainfall, and other hydrometeorological variables. The study examined meteorological and agricultural drought patterns in North Wollo, Ethiopia, using various indices such as Vegetation Condition Index (VCI), Temperature Condition Index (TCI), Vegetation Health Index (VHI), Standardized Precipitation-Evapotranspiration Index (SPEI), and Vegetation Drought Index (VDI) from 2000 to 2022. The study utilized satellite-derived data like MOD11A2 LST Terra and MOD13Q1 NDVI, as well as ground-based data like rainfall. The study employs multiple linear regression correlation analysis to examine the correlation between indices and climate variables such as precipitation, air temperature, and soil moisture. The findings indicated that the average LST was high (37.11°C–42.83°C), whereas the NDVI was low and unhealthy (<0.33) in the lowland area. It revealed that the lowland region had higher mean LST and lower NDVI values due to less favorable moisture conditions compared to central and highland regions. The regression analysis result revealed a significant strong negative correlation with NDVI and LST (R = -.977, p < .01) across all study districts. This study also identified the existence of positive relationships between VHI and rainfall (R2 = .996, p < .01), VHI and SSM (R2 = .956, p < .01), and NDVI and SSM (R2/p = .97/.01) in all study regions. The study found a positive linear correlation between VDI and VHI with (R2 = .74, p < .01) across the study region, despite negative correlations between NDVI-LST and NDWI-LST. Both VHI and Soil Moisture (SSM) indices serve as valuable indicators for monitoring the development of both meteorological and agricultural droughts in this study area. The study aids in drought monitoring in Northeastern Ethiopian Highland by identifying the most effective drought indices for assessing meteorological and agricultural drought.
Introduction
Drought is a complex natural hazard with global impacts on agriculture, ecology, and socioeconomic systems (Du et al., 2013; Gebremeskel et al., 2020; Pei et al., 2020). The phenomenon can repeatedly cause significant harm to ecology, agriculture, and property potentially disturbing the lives of significant people (Kogan, 1997). Drought threats pose significant challenges to the agriculture sector in African nations, with 80% of direct effects being borne by this sector (Quang et al., 2023). Rainfed agriculture dominates Ethiopia’s crop production, despite the variability of rainfall in most regions of the country (Wakjira et al., 2021). Frequent droughts in Ethiopia, influenced by rainfall variability, have significantly impacted crop production, food market prices, and living costs (Hill & Porter, 2017). This situation results in substantial financial losses, food shortages, and famine for the community in drought-recurring parts of the country (Mera, 2018). The Northeastern Ethiopian Highlands, a region heavily dependent on agriculture, faces significant vulnerability to drought due to its climate variability. North Wollo Zone located in the highlands of Ethiopia experiences frequent droughts, causing famine, displacement, and widespread food shortages, affecting the agricultural economy and posing livelihood challenges (Minale et al., 2024). Therefore, spatial and temporal assessment of drought is crucial for efficient early warning systems, timely response to drought events, and drought management strategies in the region.
Over time, various drought indices have been developed and have become the primary method for monitoring drought conditions. However, traditional drought monitoring methods often lack the spatial and temporal resolution required for accurate assessment of drought conditions. This limitation hinders the development of effective early warning systems, timely response to drought events, and robust drought management strategies. Hence, there is a need for more accurate and reliable drought monitoring techniques that can provide timely information on the onset, duration, and severity of droughts. Remote sensing-based indices offer valuable insights into drought conditions, aiding in better decision-making for water resource management, agricultural planning, and disaster response.
Remote sensing has revolutionized drought monitoring, enabling more efficient and effective mitigation strategies due to intensifying climate variability and increasing frequency and severity of droughts. According to Wang et al. (2020) remote sensing technology has emerged as a reliable tool for monitoring the spatial and temporal patterns of drought events. Remote sensing provides real-time data on atmospheric and land surface variables, enabling estimation of precipitation, evapotranspiration, soil moisture, and vegetation conditions, crucial for monitoring drought intensity and duration. Moreover, satellite data-derived remote sensing drought indices are being developed to accurately measure drought severity and extent, addressing the complex nature of drought and its various applications (Eden, 2012; Su et al., 2017; van Hoek, 2016; Zargar et al., 2011).
Several drought indices, including the Normalized Difference Vegetation Index (NDVI), Land Surface Temperature (LST), Vegetation Health Index (VHI), Vegetation Condition Index (VCI), Standardized Precipitation Index (SPI), Soil Water Deficit Index (SWDI), and Standardized Precipitation Evapotranspiration Index (SPEI), have been developed for multi-scale drought prediction and monitoring (Tran et al., 2017). Among other drought indices, the SPEI is particularly well-established for characterizing drought in semi-arid and arid areas, similar to the conditions in this study area (Sharafi et al., 2022). Multi-timescale flexibility and simple calculation make it a versatile tool for monitoring meteorological and agricultural drought (Angelidis et al., 2012). SPEI has been successfully used for drought monitoring in various regions, including arid and semi-arid areas (Pei et al., 2020), diverse climatic zones (Zarei et al., 2021), and the North Ethiopian Highlands (Tefera et al., 2019).
Factors like soil moisture, potential transpiration, and precipitation should be considered when analyzing droughts using relevant datasets (Cao et al., 2019). Meteorological and agricultural droughts were analyzed using precipitation, soil moisture, or a combination of both and potential evapotranspiration (PET). A comprehensive method for evaluating meteorological and agricultural drought needs to integrate these variables.
This study focuses on drought monitoring in the Northeastern Ethiopian Highland, identifying the most effective drought indices for assessing meteorological and agricultural drought. It is crucial for comprehending the severity, frequency, and spatiotemporal patterns of drought in this region, which heavily relies on agriculture and is susceptible to climate change. Evaluating agricultural and hydrological drought in rain-fed farming communities can inform climate change adaptation strategies, including drought-tolerant crops and enhanced livestock breeds (Obsi Gemeda et al., 2023). Studies related to drought have great importance in improving food security and climate change-related problems, as the availability of food depends on climate conditions. Climate change has exacerbated food insecurity and poverty in northern Ethiopia (Tofu et al., 2022). Effective climate change assessment and monitoring can help mitigate the vulnerabilities of farming communities to extreme climate events, such as droughts and floods (Gemeda et al., 2024). A comprehensive understanding of both agricultural and hydrological drought is crucial for policymakers to assess drought’s impact on socioeconomic activities and implement climate change adaptation measures.
The study aims to identify and appraise meteorological as well as agricultural drought situations in the northeastern Ethiopian highlands by analyzing the correlation between NDVI and LST in regions experiencing water scarcity for vegetation growth, employing remote sensing techniques. The VDI effectively monitors agricultural drought by integrating vegetation conditions, temperature stress, and water deficit, overcoming limitations of other indices like VHI, NDVI, and LST(Sun et al., 2013). This positive correlation can introduce uncertainty in traditional drought indices like the Vegetation Health Index (VHI). The VDI is designed for broad applicability, encompassing diverse regions including high latitudes and elevations, and effectively capturing drought dynamics across various vegetation growing seasons.
The study uses MODIS-derived NDWI, NDVI, and LST to analyze water-limiting factors for vegetation growth, revealing areas and time periods with spatial resolutions up to 250 m and 8 days. This study will also examine the impacts of land cover and altitude on drought conditions, and monitor drought events using VCI, TCI, VDI, and VHI.
Materials and Methods
Location and Description of Study Area
The study area is situated in the northern highland regions of Ethiopia. The study area (Figure 1) is located at 39°06′00.0″ East longitude and 11°55′12.0″ North latitude, with elevation ranges from 941 to 4,197 m. The area is located approximately 490 km from, the capital of Ethiopia (Addis Ababa). It is categorized into four agroecological zones: lowland (tropical), mid-altitude (sub-tropical), highland (temperate), and alpine (Wassie et al., 2022).

Location map of study area (shape files obtained from Ethiopian Map Agency (EMA)).
The study analyzed meteorological data from thirteen stations obtained from the National Meteorological Agency of Ethiopia, revealing annual temperature ranges of 27.42°C to 12.99°C and rainfall of 870 to 1,300 mm in the North Wollo Zone (Figure 2). The North Wollo Zone’s mountainous terrain with steep slopes is unsuitable for agricultural activities, severely limiting the cultivated area. In the North Wollo Zone, the dominant domestic crops that are grown in the region are barley, wheat, teff, sorghum, and maize, which are the main food crops, produced in a rain-fed farming method (Minale et al., 2024). Moreover, fruit and vegetable crops such as onion, tomato, cabbage, beetroot, and watermelon are often produced through irrigation in some parts of the region. The North Wollo Zone is home to 1,763,245 inhabitants and comprises 88.9% of the district’s rural population (Hassen, 2021). The land use land cover revealed a land distribution of 24% arable or cultivable land, 4.6% pasture, 17.4% shrub land, 0.37% forest, 47.3% degraded or unusable land, and 6.3% other land uses.
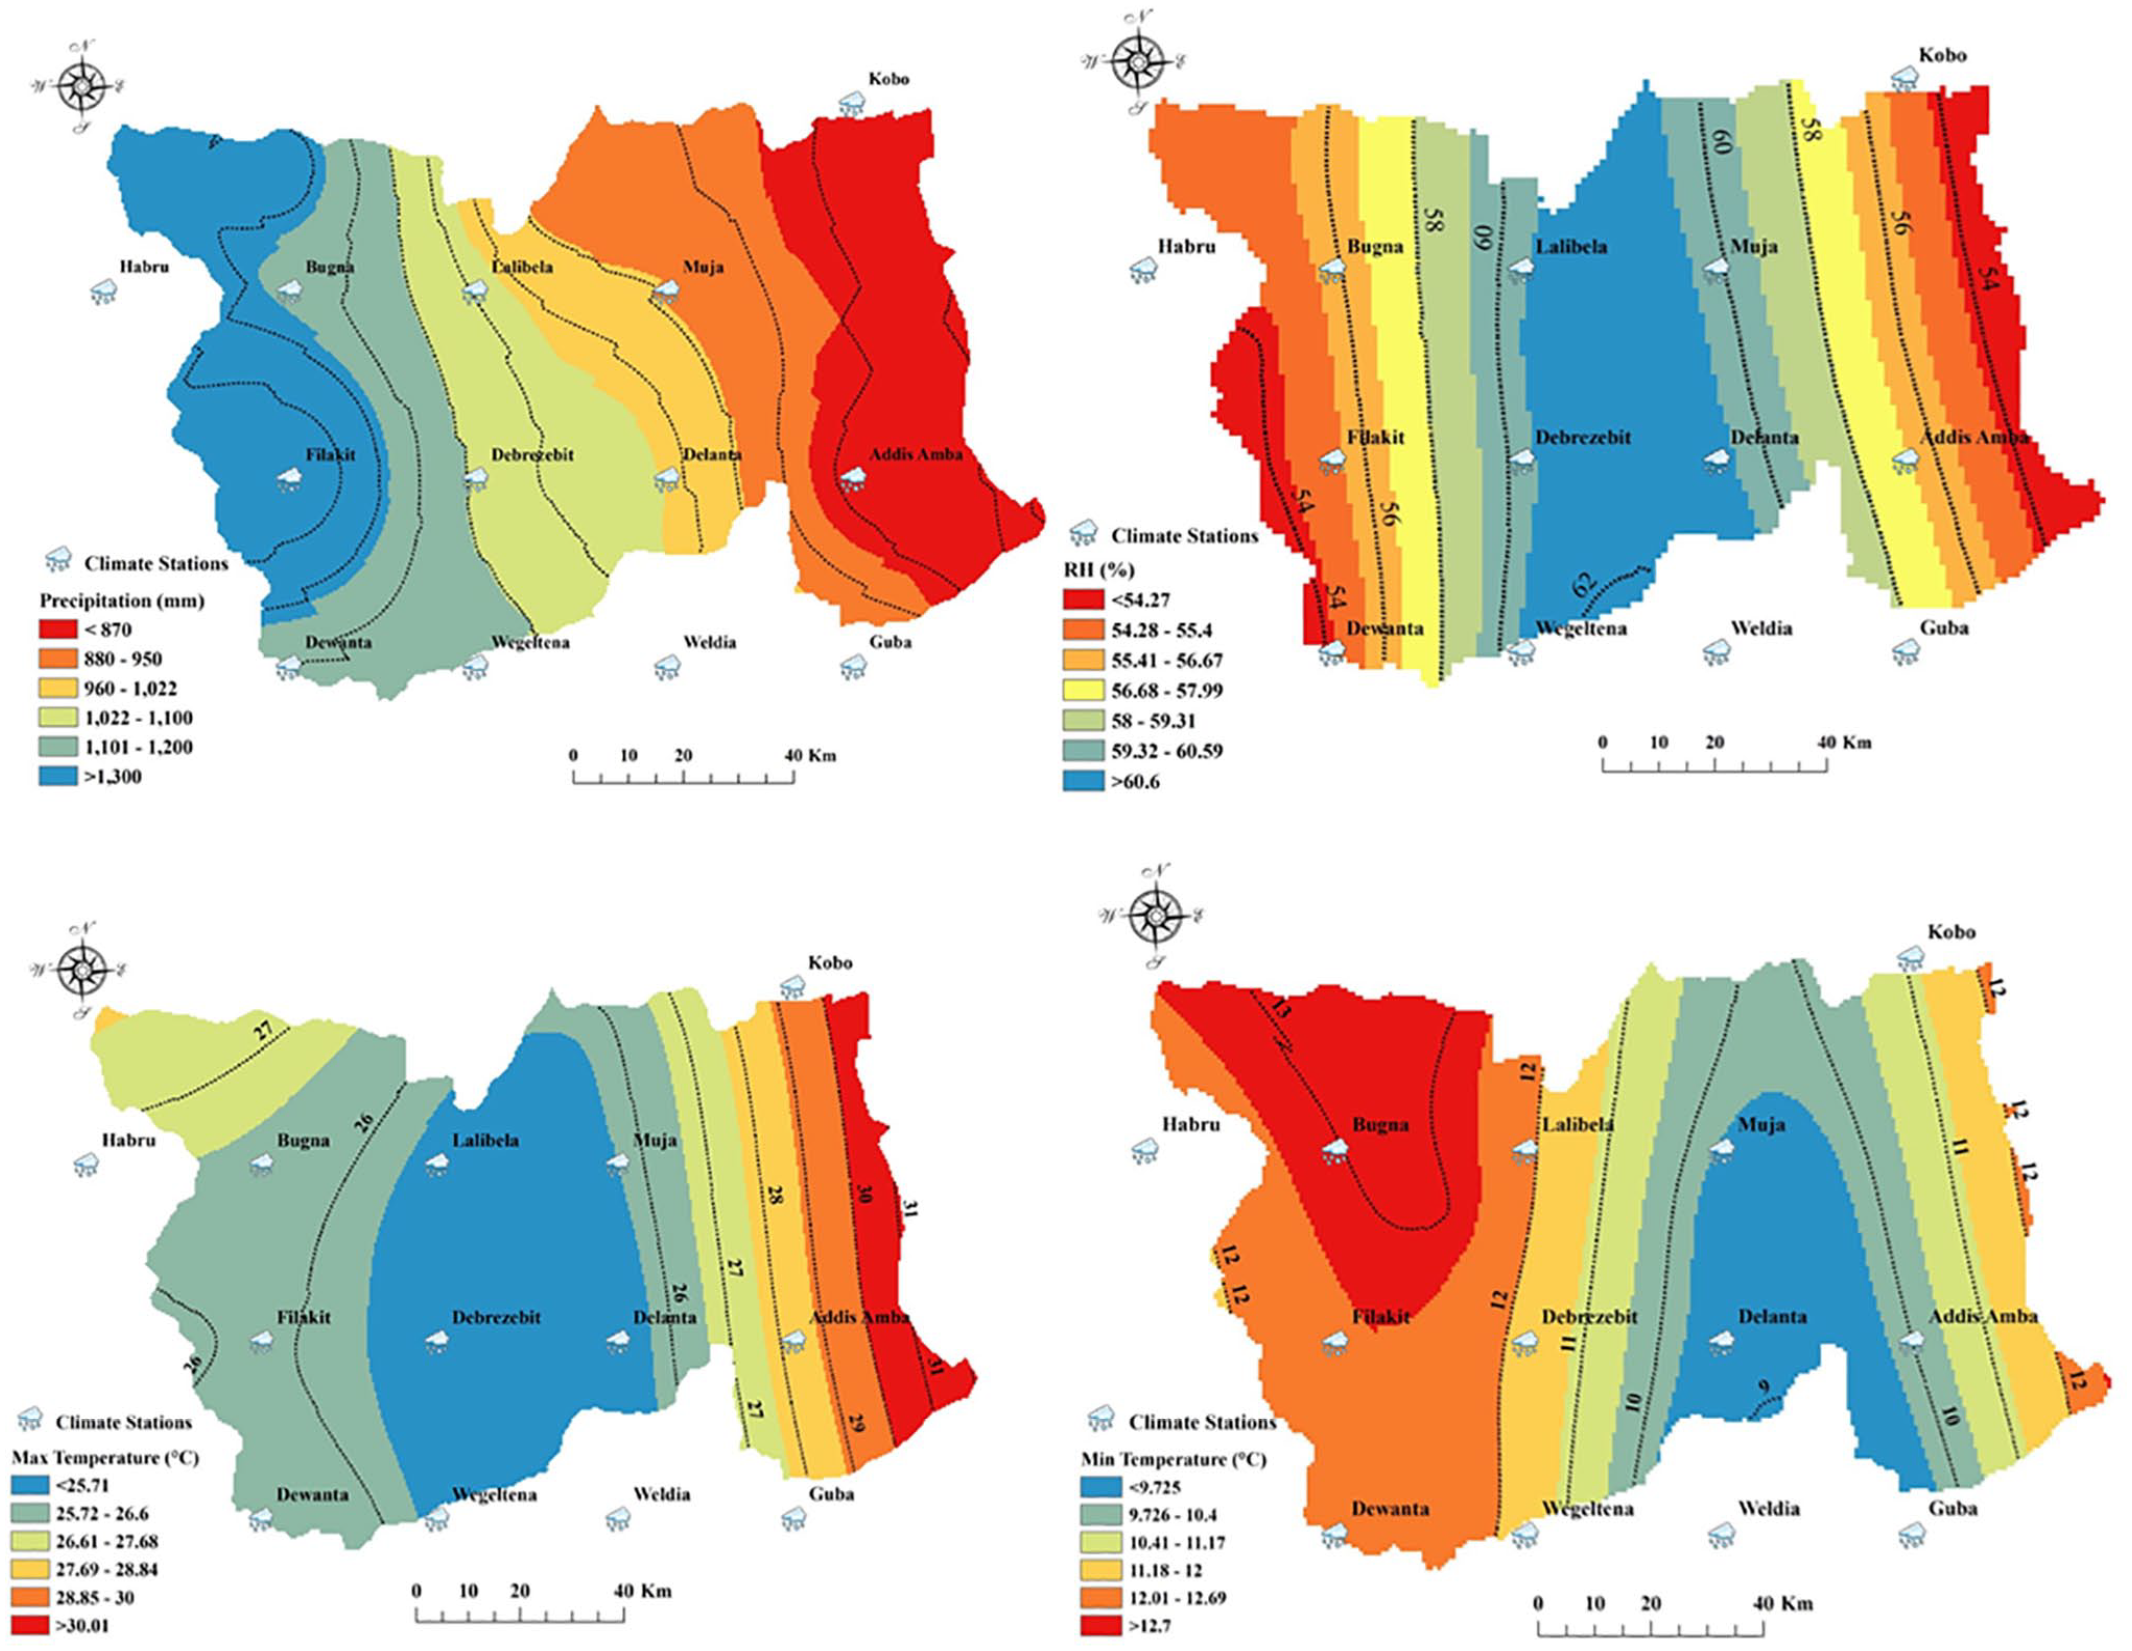
Average precipitation, relative humidity, and temperature extremes in the study region.
Dataset Description and Preparation
This study employed both ground-based meteorological data and remote sensing data. Data types, sources, and resolutions used in this study are presented in Table 1. Monthly precipitation, minimum, and maximum temperature data from thirteen measuring stations within the North Wollo Zone were obtained from the Meteorological Agency of Ethiopia (NMAE) for the years 1981 to 2022. The arithmetic mean method was used to fill in missing data for Kobo, Weldia, and Filakit stations, where the average rainfall and temperature deviated less than 10% from their annual norms (Radi et al., 2015). The normal ratio method was applied to meteorological stations where the normal average annual values exceeded a 10% difference from surrounding stations.
Data Type, Sources With Spacio-Temporal Resolutions.

Satellite data such as surface soil moisture and MOD11A2 NDVI with a resolution of 1 km with the years ranging from 2000 to 2022 were acquired from the NASA Power Data Service (https://power.larc.nasa.gov/) and NASA Earth Observatory data webpage (https://lpdaac.usgs.gov/). Monthly NDVI and LST data derived from Terra-MODIS were employed to assess both meteorological and agricultural drought conditions within the study region. MODIS NDVI product (MOD13Q1) Version 6.1 with a spatial resolution of 250 m, 16-day time interval, and years ranging from the year 2000 to 2022 were used. The MODIS product, MOD11A2 was used to characterize Land Surface Temperature (LST) every 8 days from 2000 to 2022, with a spatial resolution of 1 km. The MOD11A2 product consists of both day and night temperature datasets. The Vegetation Condition Index (VCI) and Temperature Condition Index (TCI) were calculated using NDVI and LST data spanning 2000 to 2022. Conversely, the Standardized Precipitation Evapotranspiration Index (SPEI) was computed using precipitation and temperature data from 1981 to 2022. The study utilized surface soil moisture (SSM) data for 13 meteorological stations acquired from NASA’s Prediction of Worldwide Energy Resources (POWER) project (https://power.larc.nasa.gov). POWER provides a comprehensive dataset of environmental variables, including monthly SSM for various locations. To ensure data accuracy and compatibility with ground observations, the SSM data was validated against rainfall data from ground-based stations.
Methods
Estimation of Normalized Difference Vegetation Indices (NDVI)
The relationship between vegetation patterns and hydro-climatic factors was assessed using NDVI. NDVI is a widely adopted satellite-based index recognized for its efficient and reliable calculation in monitoring vegetation cover across diverse climatic conditions (Kumari et al., 2019, 2020, 2021; Rouse et al., 1973) Mathematically it is expressed as in Equation 1:

Where;
NDVI is commonly a vegetation proxy due to its strong correlation with biophysical parameters such as cover to vegetation, canopy dynamics, leaf area index, and biomass (Huete et al., 2002; Kumari et al., 2020). Raw MOD13Q1 data was processed and resampled using ArcGIS to derive accurate NDVI values for the study region using Equation 2.

The values of MODIS NDVI range from −1 to +1, with the NDVI ratio serving as the standard unit of measurement. Negative NDVI values, indicative of unhealthy vegetation and often associated with bare rock or sand-covered areas, contrast with positive values representing healthy vegetation cover. NDVI values exhibit significantly higher values in areas dominated by healthy, dense vegetation compared to those covered by rocks, lakes, or bare soil (Kogan, 1995). A moderate NDVI value of 0.2 to 0.5 are low vegetation cover, like grasslands or bushes/shrubs while high NDVI values of 0.6 to 0.9 indicate dense vegetation cover in temperate and tropical forests, or crops at their peak development stage. The study used MODIS NDVI data to calculate the VCI, demonstrating its effectiveness in assessing the greenness of vegetation (determined for the years ranging from 2000 to 2022).
Estimation of Vegetation Condition Index (VCI)
Various indices have been yet developed to assess drought characteristics (Mishra & Singh, 2011). The remote sensing-derived VCI has been employed in conjunction with vegetation cover (Karnieli et al., 2010). The VCI is essential for monitoring vegetation stress and response, estimating changes in vegetation, and evaluating the impact of meteorological conditions on vegetation (Kogan, 1990). For this study area, to develop the VCI model, raw monthly MODIS NDVI data were utilized as input. Kogan (1995) emphasized that VCI is effective at recognizing drought and accurately quantifying drought onset, drought intensity, drought duration, and drought impact on plants. The VCI model was utilized to evaluate agricultural drought from 2000 to 2022 in this study area. Mathematical it is expressed as in Equation 3.

Where, NDVIi represents the ith month NDVI value, while NDVImax and NDVImin denote the maximum and minimum NDVI values across all pixels and time periods respectively.
The extent of vegetation growth or decline caused by weather is reflected in VCI values. VCI, as defined by Kogan (1995), is a 0 to 100 scale measuring vegetation health, where higher values indicate healthy, drought-free areas. A high VCI value (50%–100%) indicates healthy vegetation and no agricultural drought, while lower values (35%–50% for moderate and 20%–35% for severe) suggest increasing drought conditions in the study area. Additionally, a seasonal or annual VCI rating falling within the 0% to 20% range indicates an extremely severe agricultural drought event (VSD). Despite its effectiveness, the NDVI-based VCI model might not be fully reliable for monitoring agricultural droughts under specific conditions (Sholihah et al., 2016).
MOD11A2 Land Surface Temperature Data
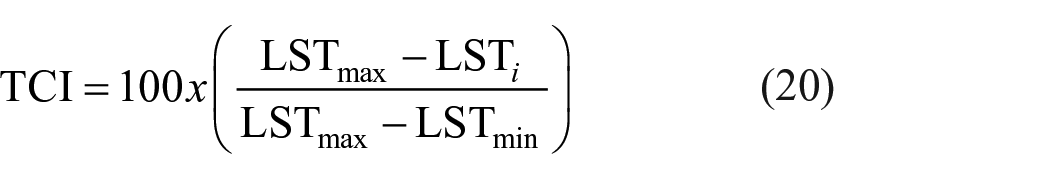
Land Surface Temperature (LST) is a crucial component of land surface physics, providing insights into the energy exchanges occurring at the earth’s surface, both regionally and globally (Parviz, 2016). Terra-based MOD11A2 LST products measure the earth’s surface temperature, with values accurately determined by averaging clear-sky pixels and rescaling by 0.02 K. For this study area, TCI and LST calculations required rescaling and conversion of data to degrees Celsius (°C). TCI measures temperature-related drought determined for the years 2000 to 2022. Satellite imagery revealed a marked decrease in soil moisture during the dry period, causing substantial vegetation stress. Higher TCI values, which indicate increased vegetation stress or decline, are associated with lower plant health, while lower TCI values, which generally promote healthy growth and development, were estimated using the following equation (Equations 4 and 5) along with LST.

Where, LST represents the land surface temperature in degrees Celsius (°C), while
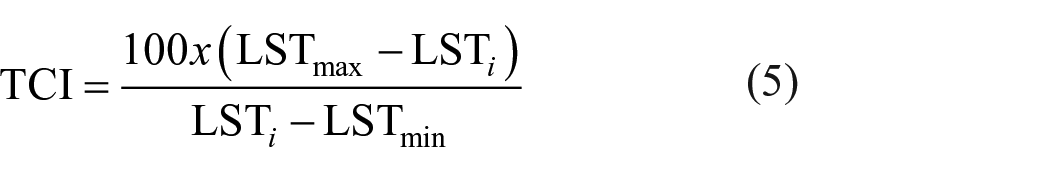
Where, LST i represents the ith month LST value and LSTmin and LSTmax represent the minimum and the maximum LST value across multiple years.
Estimation of Vegetation Health Index (VHI)
The VHI integrates both VCI and TCI to evaluate the combined effects of moisture and temperature on plant growth. It is investigated by combining moisture-based VCI and temperature-based TCI indices for the years 2000 to 2022 as indicated in Equation 6.
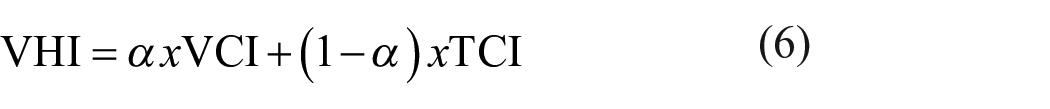
Where, an equal to 0.5 (which is the contribution of both VCI and TCI). The lower value of VHI signifies a heightened risk of agricultural drought, while a higher VHI indicates favorable conditions with minimal drought risk (Table 2).
Agricultural Drought Class for the Corresponding (VCI, TCI, and VHI) Indices (Kogan, 2002).

Estimation of Standardized Precipitation Evapotranspiration Index (SPEI)
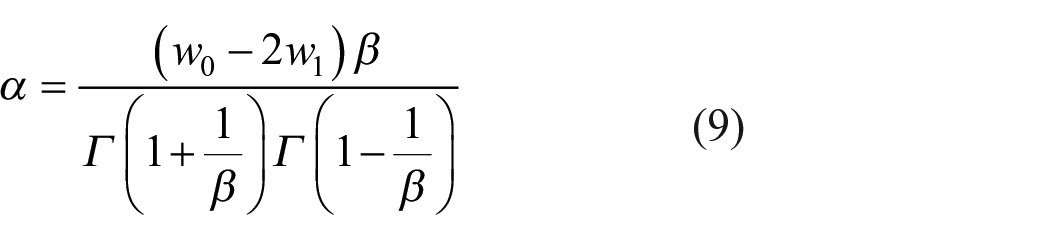
SPEI comprehensively assesses drought conditions by considering both precipitation and potential evapotranspiration. Meteorological and agricultural droughts were categorized using SPEI analyses at different time scales (1, 3, and 6 months) for the period 1981 to 2022. The SPEI was computed using the SPEI package (Masupha & Moeletsi, 2017; Tirivarombo et al., 2018), and is a freely available statistical computing and graphics environment within the R software. SPEI utilizes a three-parameter distribution to quantify moisture deficits, accounting for the possibility of negative values in both arid and semi-arid regions. Tirivarombo et al. (2018) calculated SPEI using potential evapotranspiration differences and non-exceedance probability of precipitation adjusted using log-logistic distribution. The D series optimal statistical distribution selection was difficult due to the similar characteristics of Lognormal, Pearson III, General Extreme Value, and Log-logistic distributions. The selection criterion was based on the most extreme values. The log-logistic distribution exhibits a gradual decline in the curve for lower values, offering reasonable probabilities even for extremely low D values, corresponding to events anticipated to occur only once in 200 to 500 years. Due to its superior fit for extreme negative values, as suggested by Hernandez and Uddameri (2014), the log-logistic distribution was recommended for SPEI calculations. The Log-logistic distribution, with three parameters, has a probability density function that is expressed as:

Where α, β, and γ represent the scale, shape, and location parameters, respectively, for D values within the interval γ to ∞.
Fawad et al. (2019) recommend the L-moment method as a robust and simple way to estimate Log-logistic distribution parameters.

Where, Γ (β) represents the gamma function of β.
Parameters of the log-logistic distribution were estimated using the Probability Weighted Moments (PWM) method as described by Hosking (1990). This method, which utilizes a plotting-position approach, calculates the PWMs of order s were calculated according to Equation 11.

Where N is the total data numbers, Fi is a frequency estimator computed using the Hosking (1990) method, and Di is the difference between p and PET for the ith month.
SPEI standard deviation varies significantly with timescale, impacting spatial comparisons of the SPEI values in the Plotting Position formula. Conversely, the SD of the series remains constant throughout the various SPEI time scales if the PWMs are acquired using the impartial estimator provided by Hosking (1990). The unbiased PWMs are obtained according to Equation 12:

The method addresses the issue of no SPEI model solution in certain global regions, recommending the use of Unbiased PWMs for SPEI calculation. According to the Log-logistic distribution, the probability of observing a specific value of D is given by the following probability density function as described in Equation 13.

SPEI is calculated by standardizing F(x) values, as shown by Abramowitz and Stegun (1965).
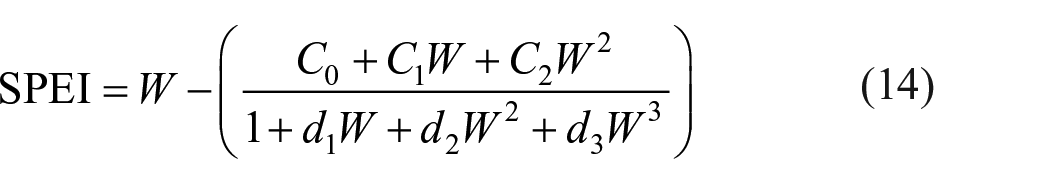

For p ⩽ .5, the probability of exceeding a given D value, denoted by p, is calculated as p = 1 - F(x), using the constants C0 = 2.515517, C1 = 0.802853, C2 = 0.010328, d1 = 1.432788, d2 = 0.189269, and d3 = 0.001308.
The SPEI has a mean = 0 and a standard deviation = 1. The standardization of SPEI allows for direct comparisons of drought conditions at different locations and time periods. SPEI of 0 in a Log-logistic distribution indicates a value equal to 50% of the cumulative probability of D. Table 3 shows the classification of SPEI.
Classification and Characterization of SPEI (McKee et al., 1993).

SPEI can assess both short and long-term droughts using various timescales (1, 3, 6, and 12 months). Since crop development is a stage-based process with each stage lasting approximately 1 to 3 months, we concentrated on analyzing short-term drought conditions using 1- and 3-month SPEI time scales.
There are various methods for evaluating potential or reference evapotranspiration. The three primary types of these computation techniques are empirical estimates, analytical techniques based on climate variables, and hydrologic or water balance techniques (Yates & Strzepek, 1994). Physically based models are limited to laboratory settings, while mathematical models like Penman-Monteith and Priestley-Taylor offer a practical approach to describing evaporation and transpiration by focusing on energy balance and mass transfer principles. Empirical methods, which largely rely on temperature data, became widely used due to their relatively low data demands. Despite their site-specific nature and calibration needs, empirical methods are popular due to their relatively low data requirements. Some of the Empirical Methods include the equations of Hargreaves, Thornthwaite, and BlaneyeCriddle. The thornthwaite method described in Equation 16 was utilized in this study as it relied solely on average temperature data.

Where, N = mean monthly sunshine hours (h/day); m = number of days a month; and Tmean is the mean monthly temperature (

Where, I represent the heat index, estimated as the sum of the 12 monthly values (Equation 18).

After estimating the value of PET then we can determine Di is the difference between precipitations (P) and PET of each month using Equation 19.

The Di equation provides a simple method for calculating monthly water surpluses or deficits, and the same aggregation process used for SPI can be applied to Di values at different time scales.
Estimation of Vegetation Drought Index (VDI)
The Vegetation Drought Index (VDI) is a useful tool for evaluating drought conditions, especially in areas where vegetation significantly influences ecosystem function. By integrating vegetation health and climatic factors, the VDI offers a more holistic assessment of drought conditions, as highlighted by Hao and Huete (2011). Kogan (1995) demonstrated that the Vegetation Drought Index (VDI) exhibits an earlier detection capability for drought conditions compared to traditional rainfall-based indices, enabling more proactive response and mitigation measures. The VDI can be generated at various spatial and temporal scales, providing valuable insights into drought patterns and dynamics (Huete et al., 2002). Furthermore, remote sensing data can be utilized to generate VDI, enabling large-scale monitoring and assessment of drought conditions (Maki et al., 2004).
The effectiveness of Vegetation Health Index (VHI) hinges on the assumption of an inverse relationship between the Normalized Difference Vegetation Index (NDVI) and Land Surface Temperature (LST) within a given pixel over time. However, this assumption may introduce significant uncertainty in VHI-based drought monitoring, particularly in areas with complex terrain, such as Ethiopia, where variations in topography and land cover can disrupt this expected inverse relationship.
VDI is derived from the classical VHI by replacing NDVI and LST with the Normalized Difference Water Index (NDWI) and day-night Land Surface Temperature (LST) differentials.
Similar to VCI, the water condition index (WCI) was defined to separate short-term weather-related NDWI fluctuations from long-term ecosystem changes. Higher WCI values correspond to greater humidity, whereas extremely low values show the occurrence of drought. The day-night temperature difference condition index (TCI) was employed to characterize variations in soil water content and is calculated using the following equation:
Where, LST i represents the LST value for the ith month, and LSTmin and LSTmax represent the minimum and the maximum LST value across multiple years.
The Vegetation Drought Index (VDI) is expressed in Equation 21 (Sun et al., 2013).

Where α the the weight which determines the relative importance of WCI and TCI in assessing drought severity. Since both WCI and TCI are considered equally important contributors to agricultural drought in this study, α is set to 0.5.
Multiple Linear Regression Analysis
Multiple linear regressions extend from simple linear regression by incorporating multiple independent variables. Multiple linear regression is used to analyze the relationship between NDVI and multiple environmental factors, including precipitation, soil moisture, LST, air temperature, and SPEI. This statistical method is employed to predict NDVI values based on the values of these variables. A multiple linear regression model with k predictor variables (x1, x2, . . ., xk) and a response variable (y) can be mathematically represented as:
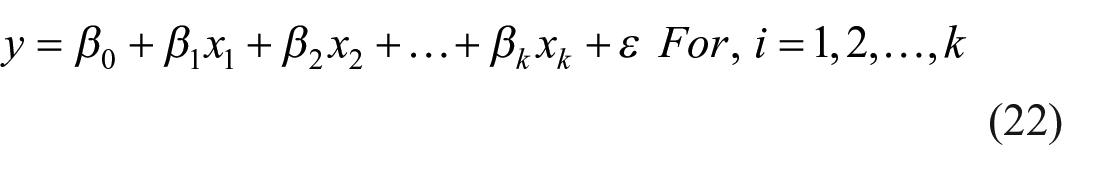
Where, ε represents the residual error terms, which the model seeks to minimize.
NDVI is the dependent variable (y), while the independent variables (x1, x2, . . ., xk) represent precipitation, soil moisture, LST, SPEI, and temperature. β0 is the intercept, and β1, β2, . . ., βk are the coefficients corresponding to each independent variable.
It is ensured that the assumptions for multiple regression analysis were met before analyzing our data. The linear nature of the relationship between NDVI and the independent variables was confirmed by scatter and partial regression plots. The detailed methodology framework is given in Figure 3.
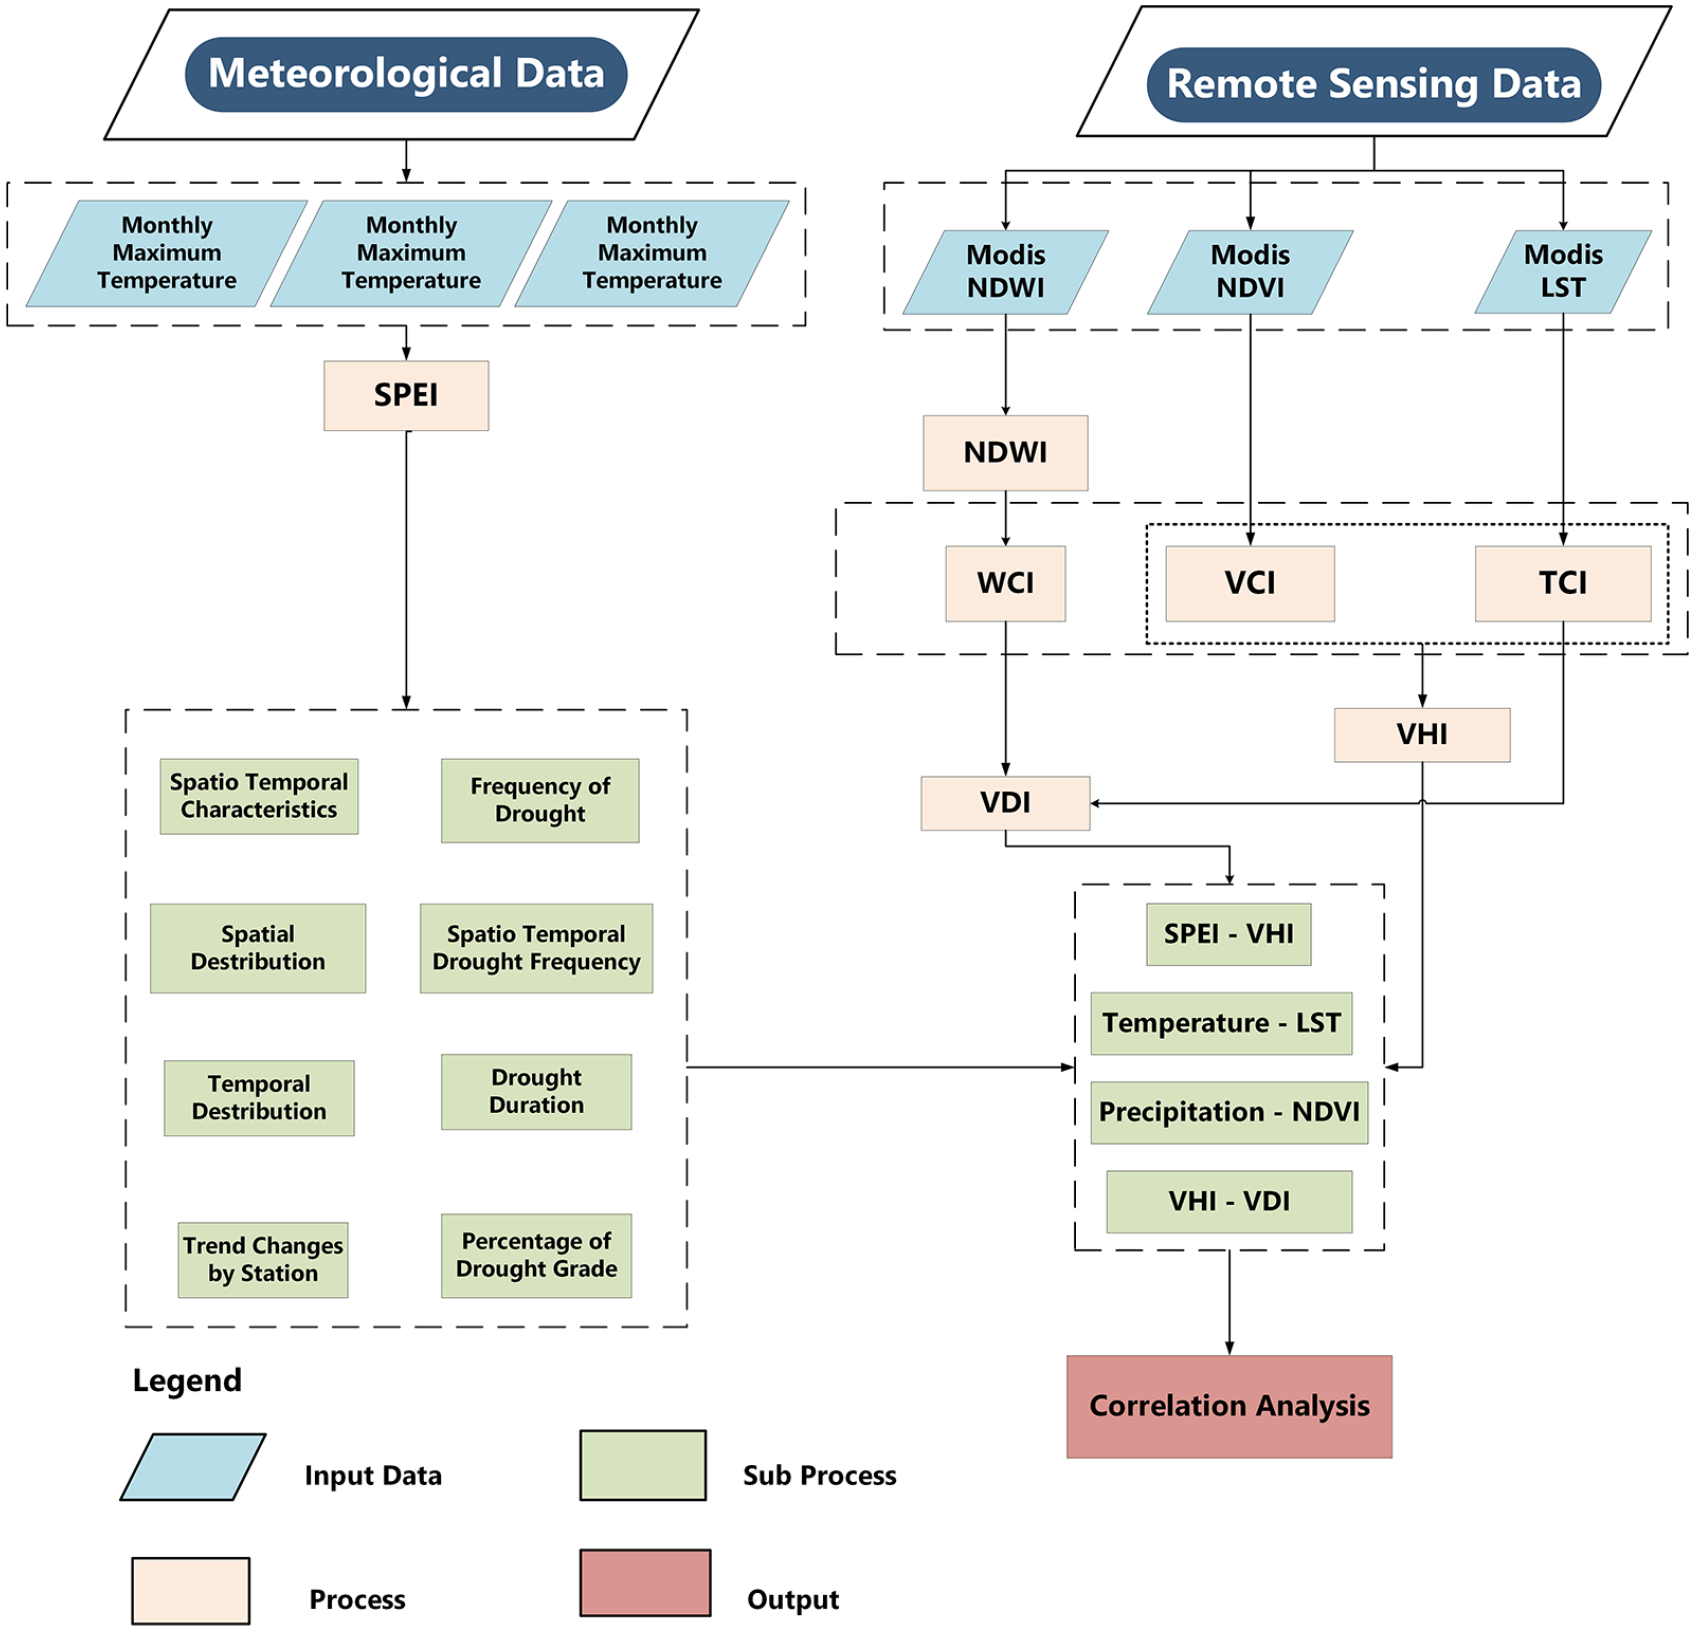
Methodological framework of drought characterization.
Results
SPEI-Based Agricultural and Metrological Drought Analysis
This study considered a time series of drought indices from 1981 to 2022 for all the stations. SPEI provides in illustrating meteorological and agricultural drought patterns both spatially and temporally. SPEI values for 1-, 3-, and 6-month time scales were used to assess meteorological and agricultural drought conditions in the region. A total of 13 metrological stations illustrated how SPEI values change over time. Figures 4 to 6 illustrate the time series of monthly SPEI values from 1981 to 2022, considering 1-, 3-, and 6-month timescales. Separate panels are used to display the SPEI plots for 1-, 3-, and 6-month timescales to facilitate easier comparison and analysis of trends. As seen from the figures both timescale changes and drought events also change. Drought events are identified based on a specific threshold with SPEI values below −0.5 and are considered drought-prone.
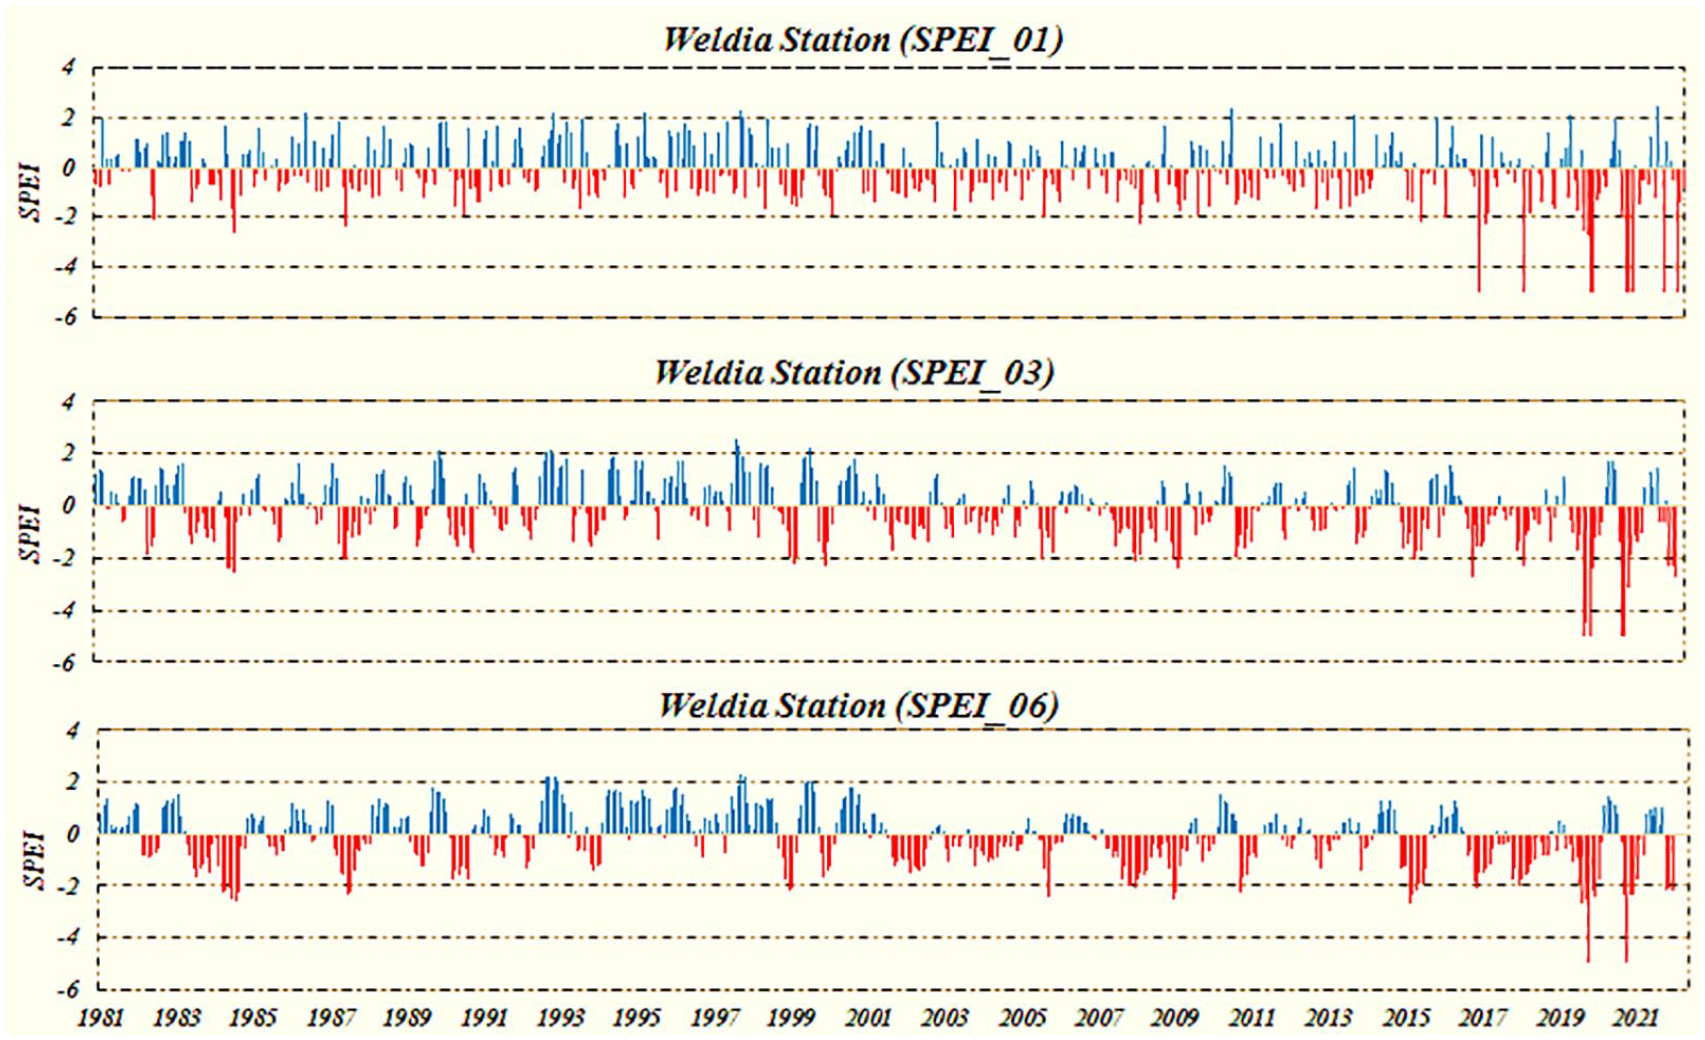
Temporal SPEI values at Weldia station.

Temporal SPEI values at Addis Amba, Dawanta, Debre Zebit, Delanta, Filakit, and Gergera stations.

Temporal SPEI values at Guba, Kobo, Lalibela, Merssa, Muja, and Wegeltena stations.
For timescales of 1- and 3-month SPEI values fluctuate frequently, indicating seasonal meteorological droughts with short durations (Figure 4). In contrast, the 6-month timescale (Figure 4) reveals fewer, but more prolonged negative SPEI periods, indicating widespread agricultural drought conditions in the region. Negative SPEI values indicate dry conditions, while positive values signify humid periods.
Table 4 shows that the SPEI time series analysis reveals both dry and wet years in the region, indicating a characterization of meteorological and agricultural drought. SPEI-03 (June–August) index indicates whether rainfall during this period was above or below the mean throughout the study period. The study identified four severe droughts in 1984 to 1985, 1987 to 1992, 2002 to 2007, and 2011 to 2022, each with SPEI values exceeding −2, indicating the driest year in the period. The meteorological drought indices indicate severe drought conditions in most stations between 1982, 1984, 1989, 1993, 2013, 2015, and 2019. Whereas the agricultural drought indices indicate severe drought conditions in 1982, 1984, 1989/1990, 2008/2009, and 2022. Agricultural 6-month drought indices and meteorological 1- and 3-month drought indices showed similar patterns in 1982, 1984, 1989/1990, 2008/2009, and 2022, despite the severity of the drought in other indices.
Meteorological and Agricultural Drought Characterization Using SPEI Time Series.

The 1984 drought, the first in the study period, began in August with an SPEI-3 of −2.61, followed by the 1987, 2012, 2015/2016, and 2022 droughts. The severe drought, spanning from June to August, with a magnitude of SPEI-03 = −2.34, −2.35, −2.05, −2.21, 2.2, and −2., severely impacts various sectors. A drought occurring at the beginning of the planting season can result in agricultural drought. Monthly drought assessments are valuable for understanding its onset, duration, and severity.
NDVI Trends and Patterns
In this study, NDVI was used to assess agricultural drought in the area from the year 2000 to 2022, focusing on the June to September growing season. Figure 7 depicts NDVI values during the June to September growing season from the year 2000 to 2022, revealing both spatial and temporal variations in drought severity. It also highlights slight vegetation stress in the North Wollo Region from 2010 to 2022. Agricultural drought significantly affected the western and central regions of the study area between the years 2000 and 2009.

Temporal NDVI Dynamics (June–September) for the year ranging from 2000 to 2022.
Analysis of Spatial and Temporal Land Surface Temperature (LST) Patterns
The most severe drought events are characterized by the highest temperature values, whereas low-temperature values are indicative of minimal or negligible drought. Figure 8 depicts LST variations during the growing season, which is June to September (for the years 2000–2022). In 2001, 2004/2005, 2007, 2016, and 2020, high temperatures were reported in the western, southern, northern, and southeastern parts of the study region. The highlands experienced more moderate temperatures compared to the lowlands, which recorded the highest temperatures. The central region is predominantly highland. The results of LST indicated a deficiency in appropriate soil moisture within the area, which may have hindered the uptake of nutrients by plants and consequently led to plant stress.
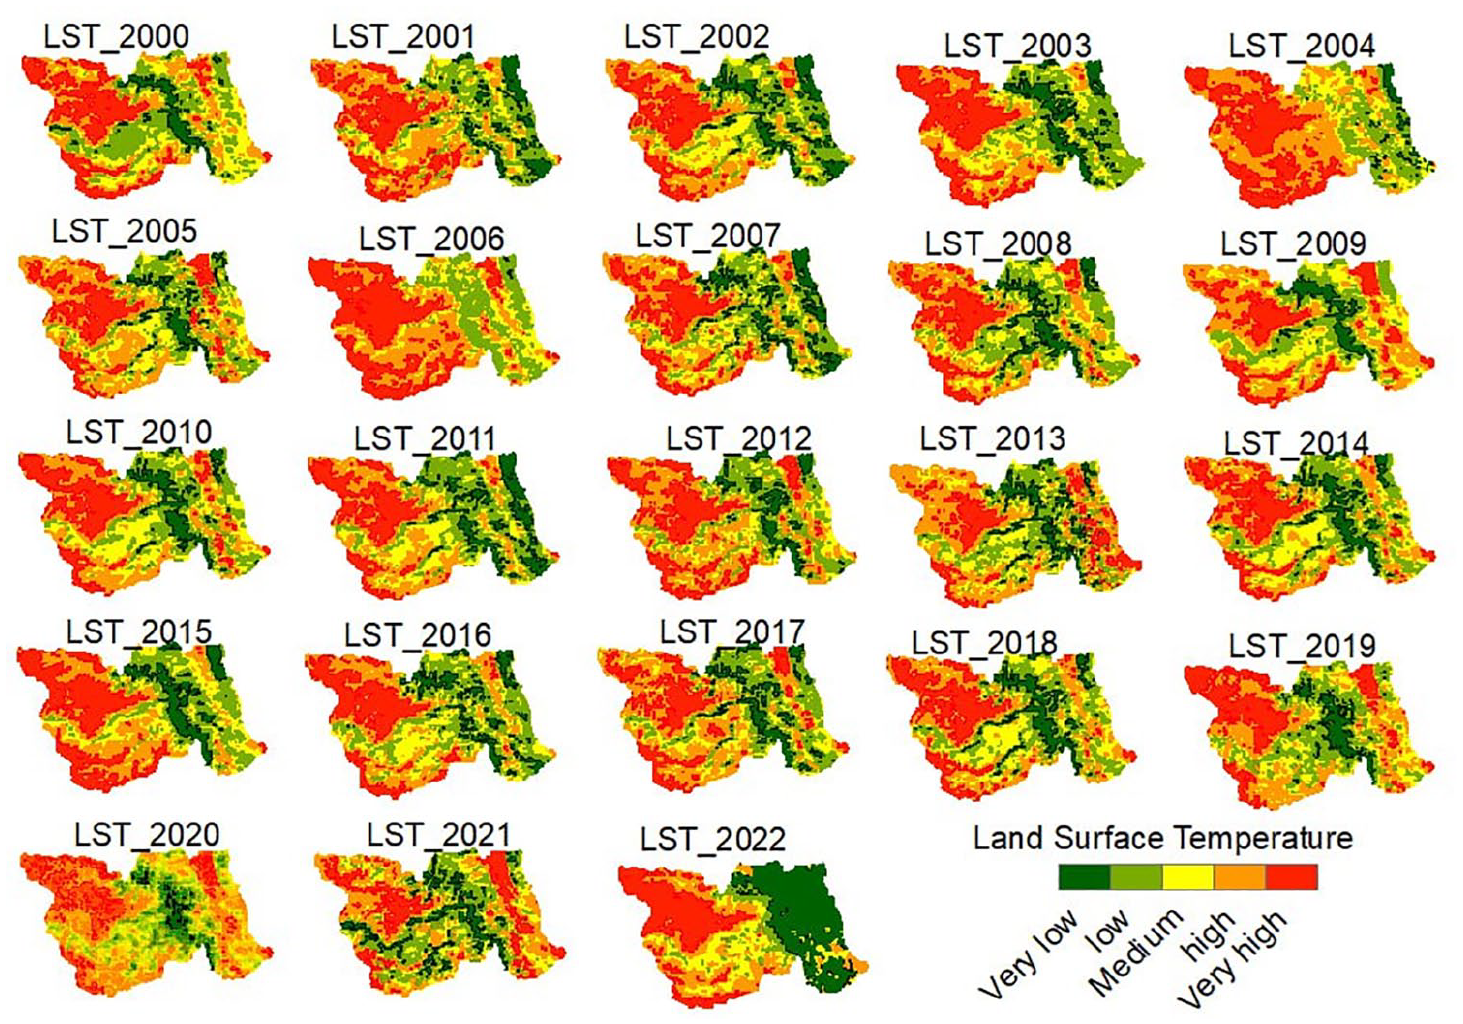
Temporal trends in land surface temperature during the growing season (2000–2022).
Characterizing Drought Using Vegetation Condition Index
VCI was used to identify the spatial distribution of drought conditions during the crop-growing season. Numerous studies have validated VCI as a valuable tool for agricultural drought monitoring (Barrett et al., 2020; Bento et al., 2020; Kogan, 1995; Quiring & Ganesh, 2010; Singh et al., 2003). Figure 9 shows how drought, as detected by VCI, evolved spatially and temporally across the study region over the past two decades during the growing season. The growing season, characterized by peak vegetation growth, highlights the VCI’s effectiveness in detecting drought and assessing vegetation health. The year 2015 was characterized by particularly low VCI values, especially in lowland areas, leading to compromised vegetation health. As indicated by Kogan (1995), these low VCI readings are indicative of drought conditions. During 2016, the entire region, including the highlands, experienced three consecutive months of minimal VCI (June, July, and August), with the exception of the northwest and central areas. Minimum VCI values signify drought conditions. Moisa et al. (2022) found that areas with full vegetation cover are less susceptible to severe drought. In contrast to the high VCI values observed in the southern and southeastern regions in 2018 and 2019, the eastern and southeastern regions experienced drought conditions in 2007, 2012, and 2013, as indicated by low VCI values (Figure 9).

VCI-based drought assessment in North Wollo.
Temperature Condition Index (TCI)
TCI, a drought index that incorporates LST, is more sensitive to both dryness and excessive moisture conditions than VCI, making it a more accurate indicator of agricultural drought (Jiao et al., 2016; Kogan, 1995). TCI is capable of identifying both dry and wet conditions within a specific region. The spatiotemporal variability of droughts, as detected by the LST-based temperature condition during the crop-growing season is shown in Figure 10. Vegetation in many parts of the study area faced severe stress due to high temperatures and inadequate rainfall. The western part of the study area experienced low TCI levels in 2018 and during the 2020/2021 period. The entire study area experienced high TCI values in 2019. Notably, the southern and eastern regions consistently recorded high TCI values throughout the study period, except for 2000.

Spatiotemporal distribution of drought based on LST in North Wollo (2000–2022).
Drought Analysis Using VHI
The VHI, calculated from NDVI data, effectively identifies agricultural drought conditions. VHI is a derived index based on the weighted combination of VCI and TCI. Various research efforts (Bento et al., 2020; Gebrehiwot et al., 2011; Liou & Mulualem, 2019; Sholihah et al., 2016) have employed VHI to assess drought conditions. Figure 11 depicts the spatial and temporal changes in drought conditions, as measured by VHI, within the study area. The central, northern, western, and southwestern parts of the study region, primarily reliant on rain-fed agriculture, experienced severe to extreme droughts in the periods 2002, 2003, 2004, 2009, 2010, 2012, 2015, and 2022. North Wollo experienced both severe and extreme drought conditions in June and August 2002, but showed no signs of extreme drought in 2020. There were both extreme and severe droughts in 2006, 2008, 2010/2011, and 2013/2014, with the highest recorded (Figure 11). VHI data indicates that severe drought conditions were prevalent in a large region in the year ranging from 2001–2002. Lowlands of North Wollo, including the western, northern, and central parts, have also experienced extreme drought conditions. It is shown that the growing season is a crucial time for maximum vegetation growth, demonstrating the effectiveness of VHI in detecting drought.

Spatial and temporal drought patterns in North Wollo Using VHI (a combination of VCI and TCI) for the year 2000 to 2022.
Correlation Analysis of Drought Indices
Figure 12 illustrates the relationships between various drought indices and meteorological factors. The analysis reveals a strong positive relationship between VHI and rainfall (R2 = .996, p < .01), and a significant relationship between VHI and SSM (R2 = .956, p < .01). Additionally, a strong positive association is observed between NDVI and rainfall, as well as between NDVI and SSM (R2 = .97 and .97). Dutta et al. (2015) identified a strong correlation between VCI and meteorological indices, such as the Rainfall Anomaly Index (RAI) and Yield Anomaly Index, in India. Wan et al. (2004) investigated a direct relationship between the Vegetation Condition Index and monthly precipitation in the southern Great Plains of the USA. Gidey et al. (2018), identified a strong relationship between vegetation health indices (VHI) and rainfall in Ethiopia’s agro-climatic regions. Several factors, including topography, contributed to the strong regression results in this study area. A statistically significant relationship (p < .01 and <.05) exists between VHI and rainfall in all study districts. Additionally, regression analysis within this study area revealed a direct relationship between agricultural drought, measured by the VHI, and both rainfall and surface soil moisture (SSM). The analysis indicates a positive correlation between rainfall and the VHI, suggesting that increased rainfall is associated with reduced agricultural drought. Furthermore, the study found a moderate inverse relationship between the Normalized Difference Vegetation Index (NDVI) and Land Surface Temperature (LST), with a correlation coefficient of −.977 and a p-value of .007, indicating a statistically significant association (Figure 12). An increase in LST is often accompanied by a decrease in NDVI values, potentially indicating vegetation stress and contributing to agricultural drought. This inverse relationship between NDVI and LST has been previously documented by Gebrehiwot et al. (2011) and Reiners et al. (2023). As found in previous studies, such as Shashikant et al. (2021), our analysis revealed a strong inverse relationship between LST and NDVI. The observed inverse relationship between NDVI and LST, with higher NDVI values associated with lower LSTs, is likely due to the increased moisture content in vegetation during wet seasons, which can vary based on land cover types (Guha & Govil, 2020). In water-limited areas, where vegetation cover is sparse due to drought or arid conditions, evapotranspiration is reduced, leading to higher surface temperatures and reinforcing the negative correlation (Bhaga et al., 2020). This holds true in the study area, which is characterized by sparce vegetation cover and variability in rainfall and topography.

Linear regression between drought indices and meteorological factors.
Comparative Analysis of VDI With VHI and Other Drought Indices
This study proposes a drought detection index, the Vegetation Drought Index (VDI),for comprehensive agricultural drought monitoring across the study region. The study utilized Terra Moderate Resolution Imaging Spectroradiometer (MODIS) MOD11A2 and MOD13Q1 products from 2000 to 2022, along with monthly precipitation data from 1981 to 2022 to evaluate VDI. Results revealed a positive correlation between NDVI and precipitation across many areas within the study region, while a negative correlation between NDVI and LST was observed in most locations. The relationship between VDI and VHI is modeled using linear equation i.e (VDI = 1.42VHI - 7.97) and a significant linear correlation was observed across the study region with a coefficient of determination (R2) of .74 as illustrated in Figure 13 where both the NDVI-LST and NDWI-LST correlations were negative. Furthermore, the study found a significant correlation between VDI and SPEI values, similar to the correlations observed between VHI and SPEI.

Correlation analysis between VDI and VHI (p < .01) across the study region.
The findings demonstrate the potential of the newly developed VDI to effectively monitor agricultural drought across the entire study area, even in regions and periods where the NDWI-LST correlation exhibits a negative relationship. VDI validity relies on the assumption that NDWI–LST correlation is negative, which is similar to VHI in supposing a negative correlation between NDVI and LST. The VDI assumption is more stable than VHI’s, as NDWI positively correlates with water content while LST is negative. Moreover, unlike VHI where NDVI responds more slowly to drought than LST, NDWI exhibits a quicker response (Sun et al., 2013).
The VDI was validated through three comparative analyses, comparing it against VHI and the Standardized Precipitation Evapotranspiration Index at 1, 3, and 6 month timescales. The results suggest that VDI has the potential to provide more effective monitoring of agricultural drought across the entire study area compared to VHI. Because, the Vegetation Drought Index (VDI) improves agricultural drought detection using remote sensing by focusing on vegetation stress related to water availability, incorporating region-specific characteristics, and incorporating additional variables like soil moisture, precipitation, and evapotranspiration. Figure 14 presents the temporal variation in VDI and VHI, from 2000 to 2022 over the study region. VDI and VHI both had lower values in 2001/2002, 2004/2005, 2007, 2012, 2016 and 2020 than in other years, confirming the drought event over this area. This can also be confirmed by the variation in LST and TCI, also with higher values than in normal years. The WCI for 2000 to 2022 is predicted in Figure 15, derived from the NDWI map, as shown in Figure 16. The VDI index was used to map drought distribution over the study region from 2000 to June 2022, as depicted in Figure 17. The result indicates that extreme to severe drought has been observed in the region in all years.

Temporal variation in VDI and VHI from 2000 to 2022 over study region.

Drought mapping in study region using WCI from 2000 to 2022.

Drought mapping in study region using NDWI from 2000 to 2022.
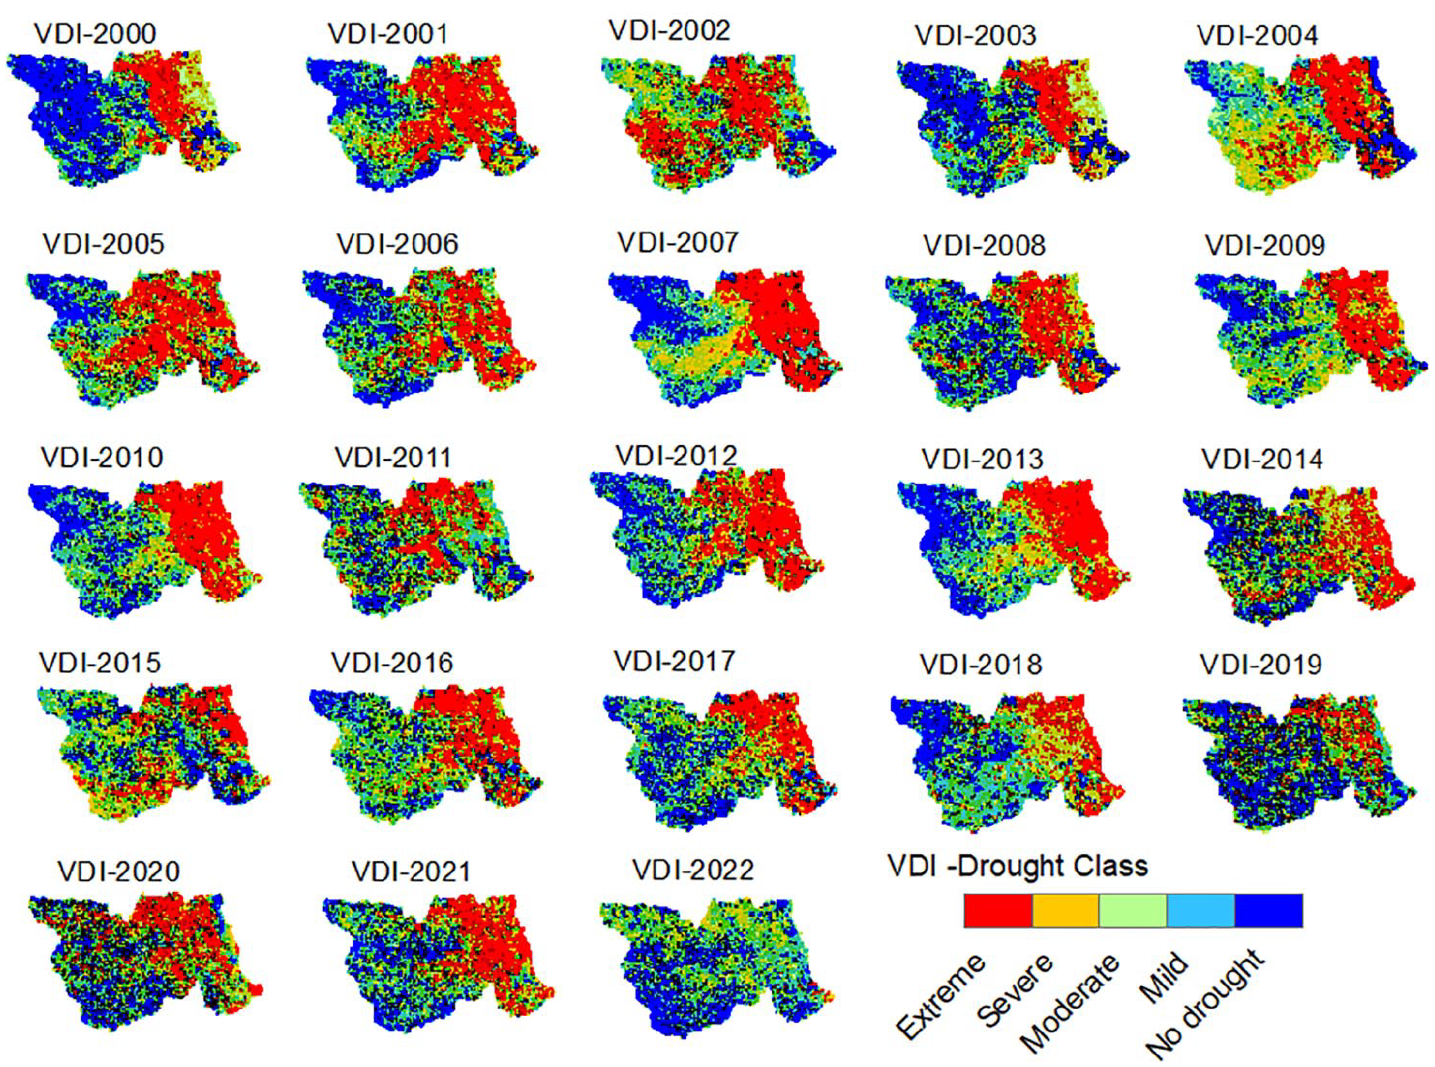
Drought mapping in study region using VDI from 2000 to 2022.
Discussions
The study region’s drought variability is attributed to the high natural climate variability typical of the Eastern African region. Drought frequency is higher on shorter timescales due to shorter water deficiency periods, resulting in high variability in meteorological droughts. Meteorological droughts, with a 1-month timescale, occur most frequently, followed by agricultural droughts with both 3- and 6-month timescales. Although droughts are more frequent at shorter timescales, they become more severe and prolonged at higher timescales (Abara et al., 2020). A cumulative water deficit lasting 3 months or more during the growing season can significantly harm crop yields, leading to agricultural drought. Analysis of drought index data pertaining to the principal crop-growing season indicates the occurrence of vegetation stress within the specified areas, indicating a loss of forest cover and the possibility for an agricultural drought. The gradual onset of drought conditions suggests that prolonged droughts at longer timescales may be a result of cumulative water scarcity, exacerbated by persistent periods of no rainfall. A drought can also occur if seasonal rainfall patterns are disrupted, leading to delayed precipitation and hindering activities that depend on timely rainfall.
The study examined meteorological and agricultural drought patterns between 2000 and 2022 using various indices like VCI, TCI, VHI, VDI, and SPEI. Regression analysis revealed the existence of positive relationships between VHI and rainfall, VHI and SSM, and NDVI and SSM across all study regions. VHI and Soil Moisture (SSM) indices serve as valuable indicators for monitoring the development of both meteorological and agricultural droughts in this study area.
In this study, the majority of drought indices confirmed the severity of the historic drought, ranging from mild to extreme levels. A study conducted by Gebre et al. (2017) revealed that a slight to very severe drought has been observed, with 42% of the North Wollo region experiencing very severe drought conditions. The VHI and NDVI indices reveal that the lowlands of North Wollo, including the western, northern, and central parts, have also been experiencing severe drought conditions. The VHI data shows that a significant region experienced extreme and severe drought conditions in 2006, 2008, 2010, 2011, and 2013/2014, with the highest recorded levels. Similarly, a study by Chere et al. (2022) in North Wollo also highlighted the importance of mapping spatiotemporal patterns of agricultural droughts using VHI for effective drought monitoring, early warning, and decision-making.
The NDVI result reveals the effect of drought on vegetative conditions throughout the study period. The eastern and southern regions of the study area exhibit high NDVI values, indicating healthy vegetation while Low NDVI values indicate stressed or poor vegetation due to insufficient moisture or water availability (Faridatul & Ahmed, 2020). In the study area, July rainfall is essential for crop planting. Insufficient rainfall in July often leads to drought conditions. SPEI-01 shows less drought conditions than SPEI-03 in the study region.
The LST results indicate that the western, southern, and some southeastern and northern regions are generally warmer than the central part. The Northern Wollo Region experienced high temperatures during the main crop growing seasons, potentially causing stress on plant growth. LST is a crucial measure of plant health and drought, indicating the thermal effects of high temperatures and water scarcity on vegetation (Bhuiyan et al., 2017). High LST readings indicate severe drought conditions due to insufficient precipitation, which can adversely affect agricultural crops.
The study indicates that VDI can offer more effective monitoring of agricultural drought across the entire study area compared to VHI. The Vegetation Drought Index (VDI) enhances agricultural drought detection and management by incorporating additional variables, improving spatial and temporal resolution, and enhancing local conditions (Chang et al., 2021). This has been proved by other similar remote sensing based agricultural drought monitoring studies (Li et al., 2022; Omidvar et al., 2024).
The assertion is supported by a sequence of drought events that have affected the area over the past 22 years. The study by Wassie et al. (2022) reveals that severe droughts occurred in North Wollo areas in 2002, 2004, 2009, 2010, and 2015, affecting over 60% of the region. According to Wassie et al. (2022), the Z-score index (ZSI) confirmed that 2002, 2004, 2009, 2011, 2014, 2015, and 2019 experienced rainfall deficits with extreme drought events. A study carried out by Alemu et al. (2024) across South Wollo, North Wollo, and Oromo Zone revealed that all regions have historically experienced severe to extreme droughts, particularly in 1984, 1986, 1987, 1989, 1991, 1992, 2003, 2007, 2010, 2013, and 2014. Therefore, previous studies have identified extreme drought years that align with our findings for the study region. For example, 2002, 2003, 2004, 2009, 2010, 2012, and 2015 were identified as extreme drought years in this study and others.
Limitations of the Study
Data availability and quality, Indices selection, spatial and temporal resolution of the data, and socio-economic factors are some of the limitations of the study. Remote sensing data’s accuracy and resolution can be impacted by factors like cloud cover, atmospheric conditions, and sensor calibration, thereby limiting the analysis’s spatial and temporal coverage. The choice of drought indices (remote sensing-based and SPEI) can impact the results. Different indices may have varying sensitivities to different drought types (meteorological, agricultural, and hydrological) and may not capture the full complexity of drought events. The spatial resolution of remote sensing data may not be sufficient to capture localized drought events, especially in areas with complex topography and heterogeneous land cover. The temporal resolution of remote sensing data and meteorological data may limit the ability to detect short-duration drought events. The study may not fully account for the socioeconomic impacts of drought, such as food insecurity, water scarcity, and displacement. These factors are crucial for understanding the full consequences of drought events.
Conclusions
Characterization of drought detection is essential for managing drought risks. This involves analyzing drought indicators derived from satellite data, rainfall, and other meteorological factors. This study investigated the spatial and temporal patterns of meteorological and agricultural drought in North Wollo, Ethiopia, between 2000 and 2022, employing a range of indices including the Vegetation Condition Index (VCI), Temperature Condition Index (TCI), Vegetation Health Index (VHI), and Standardized Precipitation-Evapotranspiration Index (SPEI). Both satellite and ground-based data, including MOD11A2 Land Surface Temperature Terra, MOD13Q1 NDVI, and monthly rainfall data were used to assess drought conditions. The study utilized multiple linear regression models to examine the correlations between various vegetation indicators, including NDVI, LST, VCI, TCI, VHI, and SPEI, at different timescales. The study offers valuable insights into meteorological and agricultural drought indices, guiding future research on nationwide analysis of seasonal, annual, and monthly variations and their potential impacts on crop yields. The findings of the study are summarized as follows:
The analysis found that the lowland region experienced significantly higher mean Land Surface Temperatures (LST) ranging from 37.11°C to 42.83°C, and lower Normalized Difference Vegetation Index (NDVI) values below 0.33, likely attributed to less favorable moisture conditions compared to the central and highland regions.
The Vegetation Health Index (VHI) and Soil Moisture (SSM) are crucial tools for monitoring the onset of meteorological and agricultural droughts.
The study indicates that VDI can offer more effective monitoring of agricultural drought across the entire study area compared to VHI.
The regression analysis revealed a significant negative correlation between NDVI and LST across all study districts, with a p-value of less than .01.
Strong positive correlations were found between VHI and SSM (R2 = .97, p < .01) and between NDVI and SSM (R2 = .97, p < .01) in all study districts.
Footnotes
Acknowledgements
The authors wish to express our thanks to the National Meteorology Agency of Ethiopia for providing the necessary data free of charge. We express our gratitude to the USGS for providing freely accessible Landsat imagery data through the GEE platform. Additionally, we acknowledge the valuable contributions of the developers of Arc GIS and the R statistical software package, which greatly facilitated our ability to handle large datasets and generate drought indices for this study.