
Abstract
This study seeks to examine the impact of directly releasing the treated wastewater from Al-Gabal Al-Asfar WWTP into Ismailia Canal, Egypt, and evaluate how the discharged water affects the water quality and quantity of Ismailia Canal. The HECRAS 1D model is employed to model water quantity, whereas the QUAL2K model is applied to assess the water quality parameters including dissolved oxygen (DO), pH, biological oxygen demand (BOD), chemical oxygen demand (COD), total phosphorus (TP), nitrate nitrogen (NO3-N), and ammonium (NH4-N). In the winter and summer of 2023, five scenarios were evaluated with a discharge flow varying from 1.15 to 2.50 Mm3/day for the treated water released from Al-Gabal Al-Asfar WWTP, intended for injection into the Ismailia Canal. The optimal scenario was chosen according to the canal water quality post-injection following Article 49 of Law 92/2013, along with the hydraulic capacity of the canal's cross-section. The findings indicated that the fifth scenario (recycling 46% of the treated water, which amounts to 1.15 million cubic meters daily) is the optimal scenario for keeping the concentration of the studied parameters in the Ismailia Canal within the allowable limits and ensuring the canal’s cross-section remains hydraulically secure. Nonetheless, the fourth scenario (reusing 1.50 million cubic meters per day) might be feasible if the efficiency of the plant is enhanced by lowering the ammonium-nitrogen concentration in the effluent. Overall, the suggested solutions can only be implemented if rigorous preventive actions and contingency plans are put into effect on-site. Furthermore, wastewater at Al-Gabal Al-Asfar WWTP must undergo tertiary treatment before its discharge into the Ismailia Canal. The findings of this research may contribute to a decision support system concerning the reuse of treated wastewater in any nation facing water shortages.
Introduction
Around the world, the fresh water from the hydrological cycle has the potential to satisfy the needs of 5 to 10 times the existing global population; nonetheless, the issue lies in the uneven distribution of the resource. Approximately 23% of the global population is expected to face water shortages by 2025 (United Nations Environment Programme [UNEP], 2024). Nations experiencing water stress often utilize unconventional water sources, like recycling treated wastewater, to address the problem of water scarcity (Qadir et al., 2007). Water resource planning and management efforts are typically carried out to address water scarcity concerns, including water quality challenges and distribution problems, as well as to identify alternative water sources. For instance, the South-to-North Water Diversion Project was initiated in China to redirect 44.8 billion cubic meters of water each year from southern rivers to the dry north, aiming to enhance the distribution of water resources (Water Technology, 2009). Northeast Brazil has experienced water shortages for centuries, resulting in heightened poverty and migration (Marengo et al., 2022). Officials resolved to secure water access in the dry region by constructing two primary canals spanning 487 km, along with 23 weirs, 27 new reservoirs, 4 tunnels, 14 aqueducts, and 9 pumping stations to channel water from the San Francisco River to the northeastern area, ensuring water delivery in the arid zones (Parveen & Singh, 2016).
Recycling wastewater is regarded as one of the most vital sources of unconventional water (Kesari et al., 2021). In China’s Yangtze River basin, the rise in Indigenous wastewater flow led to a greater level of de facto reuse; the average de facto reuse increased from 1.1% in 1998 to 2.5% in 2014 (Wang et al., 2017). Downstream in Shanghai, the proportion rose from 8.3% in 1998 to 14% by 2014 (Wang et al., 2017). In the arid and western areas of the United States, the actual levels of reuse are over 15% (for instance, the Rio Grande River; J. Rice, Via, & Westerhoff, 2015). The Trinity River in Texas, USA, utilizes wastewater to enhance streams and restore heavily degraded urban watercourses (Luthy et al., 2015). The fundamental flow of the Trinity River south of Dallas-Fort Worth consists primarily of wastewater (Luthy et al., 2015). After the enactment of the federal Clean Water Act (CWA) in 1972, the building of wastewater treatment plants (WWTPs) and additional infrastructure greatly enhanced the water quality of rivers (Jambaqué et al., 1998). A research on coliform bacteria resistant to seven antibiotics was carried out in the Tama River, Japan. At times, antibiotic resistance rates in wastewater exceed those found in river water.A research on coliform bacteria resistant to seven antibiotics was carried out in the Tama River, Japan. At times, antibiotic resistance rates in wastewater exceed those found in river water (Iwane et al., 2001). Elevated levels of antibiotic resistance in river waters downstream have been noted, primarily linked to the release of treated wastewater into the river (Iwane et al., 2001). The effect of treated wastewater on phosphorus levels was examined in the Bourne and Hossmill Rivers, England. The phosphorus levels downstream of the plant discharge point were more notable than those upstream (Millier et al., 2010). Approximately 147 quantitative investigations of wastewater supply sources were examined, predominantly from the United States and Europe. Over 85% of research concentrated on water quality as their primary emphasis, encompassing fundamental physical and chemical parameters alongside trace organic pollutants. Almost 60% of research concentrated at least in part on water. According to the evaluation, the research suggested that, whenever feasible, wastewater ought to receive tertiary treatment prior to being released into rivers. Additionally, it is essential to monitor the quality of wastewater treatment effluent prior to its release into surface water bodies (Cedergreen, 2014; Hamdhani et al., 2020).
Egypt is encountering an expanding disparity between water availability and need (Nikiel & Eltahir, 2021). The reuse of wastewater seems to be one of the most effective, feasible, and cost-efficient methods to enhance Egypt’s water balance, a goal pursued by the Egyptian government. Egypt has developed the 2030 vision in accordance with the United Nations Sustainable Development Goals (UN SDGs). It has made progress toward achieving the 2030 vision by enacting reforms across multiple sectors. Nonetheless, Egypt encounters numerous obstacles in reaching certain objectives of the 2030 vision. Water scarcity is a challenge arising from swift population increase and elevated water needs, particularly from agriculture, which uses around 80% to 85% of the nation's freshwater resources (Negm, 2019; Nikiel & Eltahir, 2021). Other obstacles include the set proportion of Nile water and the substantial investment and operational expenses associated with implementing desalination technology (Abd Ellah, 2020). Climate change is vital in placing additional pressure on water supplies and accessibility in Egypt (Abd Ellah, 2020). Guaranteeing the sustainable management of water resources is a key concern for Egypt and demands innovative approaches. Ismailia Canal is one of the most essential canals located East of the River Nile Delta (Amer & Mohamed, 2022). Its water is used for irrigation, domestic, and industrial purposes. Irrigation standards for the Ismailia Canal are achieved, and the Water Quality Index (WQI) values for irrigation utilization at all study sites along the canal are very good (Goher et al., 2014). The WQI along the Ismailia Canal varies from good to poor for uses related to drinking water and aquatic life (Goher et al., 2014). While the Cairo Power Plant and the Abu Zaabal Factory contribute to some pollution, the majority of the physicochemical parameters of the Ismailia Canal remain within acceptable limits.
Al-Gabal Al-Asfar is the largest wastewater treatment plant (WWTP) in Africa and the Middle East (Stahl et al., 2009). Al-Gabal Al-Asfar WWTP is one of the few plants in Egypt that successfully applies sludge anaerobic digestion (Stahl et al., 2009). The facility treats approximately 2.5 million cubic meters of raw wastewater, which undergoes various treatment stages: screening, grit removal, primary settling, activated sludge treatment, secondary settling, and chlorination for disinfection. The plant's wastewater is released into the Al-Gabal Al-Asfar drain, which then carries it to the Belbeis drain, and subsequently into the Bahr EI Baqar Drain (Elawwad et al., 2017). This study seeks to examine the impact of releasing the treated wastewater from Al-Gabal Al-Asfar WWTP into the Ismailia Canal, situated close to the facility. To the best of our knowledge, this is the first study to address the impacts of discharging treated effluent from WWTP into a canal used for drinking and irrigation purposes. The existing conditions of the Ismailia Canal, such as water quality, discharge, cross sections, etc., were studied to achieve the research objectives. The existing conditions of Al-Gabal Al-Asfar WWTP, such as capacity, effluent water quality, etc., were also studied. This study also examined the evaluation of water quality at the intake points of drinking water treatment plants supplied by Ismailia Canal. Mathematical models can be considered one of the most effective and practical assessment tools to assess the quality of water courses. Two mathematical models (water quality and hydraulic) were developed to simulate the Ismailia Canal for water quality and quantity. The two models were calibrated and verified. The water quality model was designed to evaluate the water quality of Ismailia Canal after receiving the treated effluent and comparing the results with the allowable limits of Article 49 of Egyptian Law 92/2013. The hydraulic model was used to simulate the hydraulic performance of the Ismailia Canal at different flow rates to avoid flooding conditions and to ensure that the cross sections of the canal would endure the additional water. Five proposed scenarios with different effluent flow rates were studied to ensure the optimum use of the treated effluent.
Literature Review
Water is a vital resource facing threats from climate change, drought, population growth, and waste. A key solution to the global water crisis is the reclamation and reuse of water in industrial and municipal settings. The Water Reuse Association defines reused water as “water that is utilized more than once before it reenters the natural water cycle.” Water recycling involves using treated wastewater for purposes like irrigation, industrial applications, toilet flushing, and groundwater recharge. By adopting water reuse strategies, communities can reduce reliance on groundwater and surface water, protecting vulnerable ecosystems and lowering nutrient pollution from wastewater discharges (American Public Health Association [APHA], 1999).
Frieberg et al. (2023) evaluated chemical hazards during a chlorination disinfection trial of treated wastewater before its discharge into the Llobregat River in Barcelona, Spain. They analyzed bioactive pollutants from incoming wastewater to final drinking water at seven locations. Nrf2 activity, estrogen receptor activation, and AhR activation were detected in all samples. The removal efficiencies were high for most endpoints in both wastewater and drinking water treatments. The researchers concluded that indirect reuse of treated wastewater for drinking water production is feasible without compromising quality, supporting its increased use as a viable drinking water source.
Ghernaout and Elboughdiri (2019) assess ways to enhance wastewater treatment facilities for potable water production. They emphasize that wastewater should be processed to the highest purity standards to prevent pollution spread, allowing treated water to be used for irrigation and industrial purposes. Urgent upgrades to current treatment plants are necessary, incorporating methods like nanofiltration, reverse osmosis, and activated carbon adsorption. Although these techniques involve additional costs, they are vital for a sustainable future. The authors advocate for continuous improvement in wastewater treatment methods, suggesting that direct consumption of treated wastewater should only be a last resort in critical shortages for safety reasons.
Jodar-Abellan et al. (2019) studied the relationship between wastewater treatment and reuse since wastewater reuse is linked to problems derived from droughts and water scarcity and both are important tools to maximize environmental outcomes as required by the EU directive. The potential of water reuse in this new paradigm is an undeniable fact, especially in countries such as Spain that have water scarcity problems. Its integration as an unconventional strategic resource is therefore a challenge that requires all the actors responsible for this issue to act in a coordinated and rigorous way when planning future actions. In this sense, it is important that regional administrations encourage or even make mandatory the use of treated wastewater whenever possible, especially in areas affected by a persistent deficit. In particular, Royal Decree 1620/2007 established the legal regime for water reuse in Spain.
Ungureanu et al. (2020) examine the situation of water scarcity and challenges to food security, agricultural wastewater reuse, and potential risks to human and environmental health. The efficiency of different irrigation systems in limiting the risks of wastewater reuse and the latest European Commission regulation on wastewater recycling are also presented. Thus, it is emphasized that irrigation offers real prospects for large-scale wastewater recycling, contributing to reducing the deficit protecting water resources, and improving food security. It specifically mentions the need to invest in wastewater treatment plants and properly treat wastewater before recycling to limit risks to human health and the environment.
Tran et al. (2016) used a general algebraic modeling system to develop a regional water reuse decision support model (RWRM) to analyze the cost-effectiveness of alternative treatment processes for producing irrigation water from reclaimed wastewater designed to meet crop yield requirements and California’s wastewater reuse regulations. Using a cost-minimization framework, the most cost-effective solution consisting of treatment processes and their intensities (mixing ratios) was identified to produce an alternative irrigation source for citrus and turfgrass. Our analysis illustrates the benefits of using an optimization framework and flexible treatment designs to identify cost-effective mixing options that produce high-quality irrigation water for a variety of end uses.
Kretschmer et al. (2000) review a literature review aiming to address key issues related to wastewater reuse with a focus on agricultural reuse through some recent examples. Therefore, an integrated planning approach is needed if wastewater reuse is to be a management alternative in water-scarce catchments. Technical, economic, and health aspects as well as the legal framework must be considered. Water reuse is therefore a current and future interdisciplinary challenge. Agricultural wastewater reuse, as well as demand-based water allocation and desalination, has proven to be an important management issue for the sustainable use of limited freshwater resources.
Once fresh water has been used for economic or useful purposes, it is usually disposed of as waste. In many countries, this wastewater is discharged into natural waterways either as untreated waste or as treated effluent, which is removed for further use after it has “self-cleaned” itself in the river. This indirect reuse system can allow wastewater to be reused a dozen or more times before being discharged into the sea. This indirect reuse is common in the larger river systems of Latin America. However, more direct reuse is also possible: technologies to recycle wastewater as drinking water or process water are technically feasible options for agriculture and certain industrial uses (e.g., as cooling water or sanitary flushing water), and are largely experimental utility options for domestic water use.
Materials and Methods
Study Area
Ismailia Canal is one of Egypt’s most crucial irrigation and drinking water sources (Imam et al., 2024), refer to Figure 1. Ismailia Canal was constructed between 1858 and 1863 to provide drinking water to villages in the Suez Canal area and the workers who dug the Suez Canal’s route (Geriesh et al., 2008). Ismailia Canal extends eastward for about 128.4 km from the Nile at Shubra, north of Cairo, to Ismailia city on the Suez Canal, see Figure 1. Its bottom width varies from 70 to 45 m, and the water depth, on average, ranges between 5.5 and 6.0 m (Geriesh et al., 2008). Today, its water discharge reaches about 5,000,000 m3/day and is used for drinking, irrigation, and industrial purposes. Ismailia Canal is the primary source of drinking water supply for many Egyptian citizens (approximately 12 million inhabitants), including those living in Shubra El Kheima north of Greater Cairo, El Amira, Mattaria, Musturod, Abu-Zaabal, Inchas, Belbeis, Abbasa, Abu-Hammad, Zagazig, and El-Tal El-Kabeer before entering Suez Canal area (Goher et al., 2014). There are 28 water treatment plants (WTPs) that withdraw water from the Ismailia Canal with a total withdrawal capacity of 58 m3/s. There are also 13 sub-canals distributed from the Ismailia Canal with a total withdrawal capacity of 84.7 m3/s.

Layout of the study area.
On the other hand, Al-Gabal Al-Asfar WWTP is located at El-Khanka of the Qalyubia government, as shown in Figure 1. It is considered one of the largest sewage treatment plants in the Middle East. It serves a significant number of Egyptian citizens (about 12 million inhabitants), with a design capacity of 2.5 million cubic meters/day.
Collected Data
Water quality samples were collected from several points along the canal to ensure a precise simulation of the Ismailia Canal, as shown in Figure 2. The samples were collected from seven locations in january winter and august summer 2023; refer to Supplemental Tables S1 and S2. The sample locations were chosen according to potable water treatment plants’ locations along the canal, and that the samples shall cover the whole length of the canal. Water samples were taken at 60 cm depth from the different sites using Van Dorn plastic bottles (1.5 L capacity) (American Public Health Association [APHA], 1999).

Location of sample collection points.
After collecting the samples, they were preserved in an ice box and sent immediately to the laboratory. The samples were analyzed for selective water quality parameters based on their significance for hygiene. The studied parameters are biological oxygen demand (BOD), chemical oxygen demand (COD), inorganic phosphorus (InP), total phosphorus (TP), nitrate nitrogen (NO3-N), and ammonium (NH4-N). In addition, total dissolved solids (TDS), dissolved oxygen (DO), pH, and, temperature were measured in the field using a multimeter. The water samples were analyzed at the laboratory based on water and wastewater standard methods of Examination and analysis (E. Rice, Baird, & Eaton, 2017).
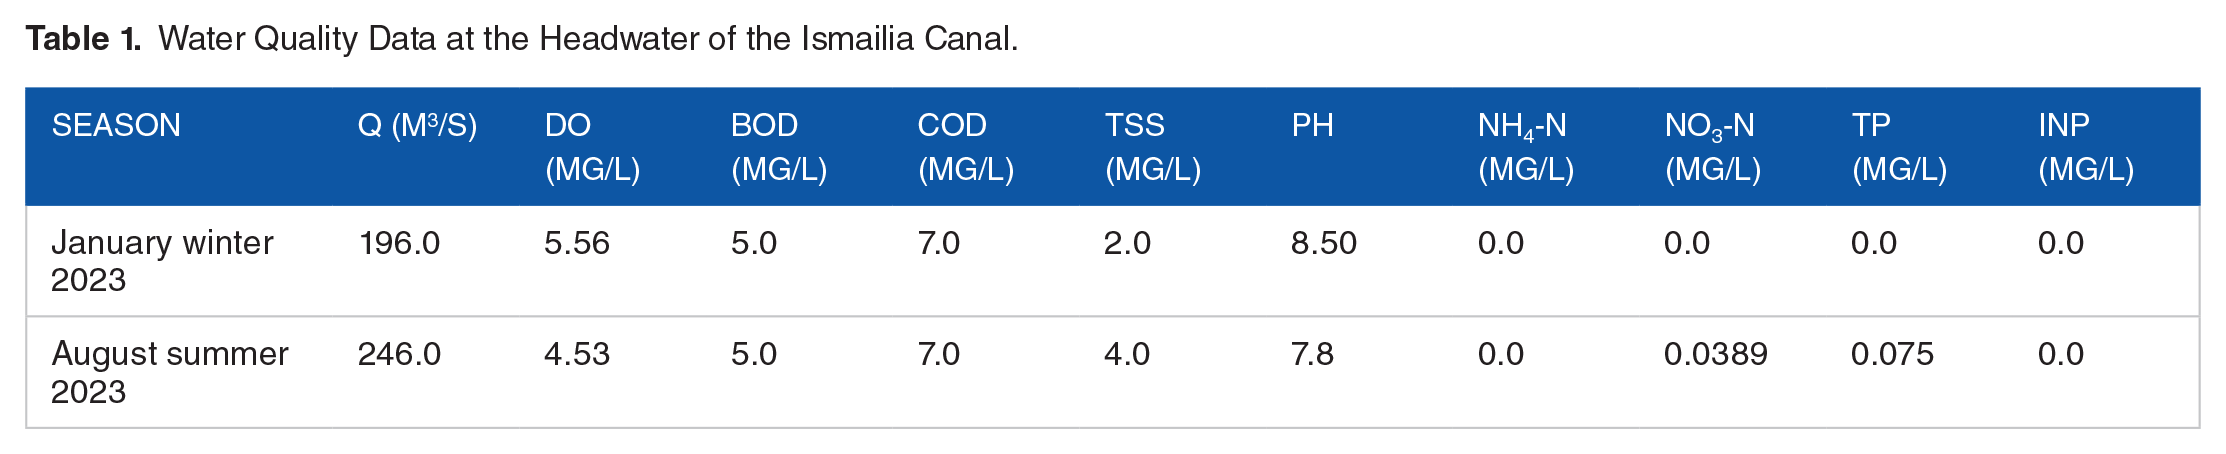
The data collected to simulate the hydraulic characteristics of the Ismailia Canal include detailed data on flow and cross-sectional areas at different locations across the canal, as shown in Supplemental Table S3. On the other hand, to simulate the water quality of the canal, samples were taken at the beginning of the canal (0 km) in summer and winter, refer to Table 1. Samples were also collected from Al-Gabal Al-Asfar WWTP, refer to Table 2. Based on samples collected from Al-Gabal Al-Asfar WWTP and the report received from the plant operators, the efficiency of the WWTP did not significantly change over a period of study. In this study, we chose the highest concentration reported for the targeted parameters during the study period to act as a worst case scenario, as shown Table 2.
Water Quality Data at the Headwater of the Ismailia Canal.
Effluent Water Quality at Al Gabal Al-Asfar WWTP.

Mathematical Models
Two mathematical models were used to achieve the research objective. The first is the QUAL2K model, a modern version of QUAL2E developed by Brown and Barnwell in 1987 (Fang et al., 2008), using Microsoft Excel as the graphical user interface. QUAL2K is capable of simulating a main channel with multiple tributaries. It divides the reach into sections and elements, the basic unit of account. QUAL2K is a time-varying, constant-coefficient, steady-state flow model in any river region, simulating various components such as temperature, carbon BOD, DO, phytoplankton, phosphorus, and nitrogen. It also simulates pH, alkalinity, inorganic suspended matter, pathogenic bacteria, and riverbed algae (Fang et al., 2008). QUAL2K represents a process as a series of parts. These are river segments with constant hydraulic properties such as slope, bed width, and so on. As shown in Figure 3, the reaches are numbered in ascending order from the upper mainstream of the main river. Note that both point and non-point sources and point and non-point extracts can be located anywhere along the length of the channel (Pelletier et al., 2006).
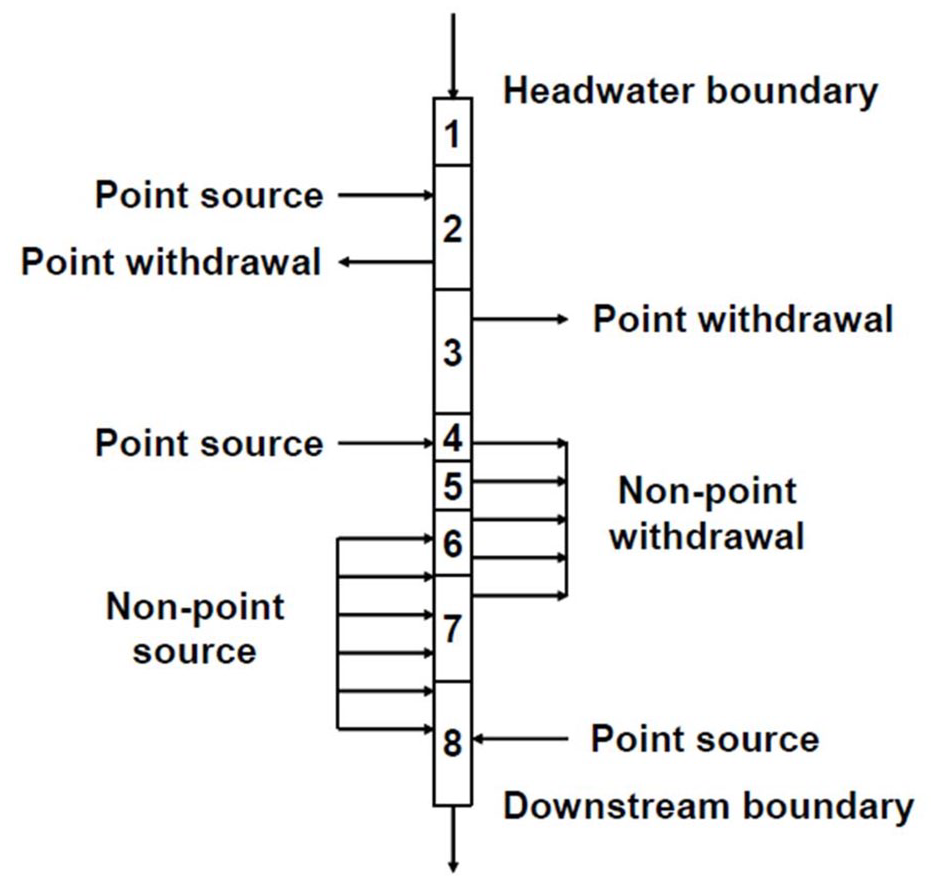
QUAL2K segmentation scheme for a river with no tributaries.
The second model is the River Analysis System (HEC-RAS) model, which was used to simulate the water quantity of the canal and calculate hydraulic characteristics. HEC-RAS is commercial software that simulates the hydraulics of rivers, water flow, and other channels from a single reach to complex networks. HEC-RAS software was developed by the Corps’ Civil Works Hydrologic Engineering Research and Development Program of the U.S. Division of Institute of Water Recourses. The first version was released in 1995, and many versions have been released since then (US Army Corps of Engineers, 2016). The main objective of HEC-RAS is to calculate the water surface elevations for all the required locations for steady or unsteady state simulations. The primary geometric data for the river analyses are the cross-section information, reach length, energy loss coefficients that include friction, contraction, and expansion losses, and stream junction data. If the widths or depths vary significantly between the cross sections, the interpolation can be used through the HEC-RAS geometric option. The QUAL2K model divides the river into several “reaches” and each reach is divided into “segments.” These segments are model’s shortest parts of simulation. A steady state flow balance is implemented for each model segment based on equation 1.

where
The outflow for each segment is calculated, the velocity and depth are calculated in one of three ways: rating curves, weirs, and Manning equations. Each segment is idealized as a trapezoidal channel. Under the conditions of steady flow, Manning equation was used to express the relationship between depth and flow, as shown in equation 2.

where Q = flow (m³//d), n = the Manning roughness coefficient, S = bottom slope (m/m), Ac = cross-sectional area (m²) and P = the wetted perimeter (m).
QUAL2K solves this governing equation in a steady-state condition for a water quality parameter concentration Ci in the water column of segment i. This gives in a general mass balance equation that can be expressed as:
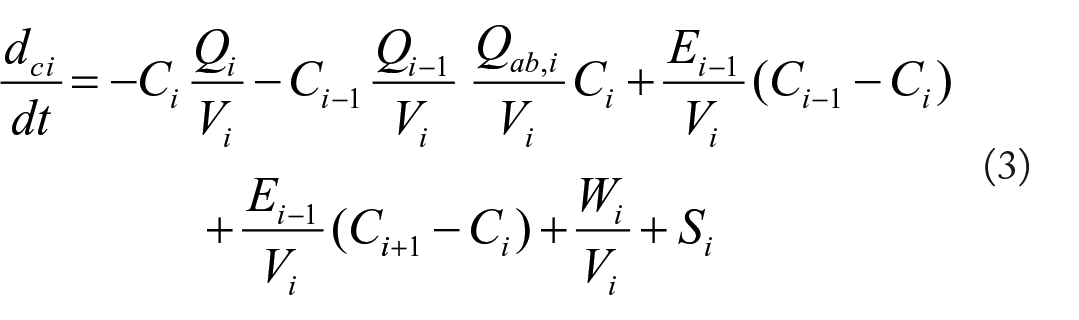
where Ci = variable concentration for segment i, (g/m³), Vi = volume of the segment i (m³), Wi = external loading of the constituent to segment i (g/d or mg/d), t = time (d), Qi = outflow from segment i into segment i + 1, (m³/d) and E = bulk dispersion coefficient between segments i and i + 1 (m³/d), Si = sources and sinks of the constituent due to reactions and mass transfer mechanisms (g/m³/d or mg/m³/d).
Models Application
QUAL2K model was set up to simulate the Ismailia Canal, dividing it into 6 reaches and 130 segments, as shown in Supplemental Figure S1. The Manning roughness coefficient of the natural canal is 0.03 with an equivalent time step of 0.01 hours. On the other hand, the HEC-RAS model 1D was applied to the Ismailia Canal using a calibrated manning coefficient. The used manning coefficient is equal to 0.03. Geometric data of the canal is shown in Supplemental Table S3. The flow data is analyzed from the collected data upstream and decreases in the downstream direction. The developed model was used to simulate the water quality and quantity in the Ismailia Canal for five scenarios following the methodology presented in Figure 4.

Schematic diagram of methodology.
Models Calibration and Validation
QUAL2K model solves the governing equation using the Manning formula and is a one-dimensional steady-state and thoroughly mixed system. It was calibrated with low flow data (January winter 2023), and the calibration was accomplished by adjusting the model parameters during successive model runs. The model was run until the coefficients were appropriately adjusted and the reasonable agreement between the model results and observed measurements was achieved. The values of coefficients are based on the typical values cited in the model documentation, user manual, and Environment Protection Agency (EPA) guidance document (Pelletier et al., 2006). Table 3 shows the model Q2K parameters used in this study. The model was generally calibrated to minimize the error between predicted and observed values.
Model Parameters Considered as Inputs in the QUAL2K Model.

To validate the model and ensure that the model can predict real situations dependably, the calibrated model runs using an extra data set, preferably under various environmental conditions (river flow, water quality parameters concentration, etc.). The model parameters used were the same as in the calibrated model, and only different input additional sets of measured data in high flow data (August summer 2023) were used to validate the model.
The calibration of the HEC-RAS Model was achieved using historical data in 2013 for water depth and discharge at three sections with different values of Manning roughness coefficient until the difference between simulated and observed water depth reaches the allowable criteria ranges. Manning’s roughness coefficient is the only parameter used for model calibration and validation in this analysis. The roughness coefficient is a sensitive parameter reflecting the flow resistance at the bottom of the channel. Channel Manning’s roughness coefficient ranges from 0.016 to 0.033; refer to Supplemental Table S4. So, the model was run between these ranges. To validate the model and ensure that Manning’s roughness coefficient was specified correctly, the model was run using historical data in 2014 for water depth and discharge at the same three sections of the canal, as shown in Table 4. The model performance was measured using the mean absolute percentage error in two models.
Flow and Water Depth Historical Data Were Used to Calibrate and Validate the HEC-RAS Model.

Proposed Scenarios
Five proposed scenarios with different effluent flow rates were studied to check the impacts of discharging the treated effluent from Al-Gabal Al-Asfer WWTP into the Ismailia Canal, refer to Table 5. The injecting point was selected at 13.5 km from the beginning of the Canal between Seriakos water treatment plant intake and Kafr Hamza water treatment plant intake. It is the shortest path between Al-Gabal Al-Asfer WWTP and the Ismailia Canal. The two models (water quality and hydraulic) were simulated for the above five scenarios. The main factors in choosing the best scenario were the limits of Article 49 of Law 92/2013 regarding the water quality and the sufficiency of the canal cross-section to endure the discharged amount of the treated wastewater from the WWTP.
Description of the Five Proposed Scenarios.

Result and Discussion
QUAL2K Model Calibration and Validation
The results of DO, COD, BOD, and pH predicted by the model for calibration and validation are shown in Supplemental Figures S2 and S3. The performance of the model was measured using statistical criteria such as mean absolute error (MAE), root mean square (RMS), and relative error (RE; Kannel et al., 2007). The error between the predicted and observed values for DO, COD, BOD, and PH computed for both calibration and validation are given in Table 6. The results of RE showed a good fit between observed and predicted values of DO and BOD. Similarly, the values of MAE and RMS also indicate that there is not much variation in these values between calibration and validation. The acceptable error values show that the QUAL2K model can be used as an effective tool to predict the river water quality and can be used to support water quality management and decision-making, especially for developing countries where the higher accuracy data analysis and financial resources for frequent monitoring campaigns are minimal (Raeisi et al., 2022). From the output model in January winter 2023, Supplemental Figure S2 shows that DO in the Ismailia Canal disagrees with Egyptian Law 92/2013 limits. BOD concentrations under 5 mg/L and COD under 7 mg/L indicate decreased organic matter pollution in the canal. From Supplemental Figure S3, in August summer 2023, DO decreased compared with DO in winter, resulting in reduced re-aeration. However, the water quality improved in summer due to increased canal flow.
DO, COD, BOD, and PH Error Values for Model Calibration and Validation.

HEC-RAS Model Calibration and Validation
Manning roughness-coefficient is the only parameter used for model calibration and validation in the present analysis. The roughness coefficient is a sensitive parameter used to reflect the resistance to flow at the canal bottom. The accuracy of model calibration and validation depends on the reliability of input data. Calibration and validation of the model should be conducted to determine the roughness coefficient. The results of the model calibration and validation are shown in Figure 5. Model performance is necessary to check the suitability of the model. The model suitability was evaluated based on the difference between water simulated depth and observed water depth by performing different statistical analyses such as Nash-Sutcliffe efficiency (NSE) and root mean squared error (RMSE). The error between the predicted and observed values for water depth computed for both calibration and validation are given in Table 7. Figure 5 presents results for the Ismailia Canal with the Manning value set at 0.03 for different canal stations. The modeled values fit well with the measured values, evident from the low percentage of errors recorded.
Error Values of Water Level for Model Calibration and Validation.


(a) Model calibration for water level and (b) model validation for water level.
Analysis Scenarios for Water Quality Control
Dissolved Oxygen
Dissolved oxygen (DO) is the dissolved gaseous form of oxygen. It is requisite for the respiration of fish and other aquatic organisms. DO enters water by diffusion from the atmosphere and as a by-product of photosynthesis by algae and plants (Chapra, 2006). The DO concentration in the Ismailia Canal ranges from 5.48 to 7.1 mg/L (El Sayed et al., 2023). The dissolved oxygen concentration in January winter 2023 was less than 6 mg/L (refer to Figure 6a), which is lower than the limits specified in the Egyptian Law 92/2013. The simulation of water quality at the Ismaila Canal after the injection of treated water into the Ismailia Canal showed a minor decrease in DO concentration at the injection point, where the DO concentration in the treated water is 4.38 mg/L, which is less than the DO concentration in the Ismailia Canal. At points 2 and 3, the DO concentration started to increase due to the widening of the channel width and increased re-aeration, as shown in Figure 6.

Predicated values of dissolved oxygen demand under different studied scenarios: (a) in January winter 2023 and (b) in August summer 2023.
In the August summer of 2023, the dissolved oxygen concentration in the Ismailia Canal decreased to 4.53 mg/L, as shown in Figure 6b. The simulated DO concentration agreed with the measured DO concentration by a ratio of 89% (Portielje & Lijklema, 1995). The DO concentration in the summer along the canal was lower than the DO concentration in the winter due to decreased re-aeration, increased temperature, and decreased wind velocity (Portielje & Lijklema, 1995). The DO may also lost via fast CBOD oxidation, plant respiration, and nitrification. The observed increase in DO concentrations in some areas may be attributed to plant photosynthesis. As shown in Figure 6b. Figure 7. indicates that scenario 5 (discharging 1.15 million m3 per day) is the best since it is the closest to the allowable limits. It is recommended that DO concentration along the canal be increased by applying wave action (weir) (Chen et al., 2013), using paddle wheel aerators, or using nanobubbles technology to maintain a high DO concentration for an extended duration (Tekile et al., 2016).

Predicated values of re-aeration under different studied scenarios: (a) in January winter 2023 and (b) in August summer 2023.
Biological Oxygen Demand
The biological oxygen demand (BOD) is a metric for determining the amount of organic matter in water bodies. The BOD concentration in the Ismailia Canal ranged from 3.75 to 9.75 mg/L, indicating eutrophication of the water body (Chapra, 2006). The BOD concentration was about 5.0 mg/L for the actual case in January winter 2023, while the BOD concentration in the treated water was 9.0 mg/L. In January Winter 2023, the injection of treated water into the Ismailia Canal increased BOD to about 5.7 mg/L (refer to Figure 8a), which is still within the limit specified in Law 92/2013 (6.0 mg/L). The highest BOD concentrations were recorded from 75 to 104 km, mainly due to increased total suspended solids (TSS) concentration in this reach, refer to Supplemental Table S1. The BOD concentration generally did not exceed the allowable limits for all studied scenarios, as shown in Figure 8a. In August summer 2023, the highest BOD concentration along the canal did not exceed 5.5 mg/L (refer to Figure 8b), which is lower than the winter semester. This may be attributed to the significant increase in the Ismaila Canal flow rate in summer, reaching 246 m3/s. Figure 8 also shows that the water treatment plants located along the canal will not affected by the injection of the treated water into the canal since the BOD did not exceed the allowable limits.

Predicated values of BOD under the five studied scenarios: (a) in January winter 2023 and (b) in August summer 2023.
Chemical Oxygen Demand
Chemical Oxygen Demand (COD) describes the total amount of oxygen needed to oxidize organic material chemically, both biodegradable and non-biodegradable to CO2 and H2O. The COD concentration was less than 7.0 mg/L for the actual case in January winter 2023, while the COD concentration in the treated water was 37.0 mg/L. In January winter 2023, treated water injected into the Ismailia Canal increased COD concentration at the injection point to 11.2, 10.3, 10.05, 9.6, and 9.0 mg/L for the first, second, third, fourth, and fifth scenarios, as shown in Figure 9a. The allowable limit for COD in the canal is 10 mg/L, so the first three scenarios are not recommended for application. The simulation result also indicated that scenarios 4 and 5 are acceptable for the standard value of Law 92/2013. Then, the COD concentration decreased downstream of the injection point due to dilution resulting from mixing with the freshwater of the canal. In the August summer of 2023, the COD concentration along the canal did not exceed the allowable limit, except for the first scenario, reaching 10.3 mg/L (Figure 9b). The low COD concentration in the summer compared to the winter is mainly attributed to the significant increase in the Ismaila Canal flow rate in summer. Based on the COD results, it is recommended to apply either scenario 4 or 5 to ensure that the COD concentration at the intake of all water plants located along the canal is acceptable.

Predicated values of COD under the five studied scenarios: (a) in January winter 2023 and (b) in August summer 2023.
Ammonia Nitrogen (NH3-N)
In its natural state, ammonia is a colorless, toxic gas with a pungent odor. Ammonia nitrogen increases due to dissolved organic nitrogen hydrolysis and plant respiration. It is lost via plant photosynthesis and nitrification (Chapra, 2006). The concentration of NH3-N in the treated water discharged from Al-Gabal Al-Asfar WWTP is 22.6 mg/L. In the August summer and January winter of 2023, an increase in NH3-N was reported at the injection point, as shown in Figure 10. Then, it gradually decreases by self-purification for the canal. The NH3-N concentration did not exceed the allowable limit of 0.5 mg/L at any point along the canal for summer and winter, even at the injection point. Lower NH3-N concentrations were observed in the summer compared to winter due to increased discharge and photosynthesis. Based on the NH3-N results, applying any of the five scenarios will not significantly affect the water quality at the Ismailia Canal or the operation of the water treatment plants along the canal.

Predicated values of Ammonia-nitrogen under the five studied scenarios: (a) in January winter 2023 and (b) in August summer 2023.
Nitrate Nitrogen (NO3-N)
Nitrate nitrogen increases due to nitrification of ammonia. It is lost via denitrification and plant photosynthesis (Chapra, 2006). Nitrogen compounds discharged into the environment can cause serious problems such as the eutrophication of rivers, deterioration of water sources, and hazards to human health. Biological denitrification is a reliable method for removing nitrogen from wastewater. Denitrification is an anoxic process in which the nitrate is reduced to nitrite and subsequently to nitrogen gas utilizing the action of heterotrophic denitrifying bacteria (Fernández-Nava et al., 2010). The NO3-N concentration was 0 mg/L for the actual case in January winter 2023, while the NO3-N concentration in the treated water was 2.90 mg/L. As shown in Figure 11a, the NO3-N concentration has exceeded the allowable limits (2.0 mg/L) for all scenarios except the fifth scenario. The NO3-N concentration was then decreased downstream of the injection point due to the self-purification of the canal. In the August summer of 2023, the NO3-N concentration along the canal did not exceed the allowable limits for the fourth and fifth scenarios, as shown in Figure 11b. The increase of flow rate in the Ismailia canal in summer significantly decreases the NO3-N concentration in the canal compared to the winter. Based on the NO3-N results, it is recommended that the fifth scenario be applied to ensure that the NO3-N concentration at the intake of all water plants located along the canal is acceptable.
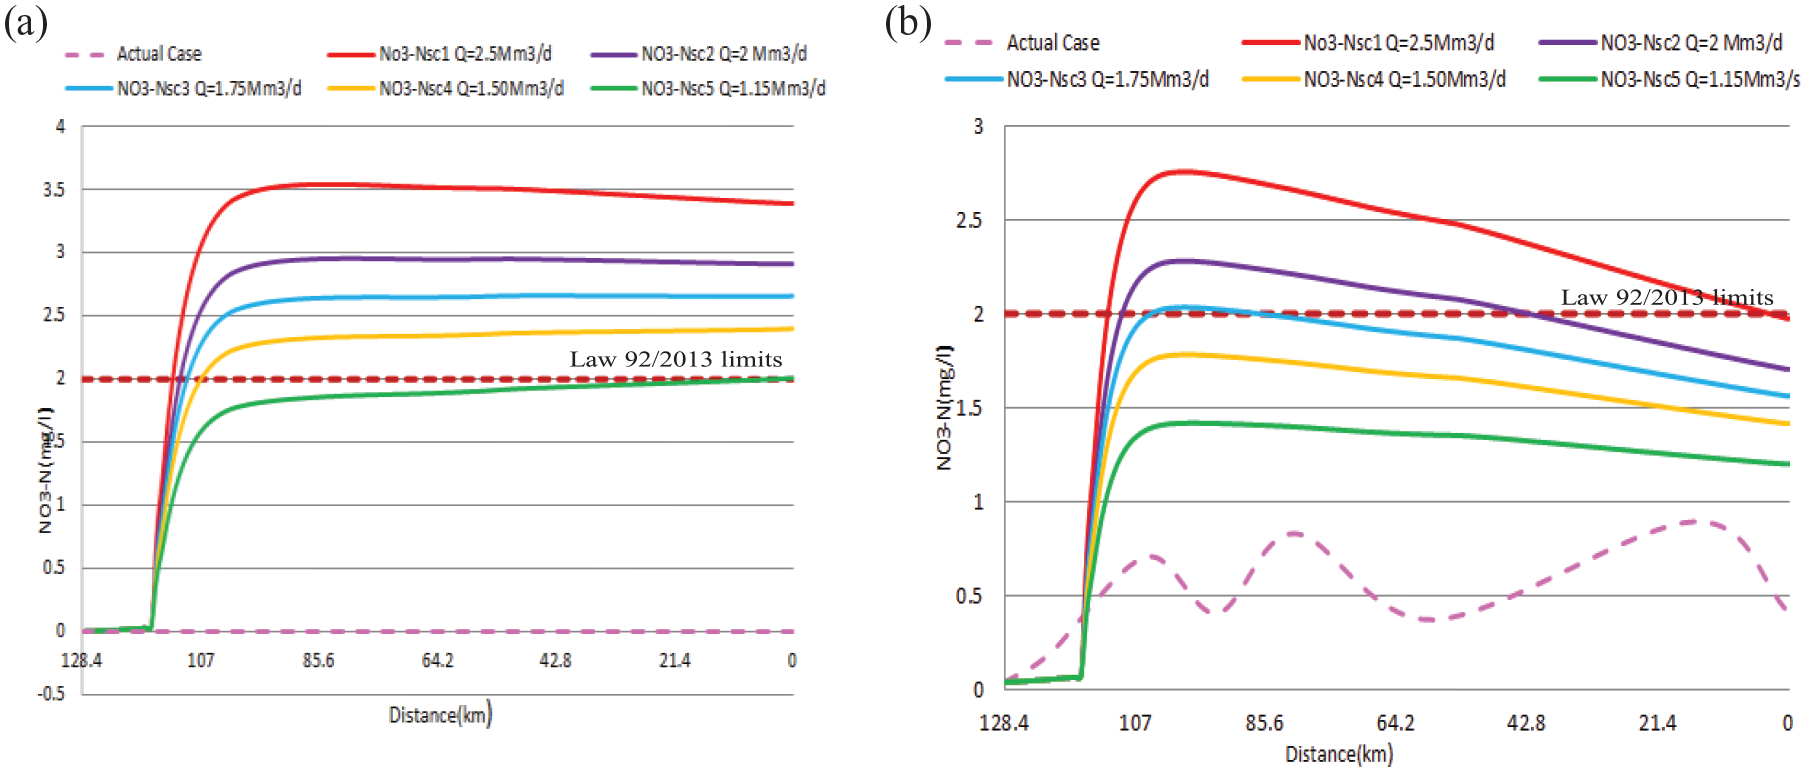
Predicated values of nitrate-nitrogen under the five studied scenarios: (a) in January winter 2023 and (b) in August summer 2023.
Total Phosphorus (TP)
Inorganic phosphorus increases due to dissolved organic phosphorus hydrolysis and plant Respiration (Chapra, 2006). An oversupply of phosphorus in water bodies may result in eutrophication and water enrichment by nutrients, causing accelerated algae growth and higher forms of plant life, which generate undesirable changes in taxa abundance and species and degrade water quality (Millier et al., 2010). TP concentration at the effluent of Al-Gabal Al-Asfar WWTP is 1.0 mg/L. In the August summer and January winter of 2023, an increase in TP was reported at the injection point, reaching a maximum of 0.18 mg/L in the summer when applying the first scenario. However, the TP concentration was much lower than the allowable limit of Article 49 of Law 92/2013 (2.0 mg/L), as shown in Figure 12. Then, the TP concentration remains constant downstream of the injection point. A high TP concentration in the summer along the canal compared to the winter is mainly due to increased TP concentration upstream of the injection point from 0 mg/L in winter to 0.075 mg/L in summer. Based on the TP results, applying any of the five scenarios will not significantly affect the water quality at the Ismailia Canal or the operation of the water treatment plants withdrawing water from the canal.

Predicated total phosphorus values under the five studied scenarios: (a) in January winter 2023 and (b) in August summer 2023.
PH
The ideal pH level allows the water’s biological life to grow correctly, and neutral acidity (pH 7) is considered a perfect condition for sewage water (Bagchi, 2013). Most aquatic organisms are sensitive to pH changes and prefer pH values from 7 to 8.5 (Dallas & Jha, 2015). The average pH of treated water of Al-Gabal Al-Asfar WWTP is 7.3. In the August summer and January winter of 2023, a pH decrease was reported at the injection point, then it gradually decreased downstream the injection point, as shown in Figure 13. However, the pH value remains within the allowable limit stated in Article 49 of Law 92/2013 at all points along the canal for summer and winter, even at the injection point. A low pH value in the summer along the canal compared to the winter is mainly due to a decreased pH value upstream of the injection point from 8.5 in the winter to 7.77 in the summer. Based on the pH results, applying any of the five scenarios will not significantly affect the water quality at the Ismailia Canal or the operation of the water treatment plants along the canal.

Predicated pH values under the five studied scenarios: (a) in January winter 2023 and (b) in August summer 2023.
Heavy Metals
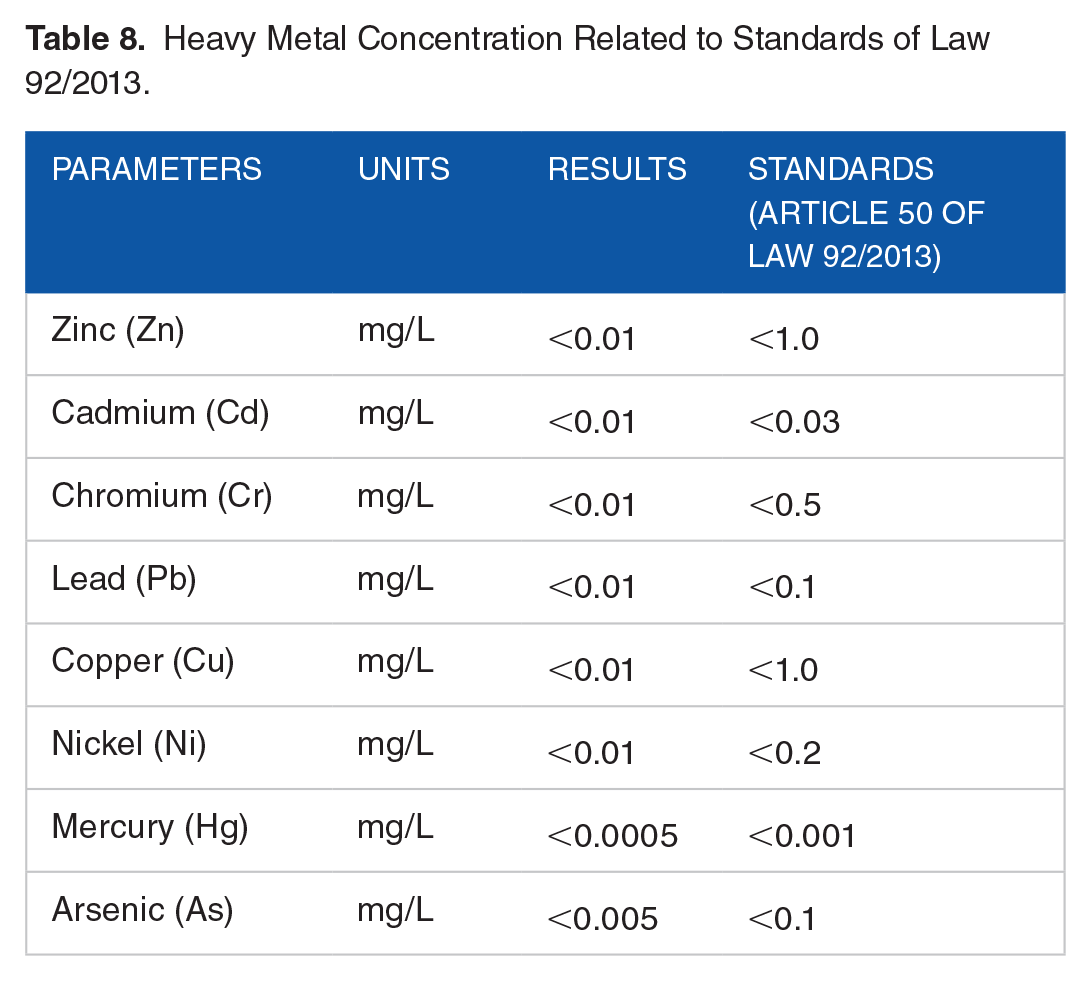
Heavy metals are a parameter of concern when discharging treated wastewater into freshwater bodies. Heavy metals did not contaminate Ismailia Canal sediments, and the concentration of heavy metals such as cadmium (Cd), lead (Pb), copper (Cu), nickel (Ni), and zinc (Zn) in the Ismailia Canal did not exceed the allowable limits stated by the World Health Organization (WHO) (Abu-Zaid et al., 2020). Article 50 of Law 92/2013 in Egypt governs the discharge of treated water into freshwater bodies. As shown in Table 8, the concentration of heavy metals in the treated water discharged from Al-Gabal Al-Asfar WWTP did not exceed the allowable limits. These findings confirm the possibility of discharging the treated effluent from Al-Gabal Al-Asfar WWTP into freshwater bodies.
Heavy Metal Concentration Related to Standards of Law 92/2013.
Hydraulic Model Analysis
The HEC-RAS model is entirely dependent on the input data set. To perform the 1-D steady-state hydrodynamic modeling, the following data are required: canal geometry (detailed cross-section of canal, length, bottom width, top width, depth, side slope), slope of the canal or channel bed, and Manning’s roughness coefficient. To determine the model’s sensitivity to changes in Manning’s roughness coefficient, a range of n-values in a single calibration reach were simulated separately. The HEC-RAS model was executed repeatedly while these parameter estimates were varied, and the difference between the observed water levels and simulated water levels at canal stations was plotted. Plots of simulated versus measured water levels in each calibration and validation reach are shown in Figure 5 above. The Figures show those adjustments of Manning’s roughness coefficient values to 0.03. A 1D model was developed to simulate the recommended scenario number 5, so the amount of water added to the Ismailia canal is 1.15 million m3/day. The current cross-sections along the canal can accommodate the additional flow of 1.15 million m3/day, and the rise in the water level downstream of the injection point does not cause flooding at any point along the canal, as shown in Figure 14.

Seven cross-sections along the Ismailia Canal after simulating water depth for the fifth scenario (Q = 1.15 Mm3/day) using HEC-RAS.
Alternative Scenario to Maximize Benefits
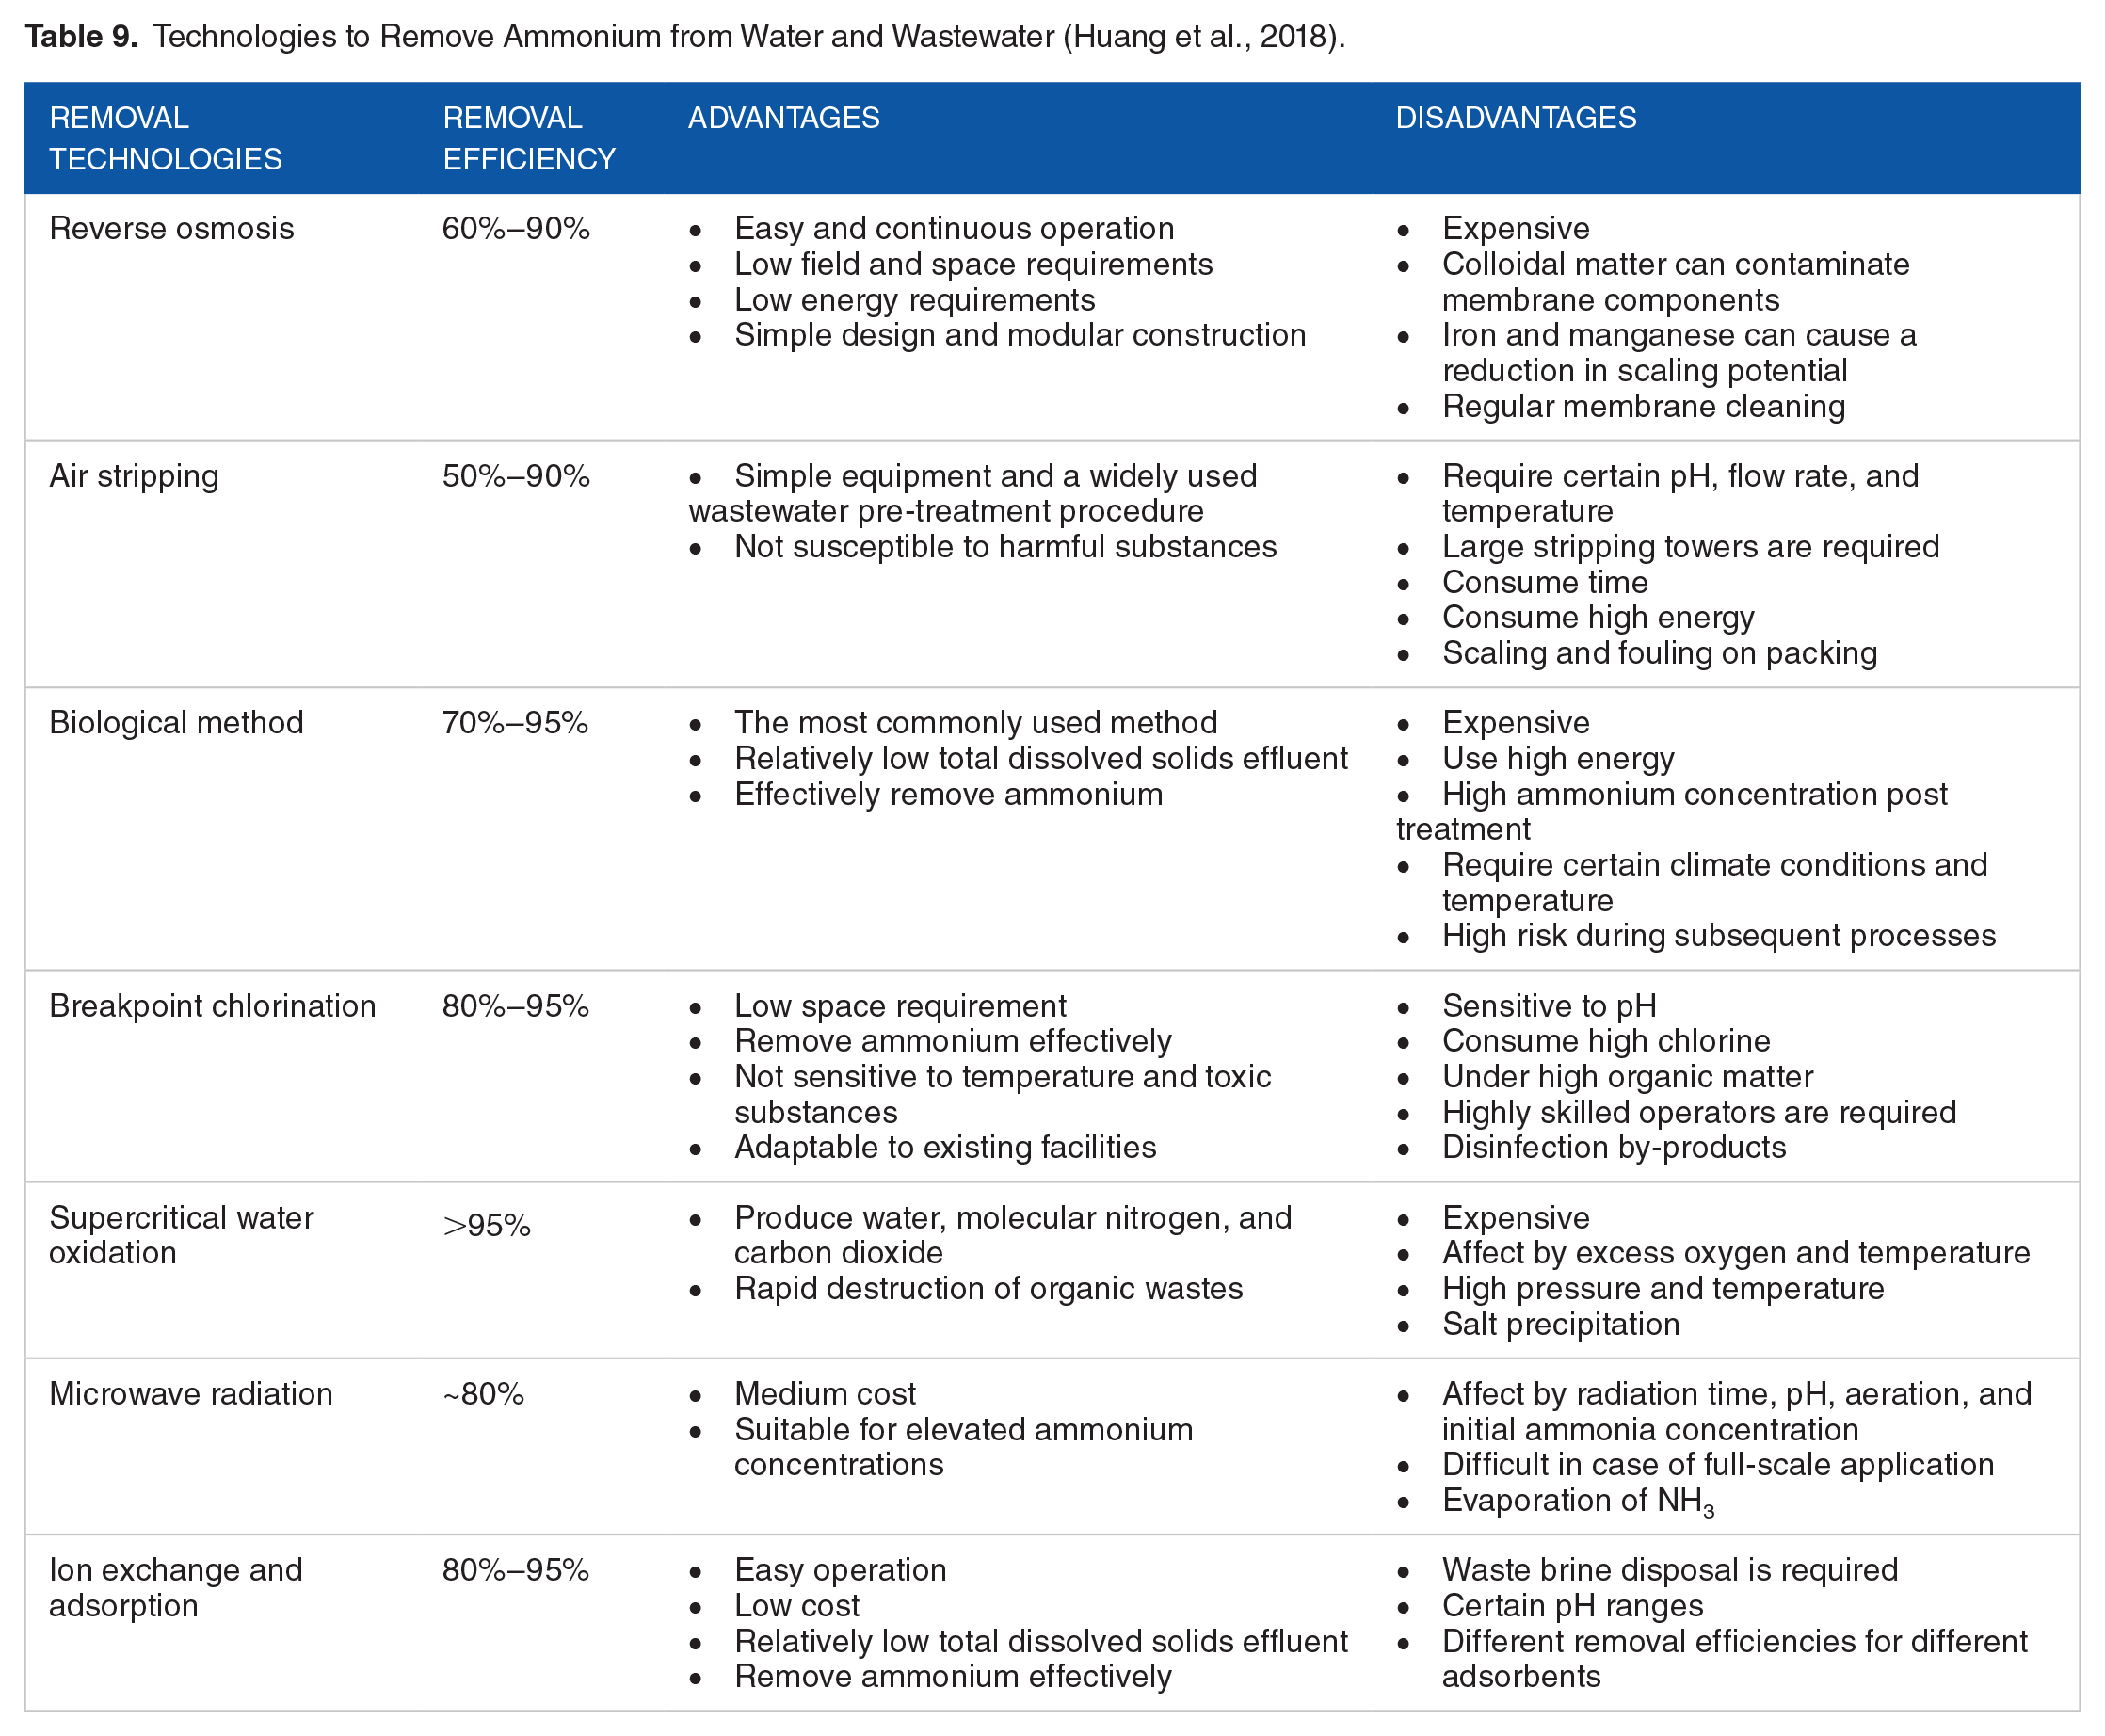
To shrink the growing gap between water supply and demand, there is an urgent need to benefit from the largest amount of treated water. The results showed that if the concentration of NH4-N in the treated water discharged from Al-Gabal Al-Asfar WWTP is reduced from 22.6 to 15 mg/L, NO3-N will decrease to the allowable limits in the Ismailia Canal due to the nitrification process. In this case, scenario 4 (utilize 1.50 million m3/day) becomes compatible with the limits of Law 92/2013, as shown in Figure 15. Ammonium pollution comes from scattered agricultural sources and is difficult to control. Industrial or municipal point sources such as wastewater treatment plants also contribute significantly to total ammonium pollution. From the literature review, there are technologies for ammonium removal, such as ion exchange and adsorption, biological method, air stripping, breakpoint chlorination, reverse osmosis, microwave radiation, and supercritical water oxidation as shown in Table 9 (Millier et al., 2010). The hydraulic part was also checked and the results showed that the current cross-sections along the canal can accommodate the additional flow of 1.50 million m3/day, and the rise in the water level downstream of the injection point does not cause flooding at any point along the canal, as shown in Supplemental Figure S4.

Predicated values of nitrate-nitrogen for the alternative scenario in January winter 2023.
Technologies to Remove Ammonium from Water and Wastewater (Huang et al., 2018).
Economic Analysis of Proposal Scenario
A channel should be constructed to accommodate an effluent discharge of 1.15 Mm3 per day from AL-Gabal AL-Asfer WWTP to the Ismailia Canal. Supplemental Figure S5 shown treated water canal path from Al Gabal Al-Asfar WWTP to the Ismailia Canal.The characteristics of the proposed channel are listed in Table 10. It is suggested that it be constructed next to the existing drain, which receives the effluent of AL-Gabal AL-Asfer WWTP and discharges it into the Bahr Al-Baqar drain. The main cost components for constructing the channel are the excavation and lining. The cost of different construction items was estimated based on quotations from independent authorities, such as Sovereign, which specialized in civil works in late 2023. The quotations included materials, labor, survey works, and transportation costs, as shown in Supplemental Table S5. The maintenance and operational costs were assumed to be 5% of the capital costs for the routing channel (Abdeldayem et al., 2020; Aly et al., 2022).
Characteristics of the Proposed Channel.
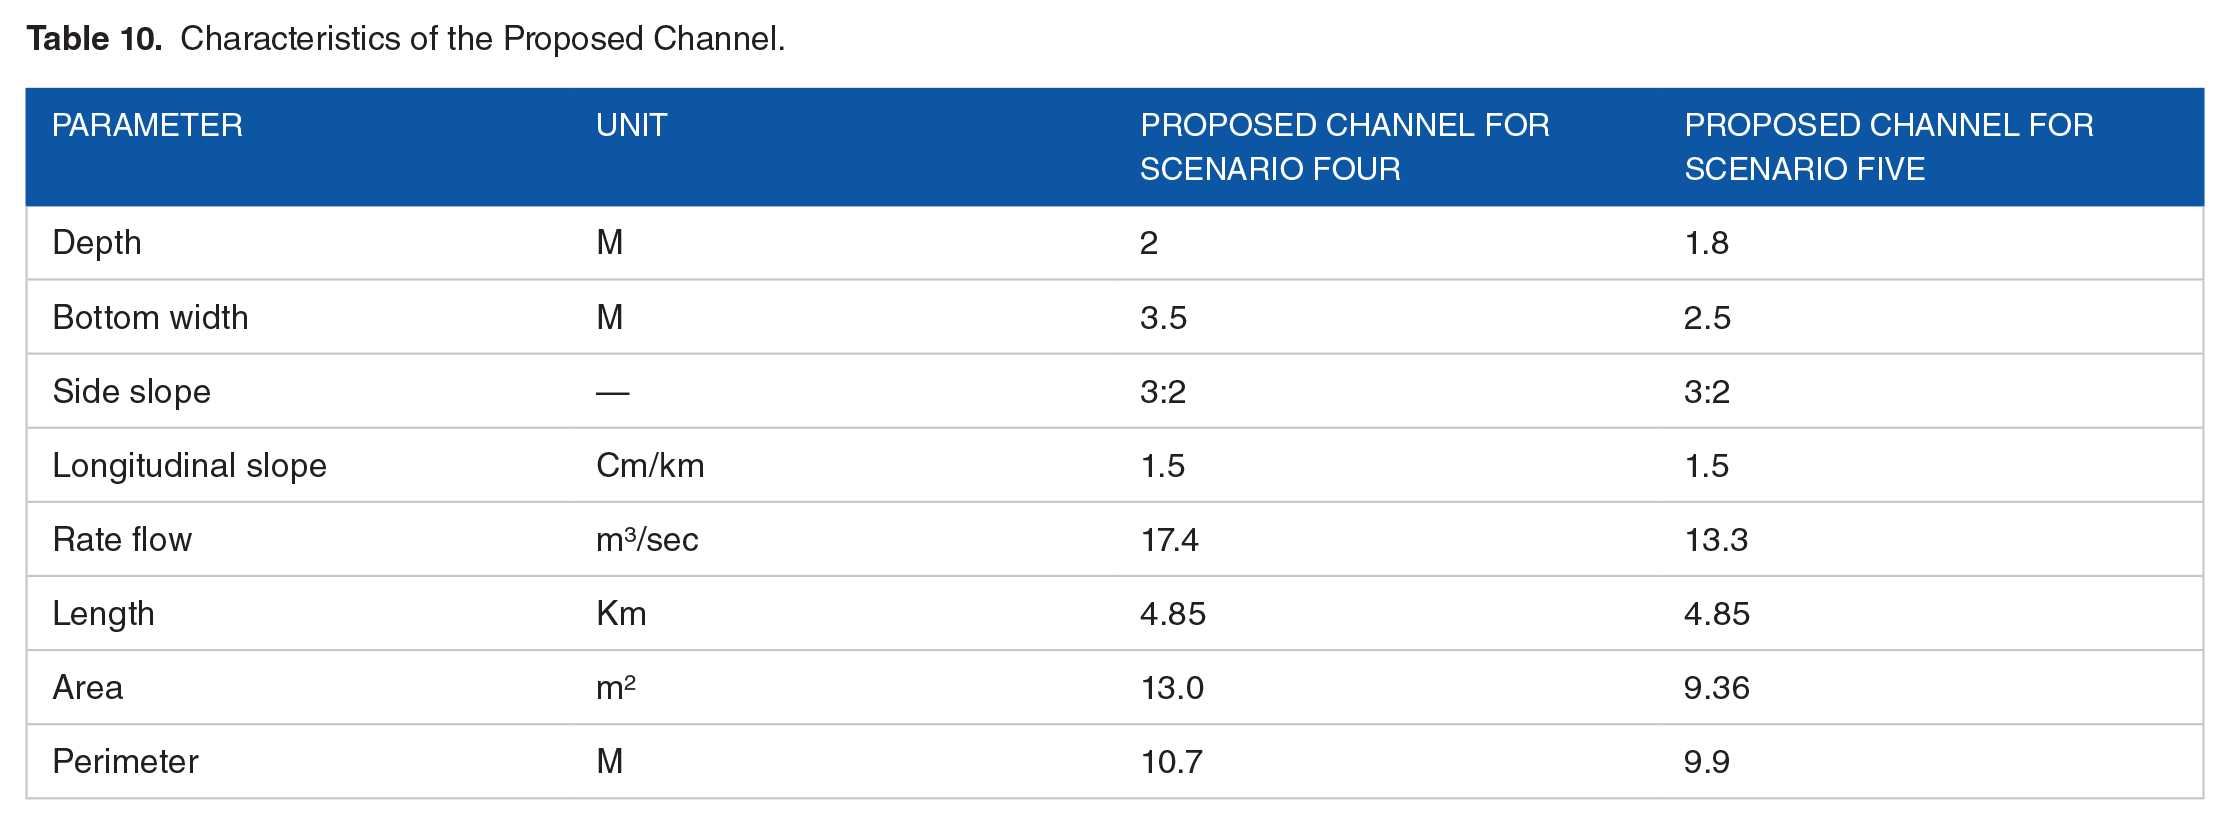
A plain concrete lining with a thickness of 10 cm was selected based on the channel discharge and water depth and because of its long life, high durability, structure stability, resistance to erosion, and high permissible velocity. The total cost estimate for channel construction operations is illustrated in Table S6. The total cost of the project including the capital expenditures and the operating expenses is about $1,433,295 for the fourth scenario and $422,680 for the fifth scenario, refer to Table 11. Egypt is currently facing a significant shortage of potable water, with the per capita availability standing at 520 m3 annually, which is considerably below the necessary threshold of 1,000 m3/year. This situation has resulted in a critical water deficit, highlighting the urgent need to develop additional water sources to address the imbalance in the water supply. In this instance, an investment of about $850,000 to add an ammonium removal units could be allocated to the proposed project, capitalizing on the disparity in water volume between the fourth and fifth scenarios, amounting to 350,000 m3/day. This is a significant quantity, particularly for a nation facing a water shortage.
Total Costs of the Proposed Project.

Strict Preventive Measures and Emergency Plans
If Egypt is going to implement the proposal project, many precautions must be taken, as shown in Figure 16:
Wastewater should be treated to the tertiary level before being released into rivers.
Ensure efficient operation of Al-Gabal Al-Asfar WWTP.
Prevent any source of pollution along the Ismailia Canal.
Continuous water quality monitoring for the plant’s effluent (DO, temperature, total dissolved solids [TDS], and pH).
Continuous monitoring of water quality on the Ismailia canal 100 m downstream of the feed point for the following parameters: DO, temperature, total dissolved solids (TDS), and pH. If the concentration of any of the measured parameters exceeded the allowable limits, the discharge to the Ismailia canal should stop and a bypass scenario should applied (effluent should flow to the Belbeis drain, and then into the Bahr EI Baqar Drain).
Collect samples from the Ismailia canal and from the effluent of the WWTP periodically to be analyzed for BOD, COD, TSS, TP, NO3-N, and NH4-N.
Install a flow meter on the proposed channel that transport treated wastewater from the WWTP to the Ismailia canal to control discharge of effluent (1.15 million cubic meter per day).
Keep discharge in Ismailia canal as the same discharge in January winter 2023 (196.0 m3/s) to keep on mass balance.
The proposed project must be subject to the supervision of experts from the Egyptian Ministry of Health, the National Authority for Drinking Water and Sanitation, and the Ministry of Environment.
The environmental impact expected from the proposed project is increasing the sediment in the canal according to total suspended solids in treated water, reducing the dissolved oxygen level in the injection point at the canal due to the organic loads in effluent of the WWTP, as well as enhancing plant growth due to nutrients in the effluent water. So, the canal will need regular maintenance to over come those challenges. Additionally, the DO concentration in the Ismailia Canal should be increased using appropriate technologies such as applying wave action (weir), paddle wheel aerators, or nanobubbles technology.

Precautions to implement the proposed solution.
Implementation Plan
Egypt is facing an escalating demand for water driven by rapid population growth, urbanization, and an expanding agricultural sector. With its surface water resources fully utilized and groundwater extraction at its peak, the country’s Vision 2030 prioritizes the reuse of wastewater for various applications. Many nations are developing regulations for the use of treated wastewater in irrigation and other sectors. As part of this framework, Egypt plans to allocate 5.82 billion cubic meters of treated wastewater directly for agricultural enhancement. The Ministry of Agriculture and Land Reclamation has announced an initiative to reclaim 1.4 million acres for agricultural use (AbuZeid et al., 2014). Thus, Egypt is actively promoting the reuse of treated wastewater. Countries facing water scarcity could benefit from adopting similar strategies, aligning their approaches with national policies on wastewater reuse.
Conclusions
This research aimed to study the effect of discharging the treated effluent of Al-Gabal Al-Asfar WWTP directly to the Ismailia Canal. A water quality model was developed using QUAL2K to evaluate the water quality of the Ismailia Canal, comparing the results with the limits of Article 49 of Egyptian Law 92/2013. A hydraulic model was also developed using HEC-RAS to simulate the hydraulic performance along the canal at different flow rates after injecting treated water. The results of this study showed that the best injection location for the treated water from Al-Gabal Al-Asfar WWTP into the canal at 13.5 km from upstream. Five scenarios with different flow rates were simulated, showing that scenario 5 is the best scenario according to the water quality limits in Article 50 of Law 92/2013. This scenario allows the use of 1.15 million m3 per day of treated water, representing 7% of the total water in the Ismailia Canal. The fifth scenario was simulated according to the amount of water added to the Ismailia canal using the HEC-RAS model, and the current cross-sections along the canal can accommodate the additional flow without flooding. It is possible to benefit from the treated water to a greater extent and apply the fourth scenario by discharging 1.50 million m3 of the treated water per day to the canal. However, the ammonium concentration in the effluent should be reduced to 15 mg/L. In this case, the fourth scenario becomes compatible with the water quality limits in Article 50 of Law 92/2013.
The results also showed that the discharging the treated water to the Ismailia Canal has improved the dissolved oxygen concentration downstream of the injection point. However, the DO concentration along the canal did not reach the standard limits. It is recommended that DO concentration in the Ismailia Canal be increased using appropriate technologies. The total cost of the channel transporting the treated effluent from Al-Gabal Al-Asfar WWTP to the Ismailia Canal is about $422,677, including construction, operations, and maintenance costs. If Egypt succeeds in implementing the project, it will be considered a significant step forward in wastewater reuse, as the study can be applied to many wastewater treatment plants. However, strict preventive measures and emergency plans should be used to ensure the sustainability and safety of the proposed solution. In general, the results of this study can be part of a decision support system regarding the reuse of treated wastewater in any country that suffers from water scarcity.
The Future Research
Based on what was studied during this research, we recommend the following in the future research:
Using 3D water quality modeling to simulate this study and compare the results with our results.
Use more water quality parameters than those used in the study.
Using Hydraulic structures that are used to improve water quality.
Supplemental Material
sj-docx-1-asw-10.1177_11786221251315058 – Supplemental material for Evaluating the Impacts of Discharging the Effluent of Al-Gabal Al-Asfar Wastewater Treatment Plant on Ismailia Canal in Egypt to Maximize Revenue and Ensure Sustainability
Supplemental material, sj-docx-1-asw-10.1177_11786221251315058 for Evaluating the Impacts of Discharging the Effluent of Al-Gabal Al-Asfar Wastewater Treatment Plant on Ismailia Canal in Egypt to Maximize Revenue and Ensure Sustainability by Marwa M Aly, Mohamed SM Zayed, Mahmoud S Salem and Mohamed K Mostafa in Air, Soil and Water Research
Supplemental Material
sj-docx-2-asw-10.1177_11786221251315058 – Supplemental material for Evaluating the Impacts of Discharging the Effluent of Al-Gabal Al-Asfar Wastewater Treatment Plant on Ismailia Canal in Egypt to Maximize Revenue and Ensure Sustainability
Supplemental material, sj-docx-2-asw-10.1177_11786221251315058 for Evaluating the Impacts of Discharging the Effluent of Al-Gabal Al-Asfar Wastewater Treatment Plant on Ismailia Canal in Egypt to Maximize Revenue and Ensure Sustainability by Marwa M Aly, Mohamed SM Zayed, Mahmoud S Salem and Mohamed K Mostafa in Air, Soil and Water Research
Footnotes
Acknowledgements
The authors would like to thank Helwan University for supporting this research. The authors would like also to thank Prof. Ahmed Gaber from Cairo University for providing the necessary advise.
Author Contributions
Marwa M Aly, Mohamed SM Zayed, Mahmoud S Salem, and Mohamed K Mostafa: research, conceptualization, methodology, Validation, and data analysis. Marwa M Aly, Mohamed SM Zayed, Mahmoud S Salem, and Mohamed K Mostafa: original draft writing and editing. Marwa M Aly, Mohamed SM Zayed, Mahmoud S Salem, and Mohamed K Mostafa are responsible for reviewing the first draft of the manuscript. Marwa M Aly, Mohamed SM Zayed, Mahmoud S Salem, and Mohamed K Mostafa are responsible for fieldwork, map creation, and data collection and support in final draft writing. Marwa M Aly, Mohamed SM Zayed, Mahmoud S Salem, and Mohamed K Mostafa are responsible for reviewing the final draft after addressing all reviewers’ comments. Marwa M Aly, Mohamed SM Zayed, and Mohamed K Mostafa: Supervision and Project Administration.
Declaration of Conflicting Interests
The author(s) declared no potential conflicts of interest with respect to the research, authorship, and/or publication of this article.
Funding
The author(s) received no financial support for the research, authorship, and/or publication of this article.
Institutional Review Board
Not applicable.
Informed Consent
Not applicable.
Data Availability
Not applicable.
Supplemental Material
Supplemental material for this article is available online.
References
Supplementary Material
Please find the following supplemental material available below.
For Open Access articles published under a Creative Commons License, all supplemental material carries the same license as the article it is associated with.
For non-Open Access articles published, all supplemental material carries a non-exclusive license, and permission requests for re-use of supplemental material or any part of supplemental material shall be sent directly to the copyright owner as specified in the copyright notice associated with the article.