
Abstract
Continuous-based comparison of the hydrological model is applied in different parts of a watershed across the world. However, little has been done on hydrological modeling comparison in Ethiopian watersheds, and nothing was done to the Robi watershed. This study aimed to compare two hydrological (SWAT and HEC-HMS) models for modeling the Robi watershed using monthly continuous data. To achieve this objective climate data, spatial and hydrological data were collected. The model was calibrated and validated using observed streamflow data from 1995 to 2004 and 2005 to 2011, respectively. The performance of the model shows that, during the calibration of the SWAT model, R2, Nash-Sutcliff efficiency, PBIAS, p-factor, and r-factor indicate that .82, 0.81, 2%, .83, and 1.03, and in the validation, it indicates that .73, 0.71, 4%, .88, and 1.5, respectively. Similarly, in the HEC-HMS model, R2, Nash-Sutcliff efficiency, and PBIAS indicate .8, .79, and −3 for calibration and .7, 0.68, and −6, respectively in validation. The model was compared in the time domain and quantile domain. The magnitude of observed monthly stream flows for 10%, 50%, and 95% exceedance percentages is 10.7, 2, and 0.14 m3/s. Simulated flow shows exceedance probabilities of 10%, 50%, and 95% as 9.766, 1.8, and .15 for the SWAT model and 9.34, 1.7, and 0.6 m3/s for the HEC HMS model, respectively. Overall the SWAT model performed better than the HEC-HMS model in the Robi Watershed.
Introduction
Hydrological models are applied in different watersheds across the globe for a better understanding of the hydrological process (Gebre, 2015) and also for different purposes from real-time flood forecasting and designing a structure for water discharges, developing policies to protect from damages by extreme hydrological events (i.e. floods and droughts; Mobarhan & Sangchini, 2021) and watershed modeling (Beza et al., 2023; Dinku & Kebede, 2023). However, modeling a watershed is a challenging task for hydrologists due to its complexities in integrating a network of sub-watershed and hydro-meteorological stations (Sewmehon et al., 2022). Also, such kinds of watershed modeling require long continuous rainfall series with high temporal and sufficient spatial resolution (Haberlandt & Radtke, 2011). Despite these hurdles, watershed modeling is important because it gives necessary information for water resource planning and environmental protection.
Continuous timestep modeling of a watershed is vital to simulate the natural and anthropogenic activity alteration like runoff, and transport of sediments, chemicals, and nutrients (Abebe et al., 2022) excluding flood and drought. Since flood and drought an extreme events, therefore, they are evaluated using event-based simulation. Simulation of continuous-based processes is vital for addressing a wide range of water-resource problems, such as quantifying changes in water availability through time, understanding the effects of climate and land-use changes on water resources (Singh & Marcy, 2017), quantifying changes in constituent loads and yields over time, and quantifying aquifer recharge temporally and spatially throughout a watershed (Ávila et al., 2022). To do these, a variety of hydrological models are used including lumped, semi-distributed, and distributed based on the variation of its input parameters (Aqnouy et al., 2023).
Many scholars used lumped model (Babak et al., 2021; Enrique et al., 2019; Wubneh et al., 2022) for modeling a watershed due to its simplicity, especially in developing countries do not have sufficient input parameters and data for calibration of the model despite its uncertainties in model structure, input data accuracy, and calibration parameter (Aqnouy et al., 2023; Ávila et al., 2022). The conceptual model (GR4J and IHACRES) uses empirical equations and model parameters to represent a watershed as a progression of internal storage (Gull & Shah, 2020). A study by Ruelland et al. (2010) compares two conceptual models (HydroStrahler and GR4J) for the simulation of hydro-climatic variability in the Sudano-Sahelian catchment. The result showed that both models simulate the runoff within a reasonable performance range with Nash-Sutcliff efficiency of greater than 80%. In semi-distributed (e.g. SWAT and HEC-HMS) models, the watershed is classified into small parcels of lands called hydrological response units while in distributed hydrological model (e.g. MIKE SHE), the watershed is discretized in a more detailed way into cells or a regular or irregular mesh.
Due to different catchment sizes, a variety of climatic zones, and different land use covers (such as terrain, vegetation, and urbanization) and calculation methods in hydrological processes, a model results in different simulation outputs (Gao et al., 2016). Moreover, with variations in the input parameters of a model, the performance of the model has been varied. The important point is that different models give different simulations of the same variable in the same watershed with the same inputs. This is because different models have different structures and parameterizations. Therefore, to obtain excellent research results, using a well-performed model is necessary. A study by Chathuranika et al. (2022), compared HEC-HMS and SWAT models in tropical watersheds and showed that, in seasonal cases, the SWAT model performs better than HEC-HMS. Tegegne, Park and Kim (2017) compare two conceptual (GR4J and IHACRES) and one process-based model (SWAT) in the upper Blue Nile of the Tana basin in terms of time-domain and quantile domain-based model performance. The result reveals that the performances of the models varied from one watershed to the other and also the author discussed that the accuracy of the model depends on the quality of the climate data. Brirhet and Benaabidate (2016) compared HEC-HMS and ATHYS models to model a watershed. The two models perform well in the Issen watershed in the Souss Basin. Other researchers in the sub-humid tropical Hemavathi catchment, comparison of HEC-HMS and SWAT model by Sanjay Shekar and Vinay (2021) depicts that, the SWAT model performs better than HEC-HMS. On the contrary, in a study by Doliso and Hatiye (2022) in the Gidabo and Bilata watershed a comparison analysis revealed that the HEC-HMS model outperformed the SWAT model in simulating streamflow in both watersheds. This shows that the ability of the model to simulate a watershed is different from one to the other.
Little has been done on hydrological modeling comparison in Ethiopian watersheds, and nothing was done regarding side-by-side comparisons of different models specifically applied to the Robi Watershed within the Middle Awash Basin. This study could address the need for more focused comparisons that assess model performance. Also, there is a lack of understanding regarding the transferability of hydrological models developed in other regions to the Robi Watershed. This study could compare models to see how well they perform when applied to a new context, contributing to knowledge about model adaptability. The objective of this study was to evaluate the performance of two hydrological models in the Robi watershed, middle Awash River basin. The main novelty of the study was testing, applying, and comparing the HEC-HMS and SWAT hydrological model for the modeling of the watershed and to recommend the well-performed model in the watershed for further study.
Materials and Methods
Study area description
Geographically, the watershed is located between 9.83°N to 10.08°N latitude and 39.67°E to 40.08°E longitude (Figure 1). Robi watershed is located in the middle Awash River basin (Beza et al., 2023; Dinku & Kebede, 2023). The river originates in the west of Shewa Robit town with a watershed area of 296 km2 from the outlet. The area is a steep slope at the upstream side and flat on the downstream which is suitable for irrigation and the population is dependent on agriculture (mainly rainfed), although there is also some traditional irrigation practice.

Location map of the study area.
The majority of Ethiopia has a tropical climate, which varies with height. The eastern lowlands have hotter, semi-arid to desert climates and are significantly drier. Nonetheless, the country’s highlands and southwest receive high rainfall greater than 1,000 mm yearly. The Robi watershed, like other parts of the nation, has low temperatures and high rainfall on the ridge and mountains, and high temperatures and low rainfall in the low-lying areas. The mean annual observed rainfall was 972 mm at Shewa Robit gauge station (Beza et al., 2023).
The temperature has a significant impact on recharge and evapotranspiration in the Robi watershed. In contrast to evapotranspiration, high temperatures reduce recharging. Summer time averages of 21.6°C and winter time averages of 13°C (dry season) have been observed. The Robi watershed has an average annual temperature of 18.3°C.
Data collected and analysis
Today, many more hydrological models are developed to study the hydrological process of a watershed. Hydrologiska Byrans Vattenbalansavdelning-96 (HBV-96; Bergström, 1992), Système Hydrologique Européen (MIKE SHE; DHI, 2005), Hydrological Modeling System (HEC-HMS; HEC, 2000), and Soil and Water Assessment Tool (SWAT; Arnold et al., 1998) are some of a hydrological model. However, based on the hydrologic processes modeled, their documentation, versatility, experiences, accessibility, data availability, applicability, and cost-effectiveness, for this study SWAT and HEC-HMS models are selected.
The crucial input data or simulating the rainfall-runoff process are classified into hydrological (streamflow), meteorological (precipitation, temperature, relative humidity, solar radiation, and wind), and spatial (land use/cover, soil type, and digital elevation model). In this study, rainfall, stream flow, soil, Land Use Land Cover (LULC), and digital elevation model at 20 m × 20 m resolution data were used in Table 1.
The Main Input Data for These Two Models Are Listed in the Table With Their Sources.

Precipitation, temperature, wind speed, relative humidity, and solar radiation were collected from a five-gauge station. For the HEC-HMS model, the areal average of the climate data was estimated using the Thiessen polygon method. The missing values of the climate data were filled using arithmetic mean and regression analysis based on the percentage of the missing in the data. To do this research a total of 1 year was taken starting from data collection to final manuscript drafting.
SWAT model setup
SWAT (Arnold et al., 2002) can simulate hydrological cycles, vegetation growth, and nutrient cycling with a daily time step by disaggregating a river basin into sub-basins and hydrologic response units (HRUs). SWAT uses the following water balance system to simulate the hydrologic cycle within a watershed (Equation 1).
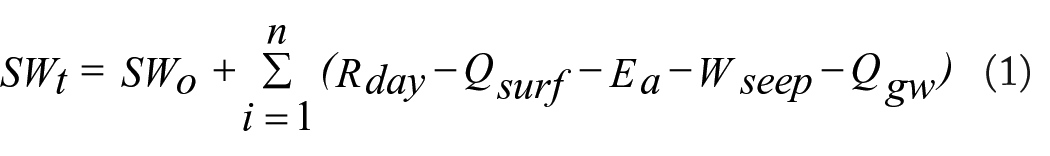
Where SWt is the soil water content (mm H2O) at time t, SWo is the initial soil water content on the day 0 (mm H2O), t is time, days, Rday is the amount of precipitation on the day i (mm H2O), Qsurf is the amount of surface runoff on the day i (mm H2O), Ea is the actual evapotranspiration on the day i (mm H2O), Wseep is the amount of water entering the vadose (unsaturated) zone from the soil profile on the day i (mm H2O), Qgw is the amount of return flow on the day i (mm H2O).
The model reflects the difference in evapotranspiration for various land uses and soil types in the subdivision of watersheds. The runoff was generated from each HRU and routed to obtain the total yield at the outlet of the watershed. Hence, it increases the accuracy and gives a better physical description of the water balance.
Estimation of surface runoff
The surface runoff in the model is estimated separately for each sub-basin and routed to estimate the stream flow for the watershed. The most commonly used method for estimating surface runoff in SWAT models is the modified SCS-CN2 (Mishra & Singh, 2003) with a daily time step or the Green-Ampt Mein–Larson infiltration equation (Green & Ampt, 2011) even if rainfall is available at daily timescale. SWAT simulates surface runoff volumes and peak runoff rates for each Hydrologic Response Unit (HRU). The SCS curve number method is less data-intensive than the Green-Ampt method. Therefore, the SCS curve number method was used to estimate surface runoff volumes in this study. The SCS curve number (Mishra et al., 2019) equation is given as in Equation 2.

The potential maximum retention (S) is a function of the Curve Number (CN). The potential maximum retention is given by Equation 3.

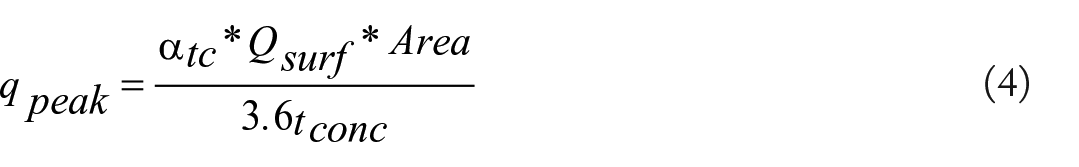
Estimation of peak runoff
The peak discharge, or the peak surface runoff rate, is the maximum volume of flow rate passing a particular location during a storm event. SWAT calculates the peak runoff rate with a modified rational method. It is assumed that the intensity of rainfall begins at time t = 0 and continues indefinitely. The rate of runoff is increased until the time of concentration and mathematically it is given in Equation 4.
Where,
HEC-HMS model setup
Herein, the model used for comparison was the HEC-HMS model, it is a semi-distributed conceptual hydrological model that simulates flow and runoff. This model is used for watershed modeling which was developed by the US Army Corps of Engineers and has been applied for flood frequency analysis, urban flooding, flood warning system planning, and extreme event estimation like flood study.
The HEC-HMS model consists of seven basic elements. Those include sub-basin, reach, reservoir, junction, diversion, source, and sink. In the sub-basin different processes take place such as canopy, loss, transform (routing), and base flow. HEC–HMS has four basic models to compute the cumulative losses. These are the initial and constant-rate loss model, deficit and constant-rate loss model, SCS–CN (Soil Conservation Service–Curve Number) loss model, and Green-Ampt loss model. Among these, the daily surface runoff volume of the study area was estimated using SCS–CN due to its simplicity, ease of use, lesser input data requirements, use of major runoff-producing characteristics, and widespread acceptance (Mishra et al., 2019) despite its constant intensity for fixed rainfall depth irrespective of the rainfall duration and infiltration approaches to null for the long duration of the storm assumption (Sewmehon et al., 2022).
From different routing methods, in which direct runoff is transformed to stream flow by a user-selected transform method. In this study, the elective transformation method was the SCS Unit Hydrograph (UH). This method needs a lag time (
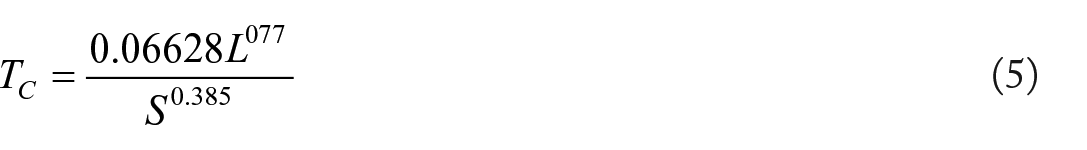
Where

Another component of the HEC HMS model was base flow computation. Base flow and direct runoff are the two distinguished components of stream flow (HEC, 2000). Base flow determines how infiltrated water returns to the stream at the watershed outlet. The model includes three user-specified base flow models. Constant, monthly varying is the simplest which models the base flow as constant but it may vary monthly. The exponential recession model forms the relationship between the discharge

Where
The linear reservoir model is used combined with the continuous soil-moisture accounting (SMA) model. This baseflow model simulates the storage and flow of subsurface as storage and flow of water through reservoirs (HEC, 2000). The reservoirs are linear: the outflow at each time step of the simulation is a linear function of the average storage during the time step.
Calibration and validation procedures of the model
Calibration was done after selecting the most sensitive parameters of the model parameter using the observed flow from 1995 to 2004. Sensitivity analysis is the method of identifying the rate of change in model outputs concerning changes in model parameters (Arnold et al., 2012). A sensitive parameter was selected after dummy running. It is necessary from two different points of view: One, parameters represent processes, and sensitivity analysis provides information on the most crucial parameters that influence the output in the modeling watershed. Two, by eliminating the less sensitive parameter it is important to decrease the number of iterations, time, and parameters during the calibration (Abbaspour et al., 2017).
In the SWAT model sensitivity and calibration were done using SWAT-CUP in SUFI-2 (Sequential Uncertainty Fitting 2 (Abbaspour, 2012). In this program, the sensitivity was selected based on the absolute value of t-stat and p-value. The model parameter is sensitivity when the absolute value of t is high and the minimum p value. The monthly calibration and validation of the SWAT model for runoff yield was performed following sensitivity analysis for flow. Calibration is an effort to better parameterize a model to a given set of local conditions, thereby reducing the prediction uncertainty (Abbaspour et al., 2017).
In HEC-HMS, the systematic search for the best (optimal) parameter values follows the procedures shown in Figure 2. This procedure begins with data collection. For rainfall-runoff models, the required data are rainfall and flow time series. For routing models, observations of both inflow to and outflow from the routing reach are required. Given these initial estimates of the parameters, the models included in the program can be used with the observed boundary conditions (rainfall or upstream flow) to compute the output, either the watershed runoff hydrograph or a channel outflow hydrograph. Then, the model compares the computed flow with the observed flow. This comparison aims to judge how well the model “fits” the real hydrologic system. If the fit is not satisfactory, the program systematically adjusts the parameters and reiterates.

Illustration of HEC HMS model calibration.
When the fit is satisfactory, the model will report the optimal parameter values. The presumption is that these parameter values then can be used for runoff or routing computations which are the goal of the modeling of the watershed.
Model performance evaluation
Herein, the performance of the model was checked by statistical tests that can be used to judge the model. It is important to use multiple evaluation criteria to minimize bias during model evaluation such as Nash Sutcliffe efficiency (NSE; Equation 8), percent bias (PBIAS; Equation 9), and coefficient of determination (R2; Equation 10) was used, which is recommended by Moriasi et al. (2007; Table 2).
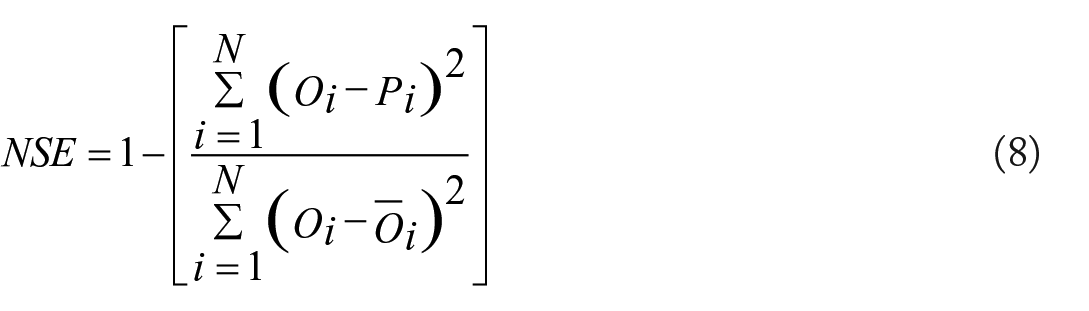
Where, NSE = Nash–Sutcliffe efficiency, Pi = simulated flow, Oi = observed flow,


Where,
General Performance Ratings of Simulated Discharge (Moriasi et al., 2007).

The general methodological framework of the study is shown in Figure 3.

The framework of the study.
Result and Discussion
Parameter sensitivity and model uncertainty analysis
Because of the complexity of the model, the number of sensitive parameters varied (9 for HEC-HMS and 12 for the SWAT model). For the HEC-HMS model ranking of the sensitivity parameters based on their order of influence on the peak flow curves number, time lag, initial abstraction, X, K, and recession constant. The model was run repeatedly with each parameter’s initial baseline value increasing and decreasing by 25% but the remaining model parameter values are unchanged. In SWAT model the most sensitive model parameters in the watershed are R_SOL_AWC, R_CN2, V_REVAPMN, R_ESCO, V_GW_DELAY, V_ALPHA_BF, V_GWQMN, V_GW_REVAP, V_RCHRG_DP, R_SOL_K, R_SLSUBBSN, and R_SURLAG.
Hydrological models, such as SWAT and HEC-HMS, are susceptible to a variety of inherent uncertainties that may impact the accuracy as well as the reliability of their forecasts. The variability of the input data, the estimation of the model parameters, and the structural restrictions of the models themselves are some of the causes of these inaccuracies. It is essential to comprehend and measure these uncertainties to evaluate the models’ resilience and potential application in decision-making.
The sensitivity of model parameters and the variability in simulation results were the main areas of attention for the Monte Carlo simulation approach, which was used to evaluate the uncertainties in the model predictions. This analysis’s main objectives are to compare the accuracy of SWAT and HEC-HMS under various parameter configurations and to ascertain the model’s range of uncertainty.
The uncertainty ranges (95% confidence intervals) for HEC-HMS residuals CI is (−2.80, 4.31) and for SWAT residuals CI is (−3.24, 4.68). The residuals and their uncertainty ranges suggest that both models tend to under-predict or over-predict the streamflow within similar bounds, though SWAT shows slightly larger uncertainty.
The shaded uncertainty bands (Figure 4) show that both models generally follow the observed data trend closely, especially during high-flow events. However, the uncertainty is larger during peak flows, indicating that these high-flow periods are more difficult to predict accurately. This could be due to various factors such as the complexity of hydrological processes during extreme events. HEC-HMS shows slightly better performance in certain peaks where its line follows the observed values more closely. SWAT, on the other hand, seems to have slightly higher uncertainty, as indicated by its broader red band in some areas (Figure 4). Both models exhibit a good fit during low-flow periods, but SWAT tends to have a slightly broader uncertainty range, indicating it may be more variable in its predictions.

Model calibration and validation.
Generally, both HEC-HMS and SWAT models show good performance in simulating streamflow with a similar level of accuracy. However, during high-flow events, the uncertainty is larger, indicating that extreme events are harder to model accurately. HEC-HMS has slightly better performance with marginally smaller uncertainty bounds, while SWAT shows slightly larger residuals and uncertainty in its predictions.
Model calibration and validation
Both the SWAT and HEC HMS models were calibrated and validated using observed data from January 1995 to December 2004 and January 2005 to December 2011 (Figure 4). In the HEC-HMS model, finding the best parameter value has two methods. Univariate gradient model: evaluates and modifies one parameter at a time. However, Neldes and Mead (NM) use a downhill simplex to assess all parameters simultaneously and decide which one should be changed.
In SWAT model, was calibrated using SWAT CUP to show the intimate relationship between the simulated and observed flow. As shown in Figure 4 the simulated flow was in line with observed flow for both models. The SWAT model can handle peaks better than the HEC-HMS model. The percentage of observations within the 95PPU (p-factor) and the relative width of the 95% probability band (r-factor) were used as performance indicators for the model in the uncertainty estimation. In the SWAT-CUP manual, it was suggested that a p-factor value of above .7, and an r-factor of around 1.5, are acceptable (Abbaspour, 2014). Therefore, the p-factor and r-factor values for the study watershed were found to be acceptable, which reveals that the parameter uncertainties were within the desired ranges for the Robi watershed. A recent study by Beza et al. (2023) in the Jewuha watershed, which is near this study area for modeling of the watershed to assess the surface water potential using SWAT and spatial proximity regionalization technique indicates that the SWAT model can model the watershed well with an acceptable ranges of the statistical indices. Also, Dinku and Kebede (2023) use the SWAT model to evaluate the available surface water potential for surface irrigation in the Jewuha watershed revealing that, the watershed is modeled using the SWAT model, even though the model overestimates the simulated flow, which is in line with this study.
Performance evaluation of the model
The performance of the model was evaluated using statistical parameters. During the calibration of the SWAT model, the statistical parameter of R2, Nash-Sutcliff efficiency, PBIAS, p-factor, and r-factor indicates that .82, .81, 2%, .83, and 1.03, respectively. During the validation, it indicates that .73, 0.71, 4%, .88, and 1.5. Similarly, in the HEC-HMS model, the statistical parameters indicate .8, .79, and −3 for R2, Nash-Sutcliff efficiency, and PBIAS, respectively. However, during the validation period, the statistical indices are reduced due to no change in model parameters. R2, Nash-Sutcliff efficiency, and PBIAS show .7, .68, and −6, respectively in validation for the HEC-HMS model (Table 3). The negative value of PBIAS indicates that the model overestimates the simulated flow in the watershed.
Statistical Indices to Evaluate the Performance of the Model.

Comparison between SWAT and HEC HMS model
Time domain comparison of the model
There are different ways to compare hydrological models in the time domain. It includes hydrograph comparison, statistical analysis, extreme event analysis, and temporal validation. In the hydrograph comparison, the flow curves simulated by the models with those observed at different monitoring points are compared (Figure 5). As shown in Figure 4, the SWAT model can capture the peak discharge than the HEC-HMS model. As shown in Table 3, statistical analysis of the model performance indicates that the SWAT model performs better than the HEC-HMS model. In line with this study by Sanjay Shekar and Vinay (2021) in the Hemavathi catchment to check the performance of the HEC-HMS and SWAT model to simulate a stream flow, relatively SWAT model simulates better than the HEC-HMS model. Also, the scatter plots demonstrate the performance of the two hydrological models in Robi watersheds during both the calibration and validation period.

Scatter plot showing the correlation between simulation and observed flow.
Quantile domain model comparison
This approach helps in understanding how well a model performs not just on average, but also at different points in the distribution of the data. As shown in Figure 6, at the 25th quantile both the models perform well in the calibration and validation period. However, in the 75th quantile comparison of the models, the SWAT model performs better than HEC HMS in the calibration but in the validation period, the HEC HMS performs better in the 75th quantile. This shows that the low flow can be better simulated using both models but not the highest flow.

Box plot of the observed and simulated flow for both models during calibration and validation.
As shown in Figure 6, the box plot of the simulated and observed flow. This plot is necessary for the visual representation of the distribution of data, showing the median, quartiles, and outliers. This helps in understanding the variability and central tendency of the data. For each boxplot, the central box shows the average flow, the horizontal line is the median, the edges of the box are the 25th and 75th percentiles, and the upper blue diamond shape box shows the outliers. In the HEC HMS model, the outliers are not captured well.
Flow duration curves (FDCs) were created to compare high flows (10% exceedance), medium flows (40% exceedance), and low flows (90% exceedance) for simulated and observed monthly discharges in the Robi watershed between 1995 to 2011 period. Figure 7 illustrates the magnitude of observed monthly stream flows for 10%, 50%, and 95% exceedance percentages as 10.7, 2, and 0.14 m3/s. Simulated monthly discharges show exceedance probabilities of 10%, 50%, and 95% as 9.766, 1.8, and .15 for the SWAT model and 9.34, 1.7, and 0.6 m3/s for the HEC HMS model, respectively. This reveals that the SWAT model can perform better for the generation of high, medium, and low flows compared to the HEC-HMS model. A study by Tegegne et al. (2017) for selecting hydrologic modeling approaches for water resource assessment in the Yongdam watershed indicates that the SWAT model performed better than the other modeling approaches in simulating the mid-range, dry-condition and low flows, but in general, the result reveals that a multi-model ensemble approach with SWAT and either GR4J or IHACRES should be utilized for regional water resources assessment in the Yongdam watershed.

Flow duration curve of observed, SWAT, and HEC HMS simulated flow.
Conclusion
Hydrological models are applied in different watersheds across the globe for a better understanding of the hydrological process. However, selecting the best-performed model was a difficult task due to the lack of hydrological data, inaccurate climate data, and the modeler’s inability. Thus, the basic objective of this study was to compare SWAT and HEC-HMS hydrological models for modeling a watershed in the Robi watershed. Climate data, Digital Elevation Model (DEM), LULC, and soil data are the most indispensable data which is an input for the models. The model was calibrated between 1995 and 2004 and validated from 2005 to 2011. The performance of the model was evaluated using statistical parameters. During the calibration of the SWAT model, the statistical parameter of R2, Nash-Sutcliff efficiency, PBIAS, p-factor, and r-factor indicates that .82, .81, 2%, .83, and 1.03, respectively. During the validation, it indicates that .73, .71, 4%, .88, and 1.5. Similarly, in the HEC-HMS model, the statistical parameters indicate .8, .79, and −3 for R2, Nash-Sutcliff efficiency, and PBIAS, respectively. However, during the validation period, the statistical indices are reduced due to no change in model parameters. R2, Nash-Sutcliff efficiency, and PBIAS show .7, .68, and −6, respectively in validation for the HEC-HMS model. In the time domain comparison of the model, the flow curves simulated by the models with those observed at different monitoring points are compared and the result reveals that the SWAT model can capture the peak discharge than the HEC-HMS model. In the quantile comparison, at the 25th quantile both the models perform well in the calibration and validation period. However, in the 75th quantile comparison of the model, the SWAT model performs better than HEC HMS in the calibration but in the validation period, the HEC HMS performs better in the 75th quantile. This shows that the low flow can be better simulated using both models but not the highest flow. The limitation of this study was factors such as climate variability, land use changes, and human activities (e.g. irrigation and deforestation) can impact watershed hydrology and may not be fully accounted for in the models. Traditional irrigation activities in the study area affect the model outputs. We are not considering the effect of such type of irrigation activities due to the lack of accurate data on the irrigation system.
Footnotes
Author Contributions
M.B. and A.M.: investigation, conceptualization, resources, and visualization; A.M. and M.B.: formal analysis, methodology, software, validation, and writing-original draft preparation; A.M. and M.B.: writing-review and editing. All authors read and approved the final manuscript.
Declaration of Conflicting Interests
The author(s) declared no potential conflicts of interest with respect to the research, authorship, and/or publication of this article.
Funding
The author(s) received no financial support for the research, authorship, and/or publication of this article.
Ethical Approval
The submitted work is original and not have been published elsewhere in any form or language (partially or in full).
Data Availability Statement
All relevant data are included in the paper and any supplementary information, if required, can be provided upon request.