
Abstract
A study was carried out from November to May in the cropping season of 2016E.C to evaluate the performance of Temsa small scale irrigation scheme. Both internal and external indicators were considered for evaluation. The internal indicator efficiencies such as conveyance, application, storage, distribution uniformity, and deep percolation ratio and the external indicators such as agricultural output, water supply, water delivery capacity, physical, and economic and financial indicators were evaluated. The result reveals that, the average conveyance efficiency of the main, secondary, and tertiary canals were 79.6%, 85.6%, and 84.7%, respectively. The scheme has on average application efficiency (Ea), storage efficiency, deep percolation ratio, and distribution uniformity of 40.87%, 78.04%, 59.70%, and 93.33%, respectively. The poor Ea and low conveyance efficiency of the canal affected the overall scheme performance. The result reveals that, the overall efficiency of the scheme was 23.19%. The four basic agricultural output indicators of the scheme such as output per unit irrigated area, output per unit command area, output per unit irrigation diverted, and output per unit water consumed were 4,738.58 US$/ha, 1,176.08 US$/ha, 1.16 US$/m3, and 0.89 US$/m3, respectively. This shows that, the command area was beneficial and was giving a revenue for the farmers at the cropping season. The relative irrigation supply and the water delivery capacity of the canal were 2.37 m3 and 83%, respectively. In the current study, the irrigation ratio and the sustainability of the irrigated area were 0.25 and 0.43, respectively. The irrigation ratio was low due to the designing problem. Availability of water throughout the year and market accessibility near the scheme were the advantage of the scheme that encourage the farmers. However, the input costs were affecting the return obtained from the product. Hence it is better to provide access to credit for the sustainable production and improve the farmers income.
Keywords
Introduction
Ethiopia, the second most populous country in Africa (Worldo meter, 2023), would not be able to achieve its food security needs with a rainfed farming system due to land degradation, soil fertility depletion, climate change effects, and regional and temporal rainfall variability. Land degradation, soil fertility deterioration, rainfall variability in space and time, and soil moisture stress all had a significant impact on production (Worqlul et al., 2019; Zerssa et al., 2021). Since rainfall patterns in many countries have grown more unpredictable and inconsistent with conventional farming seasons, many development partners have recognized irrigation as the solution to the food insecurity problem that many developing countries face (Bowan et al., 2023). As a result, Ethiopia is concentrating on irrigated agriculture by building dams and other water harvesting structures as well as irrigation infrastructure in small- and large-scale irrigation schemes for increased productivity and sustainable production. Therefore, the government is funding the creation of small-scale irrigation projects based in communities in an effort to control food insecurity (Ministry of Water Resources, 2001).
Small-scale irrigation is irrigated agriculture production on a small plot of land, and the construction, operation, and maintenance require a relatively lower investment cost and is considered important for food security and food self-sufficiency. Its development has a significant role in raising production and productivity to achieve food self-sufficiency and ensure food security at the household and national levels (Brabben et al., 2004; Gebregziabher et al., 2009; Tesfaye et al., 2008). It is a means of alleviating poverty and can also stabilize agricultural output, improve livelihood circumstances in communities, and lessen the negative impacts of erratic rainfall. Typically, irrigation from the small-scale plan might lead to food self-sufficiency, advanced economic income, and assets accumulation (Bekele, 2011). It is also possible to raise productivity per area, increase the amount of production produced annually, and solve the issue of unpredictable rainfall, all of which could result in more sustainable and better incomes for better livelihoods (Smith, 2004).
Even though the focus of irrigation development in Ethiopia is to maximize agricultural production, to satisfy the country’s ever-increasing food demand, and to improve the income of smallholder farmers through the construction of schemes, the performance of most schemes was below the expected design (Embaye et al., 2020; Haile et al., 2020). Ethiopia’s irrigation schemes performed poorly due to a combination of institutional, social, technical, and environmental problems (Amede, 2015; Awulachew & Ayana, 2011; Berhane et al., 2016). According to Mengiste and Kidane (2016), insufficient beneficiary participation and unstable land ownership have been the primary causes of irrigation projects failure. Even though these studies were widely shown, some of the opportunities that might indicate performance improvements were the efficient administration of the plan and the management of irrigation water at the field. There has been a growing push to enhance irrigation schemes’ performance in order to guarantee land and water production because of farmers’ growing interest in irrigation, rising water demand, and the highly committed support of extension experts.
Researchers and irrigation scheme administrators are increasingly evaluating the performance of irrigation schemes due to their significant impact on scheme productivity (Fufa, 2017). These kinds of practices could aid in the development of potential intervention mechanisms that could be implemented to enhance the schemes’ performance. The intended purpose of the designed scheme must be determined by regularly evaluating and monitoring the irrigation system with respect to crop output, land, and water productivity as the irrigation system’s ultimate goals (Abo et al., 2024; Moges, 2022). Therefore, the overall objective of the current study was to evaluate the performance of Temsa small scale irrigation scheme in the cropping season of 2016 E.C. The specific objectives were (1) To evaluate the internal indicators of the small-scale irrigation scheme. (2) To evaluate the external indicators of small-scale evaluation at Temsa scheme.
Materials and Methods
Description of the study site
The study site was located in Jimma zone of the Oromia regional state in Gomma district at a place called “Dalacho” approximately 55 km from Jimma town. Geographically it is situated between 7°86.24′ latitude, 36°6.5′ longitude, and at an altitude of 1,642 m above mean sea level (AMSL; Figure 1). It has a long year maximum and minimum temperature, average relative humidity, average wind speed and average solar radiation of 31.4°C, 9.9°C,73.4%, 1.8 m/s, and 6.1 hr, respectively. The total annual average rainfall was 1,655 mm distributed non-uniformly mainly in the summer season (Figure 2).
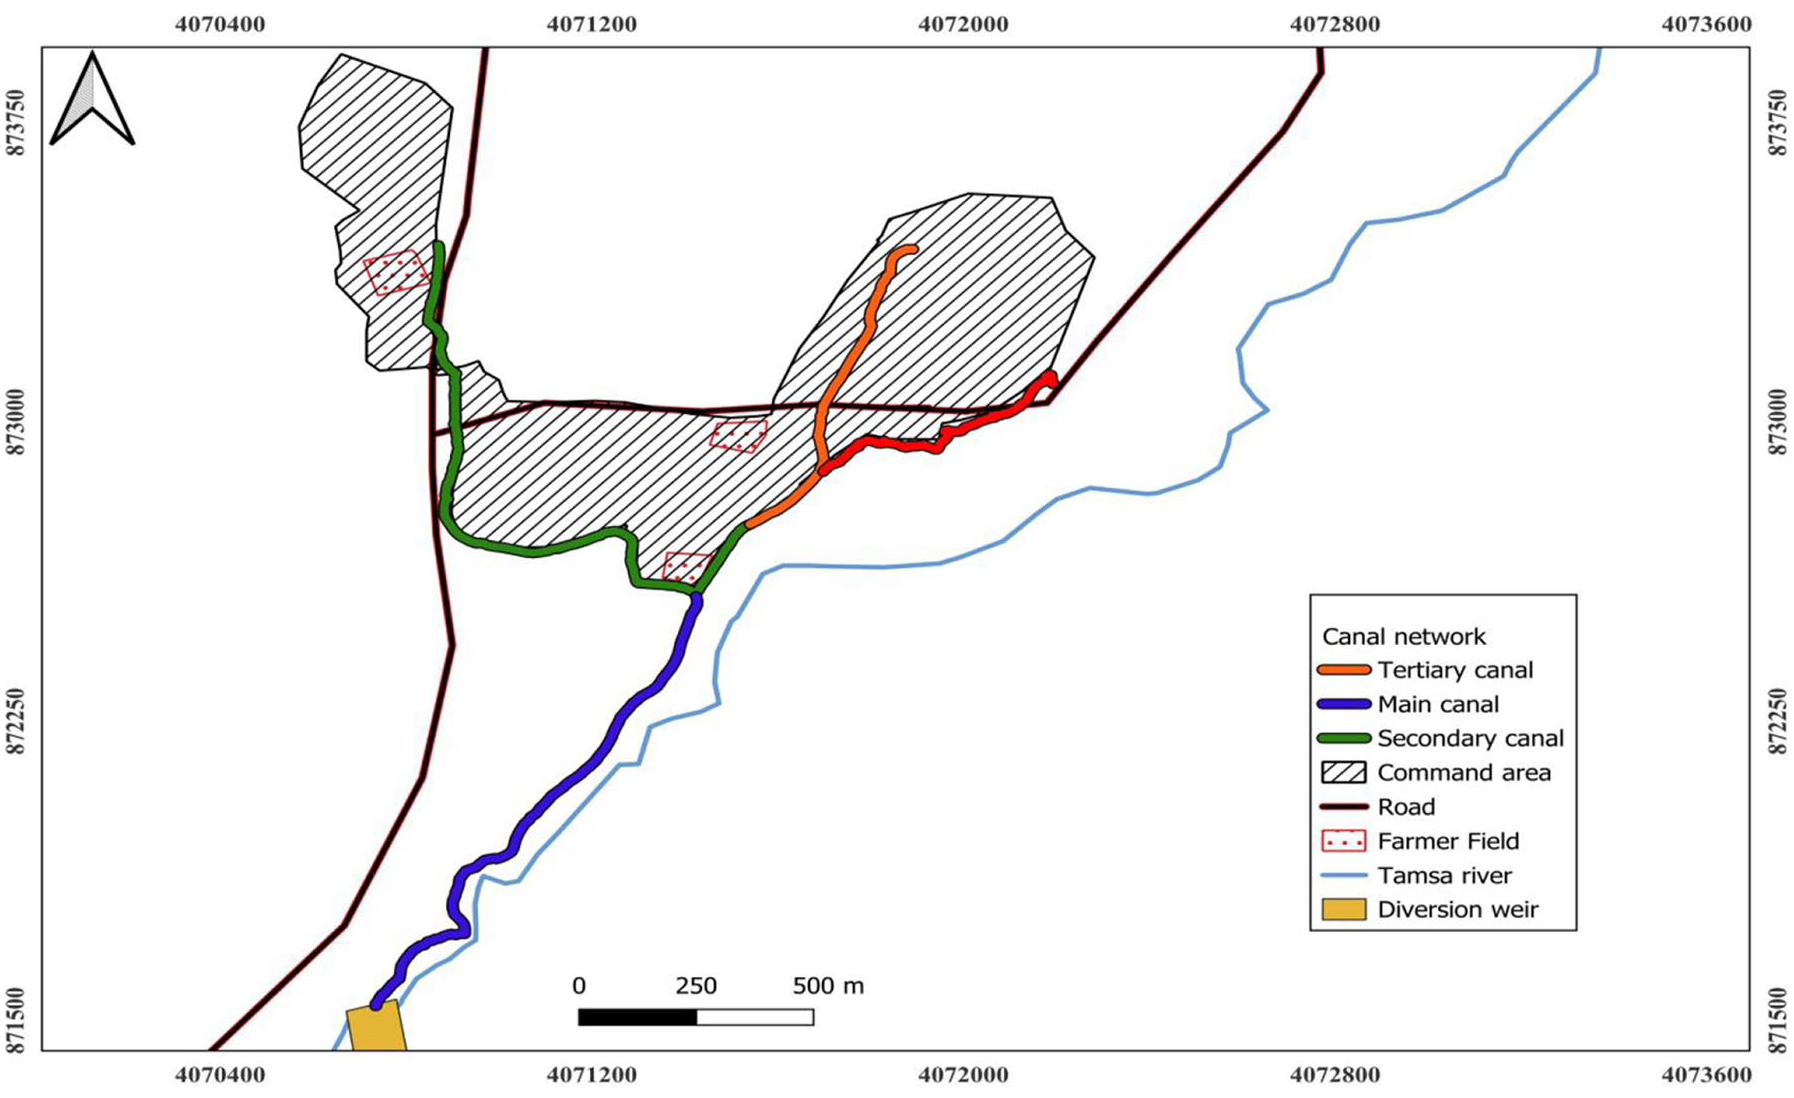
Geographical location of the study area.

Climatic condition of the study site.
Materials used to conduct the study
Important materials for conducting the study were global positioning system (GPS) to collect the current irrigated area and command area of the scheme; auger to collect the soil sample; current meter to measure water flow in the irrigation canal; tape meter to measure the dimensions of the structures (depth and width of the canal); Parshall flume to measure the applied water in the irrigation field; stop watch to measure the time it took for applying water to the field; pressure plate was used to determine the available soil water content at field capacity (FC) and permanent wilting point (PWP) and oven was used for drying the soil in the laboratory for determining the moisture content of the soil.
Methods of data collection
Data collection
Direct measurements, field observation, farmers response, Gomma District, and Jimma Zone Agriculture office expert interviews were collected. Primary data such as flow data, current irrigated area, crop type on the field, soil data, functional and non-functional structures, and the cross-section of the irrigation structure were collected through direct measurement, laboratory and fieldwork, field observation, stakeholder interviews, and questionnaires. Secondary data such as meteorological data, crop property data which are input for the CROPWAT software such as root length of the crop, depletion of the crop, crop coefficient, and crop patterns (Allen et al., 2016; Luo et al., 2022), were collected from National Meteorological Service Agency (NMSA) and relevant documents, studies, and other useful written materials. The command area and maintenance cost were collected from the design documents and interviewing the Agricultural Office experts.
Soil data
Soil samples were collected at the head, middle, and tail reaches of the scheme up to 90 cm at 30 cm intervals using auger. According to Tesfahunegn (2014), a method of soil sampling was random composite soil sampling techniques. Soil texture was estimated using a hydrometer test after drying in an oven at 105°C for 24 hr, and field capacity and permanent wilting point were evaluated by using a pressure plate apparatus. A 5-cm × 5-cm core sampler was utilized to extract soil samples from the head, middle, and tail reaches from five points each at three different depths also, to assess the soil’s bulk density. The bulk density of soil (ρb) at each soil depth was estimated as suggested by Al-Shammary et al. (2018). The soil samples collected from the three areas at different depths before and after irrigation were weighed and oven dried to determine the soil water content in the soil and other efficiencies.
Methods of determining crop water and irrigation water requirement of the crop
Delivering the intended quantity of water for the crops in the scheme after construction is the ultimate goal of small-scale irrigation schemes. Therefore, the CROPWAT 8.0 computer program was used to estimate the total water requirements of the crops grown in the irrigation schemes. The reference evapotranspiration (ETo) was calculated using the Food and Agricultural Organization (FAO, 1992) Penman-Monteith strategy, each crop’s Kc value was taken from FAO documents FAO (1992) and FAO (1998), and the USDA soil preservation strategy was used to determine the effective rainfall (Peff).

Where; Kc = Crop Coefficients
Peff = Effective Rainfall
ETo = Reference crop evaporation

Where: ET0 = is the reference evapotranspiration (mm/day), Δ = is the slope of the saturation vapor pressure curve (kPa/

Evaluation of the internal indicators
Flow measurement and conveyance efficiency (Ec)
To determine the conveyance efficiency of the canal, a current meter (electronic current meter) device was used at the head, middle, and tail reach of the canal. It is a widely used device for the measurement of flow velocity and, hence, the discharge in an open channel flow was determined. It consists of a small wheel with cups at the periphery or propeller blades rotated by the force of the flowing water, and a tail or fins to keep the instrument aligned in the direction of flow. The cup-type current meter has a vertical axis, and is a more rugged instrument, which can be handled by relatively unskilled technicians. Currently the cup type current meter was used to determine the conveyance efficiency of the canal.
To measure the conveyance efficiency, a regular cross-section of the canal was used and the cross-sectional area of the canal, that is, the depth and width of the canal was measured by a tape meter. The flow velocity was measured by the current meter. The water flow discharge was the product of cross-sectional area and the flow velocity. For the measurement a straight canal section and steady flow was considered. This procedure was used at the middle and tail of the scheme similarly. Since there was no secondary and tertiary canal, it was not measured. Finally, the canal conveyance efficiency was determined by considering the flow at two points, the first flow section was the inflow and the other section was the out flow and it is calculated using Equation 4 (Michael, 2008).

Where Q = Discharge (m3/s),
A = Cross-sectional area (m2), and
V = Flow velocity (m/s)

Where
The losses in the conveyance system was computed as;

Where Lc = Conveyance loss (m3/s)
Application efficiency (Ea)
Soil samples were collected from the three sites of the scheme namely from the top, middle, and tail of the scheme from the selected farmers to determine the soil physical and chemical properties such as soil moisture, texture, soil field capacity and permanent wilting point. It was collected based on the root depth of the selected test crop (tomato at the head, wheat at the middle, and tail reach) for assessment before and after irrigation. From each site of the scheme composite soil samples were collected from five representative points, two sample from the first one-third, and the last one-third and one from the second one-third area of the farm at three depths at an interval of 30 cm from 0 up to 90 cm using soil auger. The bulk density, the soil water content, and the total available water content which were the basic to determine the application efficiency were determined by using the following equation (Equations 7–9).


Where: BD = is soil bulk-density (g/cm3), Ws = is mass of dry soil (g), Vc = is volume of soil in the core (cm3), TAW = is volumetric total available water in the root zone (mm/m), Rd = root depth (m), θFC = volumetric moisture content at field capacity (m3/m3), θV = volumetric moisture content in (%), and θPWP = volumetric moisture content at permanent wilting point (m3/m3).
The application efficiency (Ea) was determined by measuring the depth of water applied to each field on each specific irrigation field to the selected crop. Before irrigation, soil sample was collected and after that irrigation was given to the crop and, 2 days after irrigation, the depth of water stored in the root zone was determined as the difference between the before and after irrigation moisture contents of the soil. To do this a total of 30 soil samples, 15 samples before and 15 samples after irrigation were collected at a 30 cm depth interval up to 90 cm from the top, middle, and tail reach, respectively. The application efficiency was determined by using Equation 10.


Where Q = Discharge of irrigation water applied to the field (L/s), A = Irrigated land area with in the applied time (m2), t = application time (s), and d = depth of soil (mm).
Storage efficiency (Es)
To determine the water stored in the soil root zone of each field, soil samples were collected from three representative sites of the selected farm at the top, middle, and tail reach. Similarly, five samples were collected, two sample from the first one-third and the last one-third and one from the second one-third area of the farm at a depth of 0 to 30, 30 to 60, and 60 to 90 cm depth based on the root depth of the crop before and after each irrigation event. The moisture content was determined using the gravimetric method.
The storage efficiency is the ratio of the quantity of water stored in the root zone to quantity water needed in the root zone of the crop. It was calculated by using Equation 13.
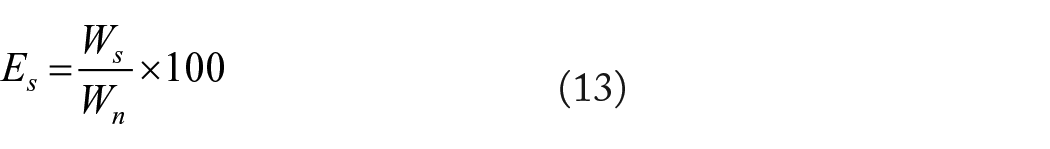
Where
The water needed in the root zone prior to irrigation was computed using Equation 14 (Michael, 2008).
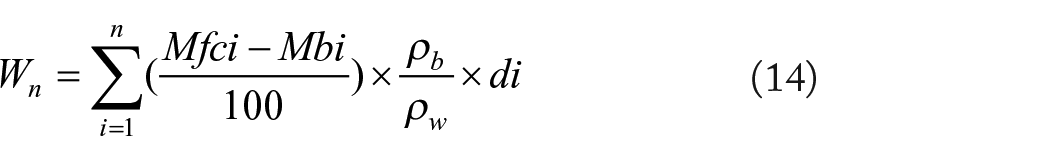
Where:
Water distribution uniformity (DU)
To determine the water stored in the soil root zone, each field was divided into three parts at the head, middle, and tail reach of the field. Totally, from five places at a depth of the 0 to 30, 30 to 60, and 60 to 90 cm soil sample was collected before and after each irrigation event. The distribution uniformity of the water applied to the field was determined by using Equation 21. After soil moisture contents of the soil samples was determined gravimetrically, at the selected points, the depth of stored water at particular soil layer (X (0–30), X (30–60), and X (60–90)) was calculated using Equation 15:

Where: X = soil moisture content stored at a respective depth interval (mm),


Finally, the distribution uniformity was determined by

Where: Du = water distribution uniformity (%),
Deep percolation ratio (DPR)
During the application of the intended amount of water at the field, the water could be delivered in excess, it could be due to the technical problem and in this case, it may cause a loss of water and a run off and could be stored as a deep percolation. This could affect the performance of the scheme. It was calculated using Equation 22 below (Abo et al., 2024; Feyen & Zerihun, 1999; Markos et al., 2019).

Where: DPR = Deep percolation ratio (%), Ea = application efficiency (%), and RR = runoff ratio (%).
However, since when the farmers irrigate the field, they use a tied furrow and due to this there was no runoff loss. Finally, the overall scheme efficiency was calculated as the product of conveyance and application efficiency FAO (2002):

Where;
Determination of the external performance indicators
To determine the performance of the scheme Nine external indicators were used as illustrated by International Water Management Institute (Molden et al., 1998).
Agricultural output indicators
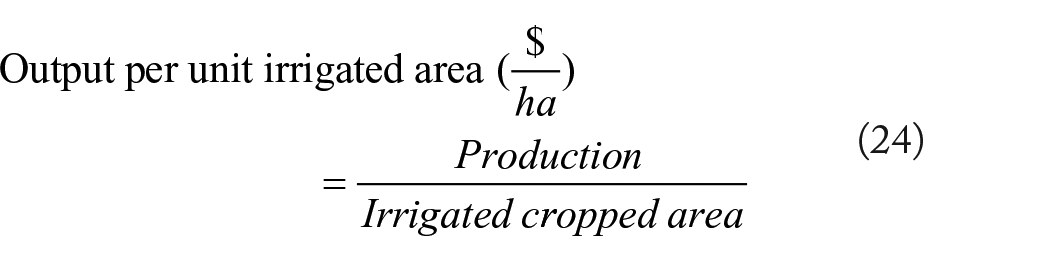
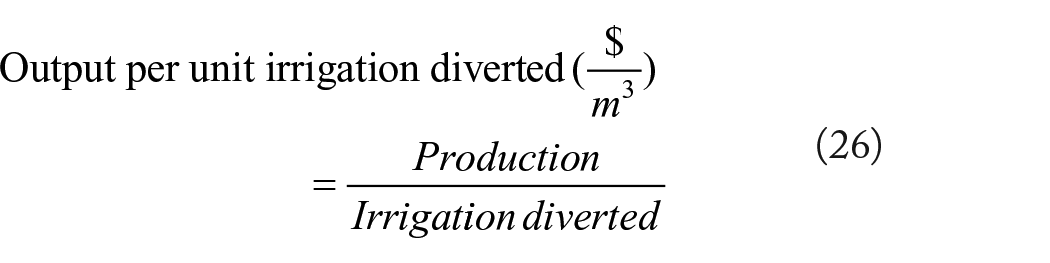
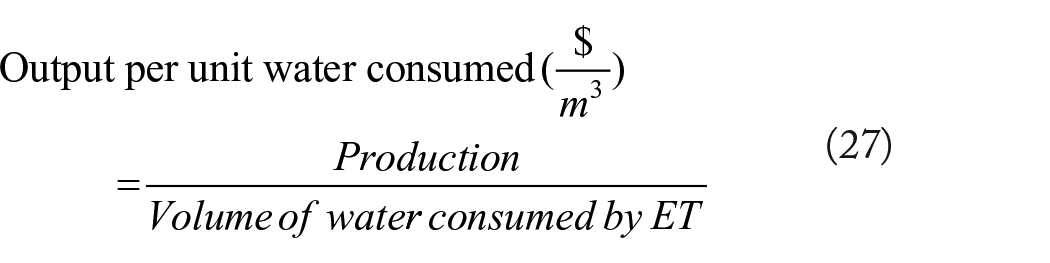
The yield during the cropping season, the market price that farmers earned, and other input costs for seed, fertilizer, pesticide, and labor were used to calculate agricultural output indicators like output per irrigated area, output per unit command area, output per irrigation water diverted, and output per unit water consumed. Using the global positioning system (GPS), the command area the irrigable cropped area was gathered from the field. The amount of diverted water at intake of the schemes were also measured at the field by Parshall flume. The following equations were used to compute the four basic agricultural output indicators (Molden et al., 1998).

Water supply indicators
After supplying the crop water demand for the crop during the growth season, the water supply performance indicators such as relative irrigation and water supply were evaluated. Irrigation supply is the volume of irrigation water delivered from the water source, measured at the headworks of the schemes. Relative water supply is the sum of delivered irrigation water and effective rainfall. The crop water requirement was calculated for each month using the following equation for the crop currently available on the field.
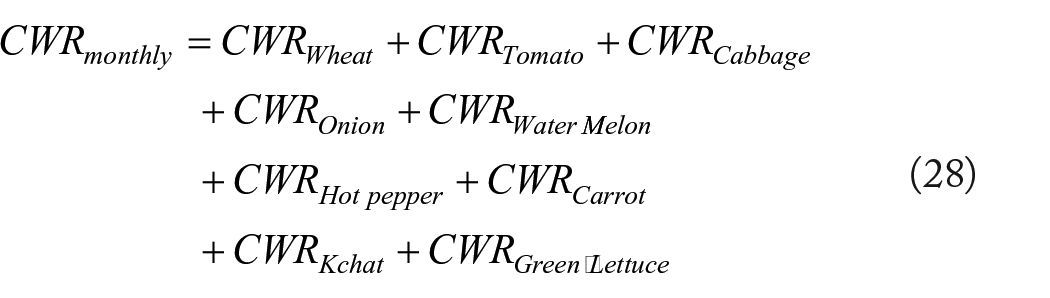

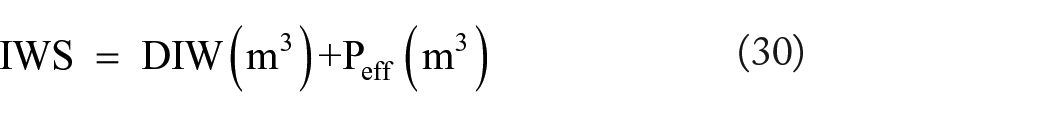
After determining the crop water requirement, effective rainfall, irrigation water demand, and water supply both the relative water supply and irrigation supply were determined using Equations 31 and 32 as shown below.
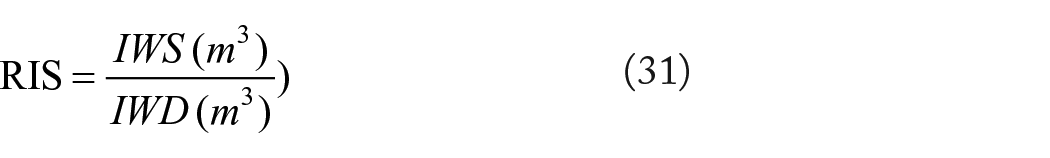

Where: RWS = Relative water supply (m3), IWS = Irrigation water supply (m3), IWD = Irrigation water demand (m3), CWR = Crop water requirement (m3).
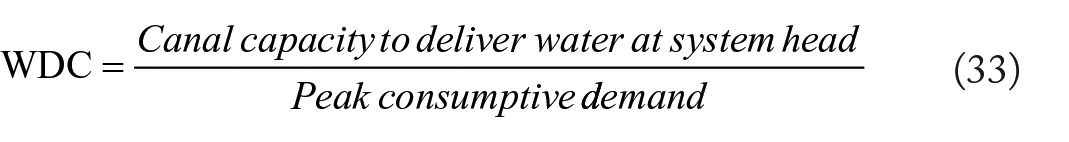
Water delivery capacity indicator (WDC)
The water delivery capacity was determined from the measurement taken from the off taking canal using the canal cross sectional area, flow velocity in the canal and free board of the constructed structure. The maximum (peak) monthly crop water demand was computed by CROPWAT 8.0 and calculated by Bos et al. (1994) as shown below in Equation 33.
Physical indicators
Physical performance indicators were evaluated based on the irrigation ratio and sustainability of irrigated area as discussed by Molden et al. (1998). Both the irrigation ratio (IR) and sustainability of the irrigated area (SIA) were used to evaluate the physical indicators.

Where: Irrigated crop area (ha) is the portion of the actual irrigated land in any given irrigation season and command area (ha) is the potential scheme command area.

Where: Current irrigable area is the area currently irrigated (ha), and initially irrigated area is the designed irrigable area (ha).
Economic and financial indicators
Even though the constructed scheme could be advantageous in granting the farmers possibility to produce in a dry period and sustainable production, it has to be evaluated economically and financially. To do this both the gross return on investment, the financial self-sufficiency and profitability in terms of area-based profitability per unit area and per unit water used were evaluated.
Gross return on investment
To evaluate the gross return on investment, an assessment was made of how cost over runs are financed and costs under-runs deployed. In the scheme the main indicators for the financial evaluations were input costs such as seed, fertilizer, and chemical cost for herbicides, and costs for hiring the security guard. The gross return on investment was evaluated in Equation 36.
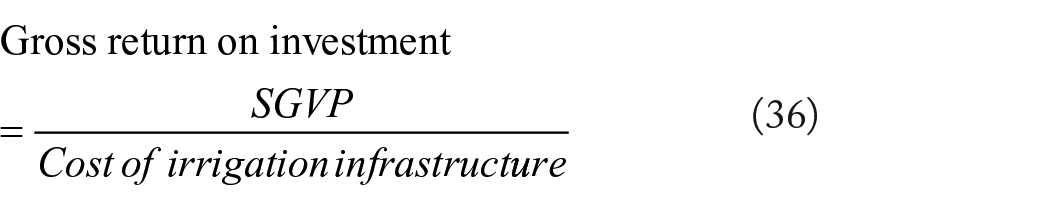

Where: SGVP = Standard Gross Value of Production
Financial self-sufficiency
It was evaluated by considering the revenue they get from the field and the expected construction material cost required for maintenance and the cost required for labor force and masonry expert.

Where: Revenue from irrigation, is the revenue generated from fees, total operation (O), and maintenance (M) expenditures are the amount expended locally through O&M plus outside subsidies from the government.
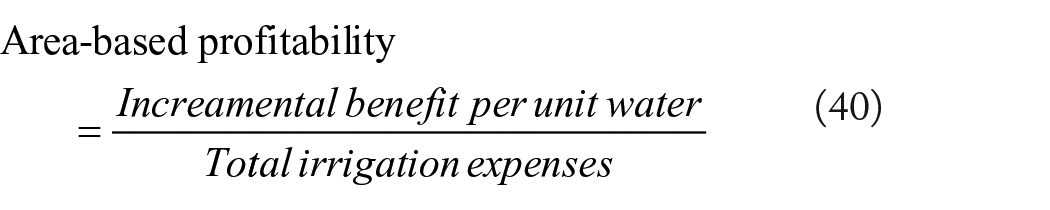
Profitability
Both the profitability of the area used and water applied per hectare of land were evaluated to assess the profitability of the scheme to determine the profitability of the scheme, to enhance the production and productivity.

Results and Discussion
Soil physicochemical properties
One of the factors that affect the performance of irrigation scheme and the effectiveness of irrigation management is the soils textural classification since it affects the soil water holding capacity and also the irrigation scheduling. The soil physicochemical data reveals that the dominant textural class of the soil were sandy clay loam (SCL; Table 1). Similarly, research results conducted by Dessalew and Dar (2016) showed that the soil textural classes critically affect water-holding capacity and further irrigation scheduling. The average total available water (TAW) of the soil in the current finding was in the range of 117 up 146 mm/m (Table 1). The soil texture at each horizon and the water that was released from the headwork could be the factor for the variation of the total available water in each part of the scheme. According to the finding of Agmasie et al. (2022), the degree of variability of total available water (TAW) could be attributed to variability in their soil textural classes. The TAW soil water obtained in the current finding is categorized under good soil moisture condition as suggested by Kassa and Ayana (2017).
Physicochemical Properties of Soil of The Study Site.

It has an average bulk density of 1.17 up to 1.38 g/cm3. A bulk density between 1.1 and 1.9 g/cm3 were normal and recommended for most irrigable soil (Greaves, 2007). Similarly, the result of this study revealed that, the bulk density was in the recommended range implying that there would be no extreme effect of the recorded bulk density on the water availability for plants. Dananto and Alemu (2014), justified that soils having moderate moisture-holding capacity are better for high irrigation performance. In this study, the gravimetric water content also indicated average condition, implying the condition of the soil was good at holding appropriate moisture for crop development.
Water and irrigation requirement of the crop in the scheme
To evaluate both the internal and external performance of the scheme, determining the water requirement and irrigation water supplied to meet the water demand was the basic. In the cropping season of 2016 E.C, the cultivated crops on the scheme were wheat, tomato, cabbage, potato, water melon, hot paper, carrot, kchat, and green lettuce. The water requirement of each crop determined by the crop wat 8.0 in the cropping season were 382 mm for wheat, 556 mm for tomato, 549 mm for cabbage, 485 mm for onion, 399 mm for water melon, 360 mm for hot pepper, 279 mm for carrot, 588 mm for kchat, and 279 mm for green lettuce. In the cropping season the net irrigation requirements were 275 mm for wheat, 396 mm for tomato, 386 mm for cabbage, 360 mm for onion, 292 mm for water melon, 225 mm for hot pepper, 187 mm for carrot, 229 mm for kchat, and 182 mm for green lettuce (Table 2). Similarly, Dirirsa et al. (2017) and Abebe and Kebede (2020) obtained approximately similar water requirement for tomato. Amdneh and Gebul (2023) obtained similar CWR for wheat. Beshir (2017) obtained for cabbage. Tamene and Haile (2021) obtained CWR of onion in the same range. Enyew et al. (2020) suggested the same range of CWR of water melon. Wale and Girmay (2019) and Gelu et al. (2024) obtained CWR of hot pepper in the same range. Ashine et al. (2024) obtained CWR of carrot in the same range. Atroosh and Al-Moayad (2012) suggested CWR of Kchat similar to the current finding and Acar (2020) suggested a similar CWR of green lettuce.
Crop Water (CWR) and Net Irrigation Requirement (NIR) of the Crop.

In the cropping season, the total area of 8.92 ha of land was for wheat, 1.36 ha was for tomato, 0.76 ha was under cabbage, 0.51 ha was under onion, 0.09 ha was under water melon, 0.15 ha was under hot pepper, 0.61 ha was under carrot, 5.11 ha was under kchat, and 0.36 ha was under green lettuce. The amount of irrigation supplied for the crop in the cropping season in the scheme were 72% for wheat, 71% for tomato, 70% for cabbage, 50% for onion, 73% for water melon, 63% for hot pepper, 67% for carrot, 39% for kchat, and 65% for green lettuce. According to the finding on average the irrigation requirement could be above 60% based on the crop type, variety, and agroecology of the site. This study reveals that it needs supplementary up to full irrigation based on the crop type and specific planting date. Based on the area coverage of the crops, the net irrigation requirement of the crops was 50,803
Performance of the internal indicators
Conveyance efficiency (Ec)
The conveyance efficiency of the main canal reveals that, at the head, middle, and tail reach of the scheme, the efficiency was 86.4%, 79.2%, and 73.6%, respectively. The average conveyance efficiency of the main canal was 79.6% (Table 3). The average conveyance efficiency of the secondary and tertiary canals were 85.6% and 84.7%, respectively. The average conveyance efficiency of the canal was 56.83%. Food and Agriculture Organization FAO (2001), suggested that the conveyance efficiency of lined canal has to be 95% and from this the conveyance efficiency of the canal was poor. During the field investigation it was observed that, the water which was diverted from the head work was stagnant at some points in the canal and it takes a long duration of time to reach to the irrigation field. This low conveyance problem could be due to the design or technical problem during the construction of the canal.
Conveyance Efficiency of the Scheme at the Head, Middle, and Tail Reach.

The average canal loss per meter was 2×10⁻⁴, 6.1×10⁻⁵, and 1×10⁻⁴ m3/s at the head, middle, and tail reach of the main canal, respectively (Table 3). The average loss of the secondary and tertiary canals was 8.4×10⁻⁵ and 1.2×10⁻⁵ m3/s/m, respectively. The average canal loss was 9.2×10⁻⁵ m3/s/m. From this finding, it is clear that there was a conveyance efficiency variation with in the scheme at the head, middle, and tail reach. This could be due to a slope variation and there was unlined canal at the tail reach which has a relatively low conveyance of water.
Application efficiency (Ea)
The study revealed that the average application efficiency of the scheme was 59.2%, 33.42%, and 29.96% at the head, middle, and tail reach of the selected farmers field, respectively. The average application efficiency of the scheme was 40.87% (Table 4). The application efficiency shows that it is in a decreasing trend, showing that the water released from the head work was decreasing. Additionally, the slope of the land is not suitable for the application using furrow irrigation. The application efficiency was poor and below the recommended application efficiency of furrow irrigation. According to the soil conservation science the attainable application efficiency ranges from 55% to 70% (FAO, 1989). Similarly, FAO (2002) reports the application efficiency of furrow irrigation in the range of 50% to 70%. Nature of the soil, crop specific management of farmers at the field, indigenous knowledge of the farmers and farmers commitment for applying the intended quantity of water were factors that cause the reduction of the application efficiency.
Application Efficiency.

Storage efficiency (
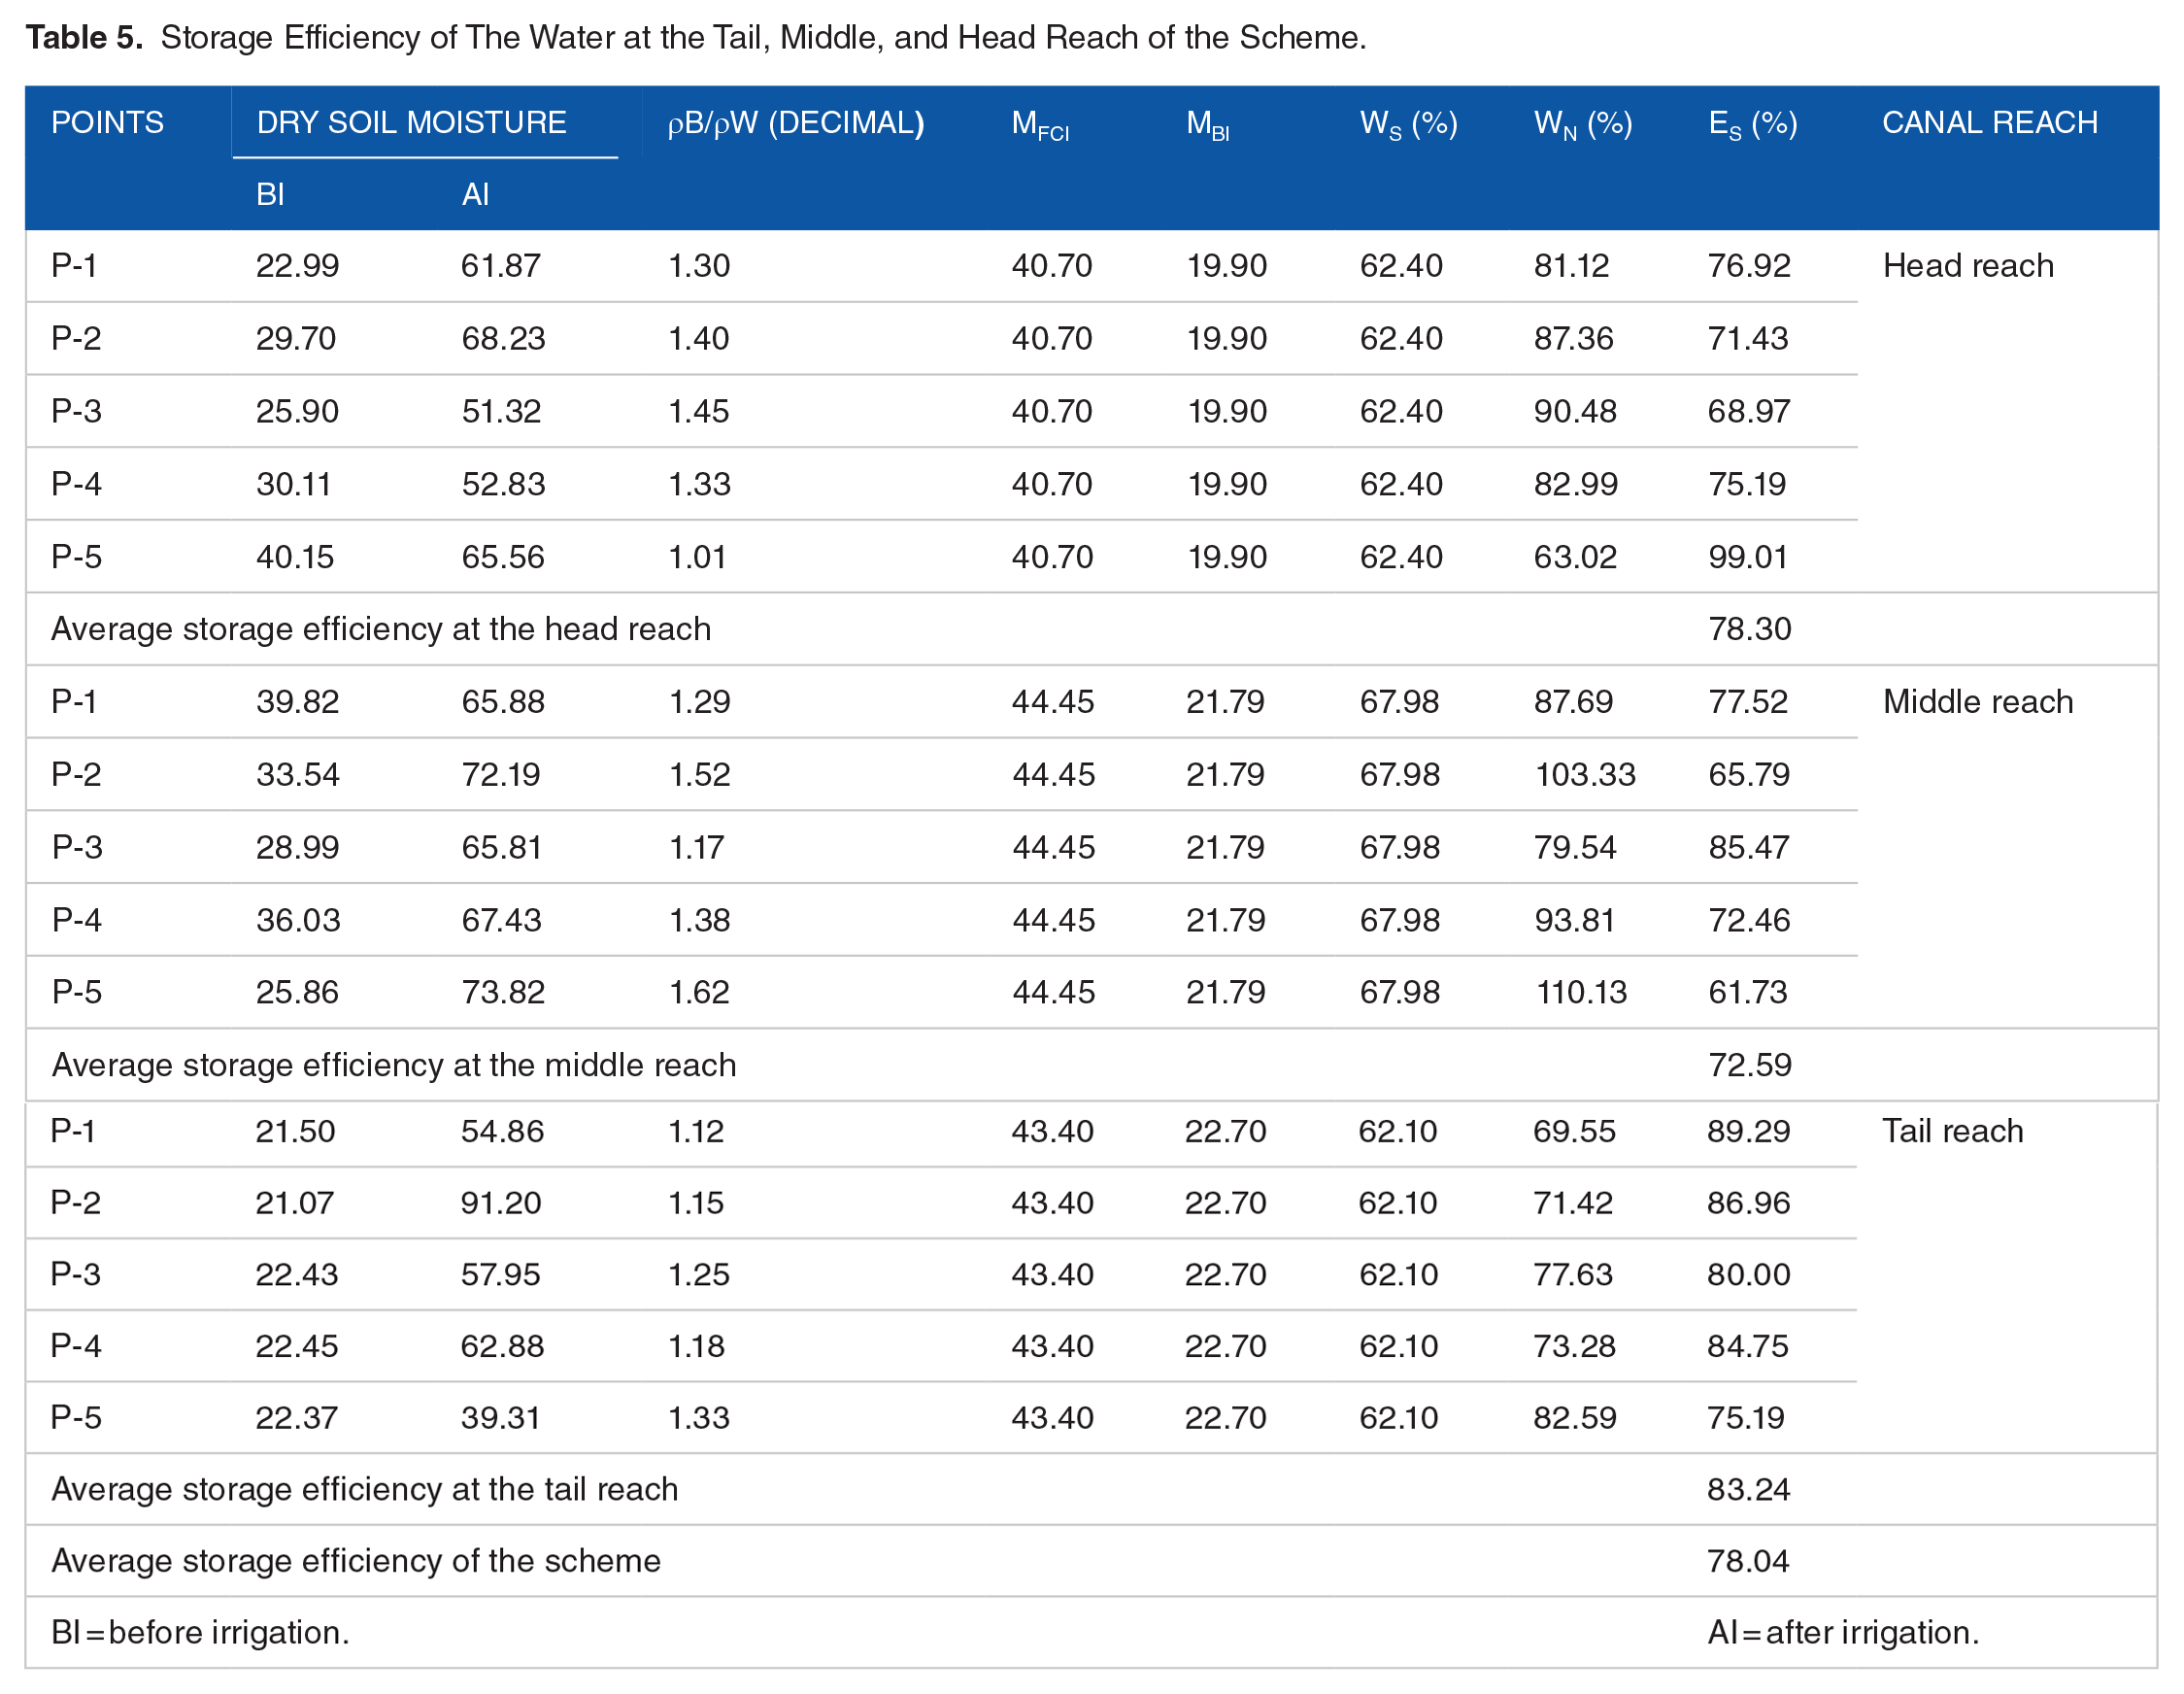
The storage efficiency of the scheme shows that, an average storage efficiency of 78.3%, 72.6%, and 83.2% at the head, middle, and tail reach, respectively. The average storage efficiency of the scheme was 78.04% (Table 5). It reveals that the storage efficiency of the scheme was relatively poor. The slope of the land was the major reason for the low performance of the storage efficiency. This may lead the crops under the water stress condition. Even though the storage efficiency was lower, there could be a positive attitude for the effective management of the water gradually. The current finding was in an agreement with Markos et al. (2019), who obtained a storage efficiency between 71% and 86% while evaluating the irrigation performance of Sanko Small Scale Irrigation Scheme and Tesfaye and Jemal (2020), while assessing the performance of storage efficiency at Wosha irrigation scheme which is in the range of 83% to 92.5%. The storage efficiency of the scheme reveals that it was performing well, since the minimum recommended storage efficiency of furrow irrigation was 63% (Levine, 1982; Raghuwanshi & Wallender, 1998).
Storage Efficiency of The Water at the Tail, Middle, and Head Reach of the Scheme.
Deep percolation ratio (DPR)
The water applied to the field could be lost in the form of deep percolation and as a form of runoff. How ever some farmers control the run off by practicing tied furrow system. Practically, throughout the Temsa scheme the farmers practice tied furrow system and hence they control the runoff. Hence, the water was lost or stored in the form of deep percolation below the root zone of the crop. The study result reveals that, the average deep percolation ratio was 42.83%, 66.86%, and 69.43% at the head reach, at the middle reach, and tail reach, respectively and the average deep percolation ratio of the scheme was 59.70% (Table 6). This result shows that there was a loss of water and the water was lost due to deep percolation, evapotranspiration and other technical application problems and also indicates over irrigation. According to FAO (1989) the water loss through deep percolation ratio could be more than 40%.
Deep Percolation Ratio at the Head, Middle, and Tail Reach of The Scheme.

Distribution uniformity (DU)
The average distribution uniformity of the scheme was 93.33% and it was 84.51%, 97.39%, and 98.09% at the head, middle, and tail reach of the scheme, respectively (Table 7). This distribution uniformity signifies that, the water was distributed uniformly throughout the scheme. This was because the land was well prepared, the furrows were also made properly and at a relatively moderate length (less than 10 m). The distribution uniformity at the head was relatively lower, this could be because of the nature of the crops. In some vegetable crops (tomato in this case) since there leaf may cover the surface of the soil, the water could not be freely distributed and reach to all parts of the field. Hence it has an impact on the water distribution and its uniformity.
Distribution Uniformity at the Head, Middle, and Tail Reach of The Scheme.
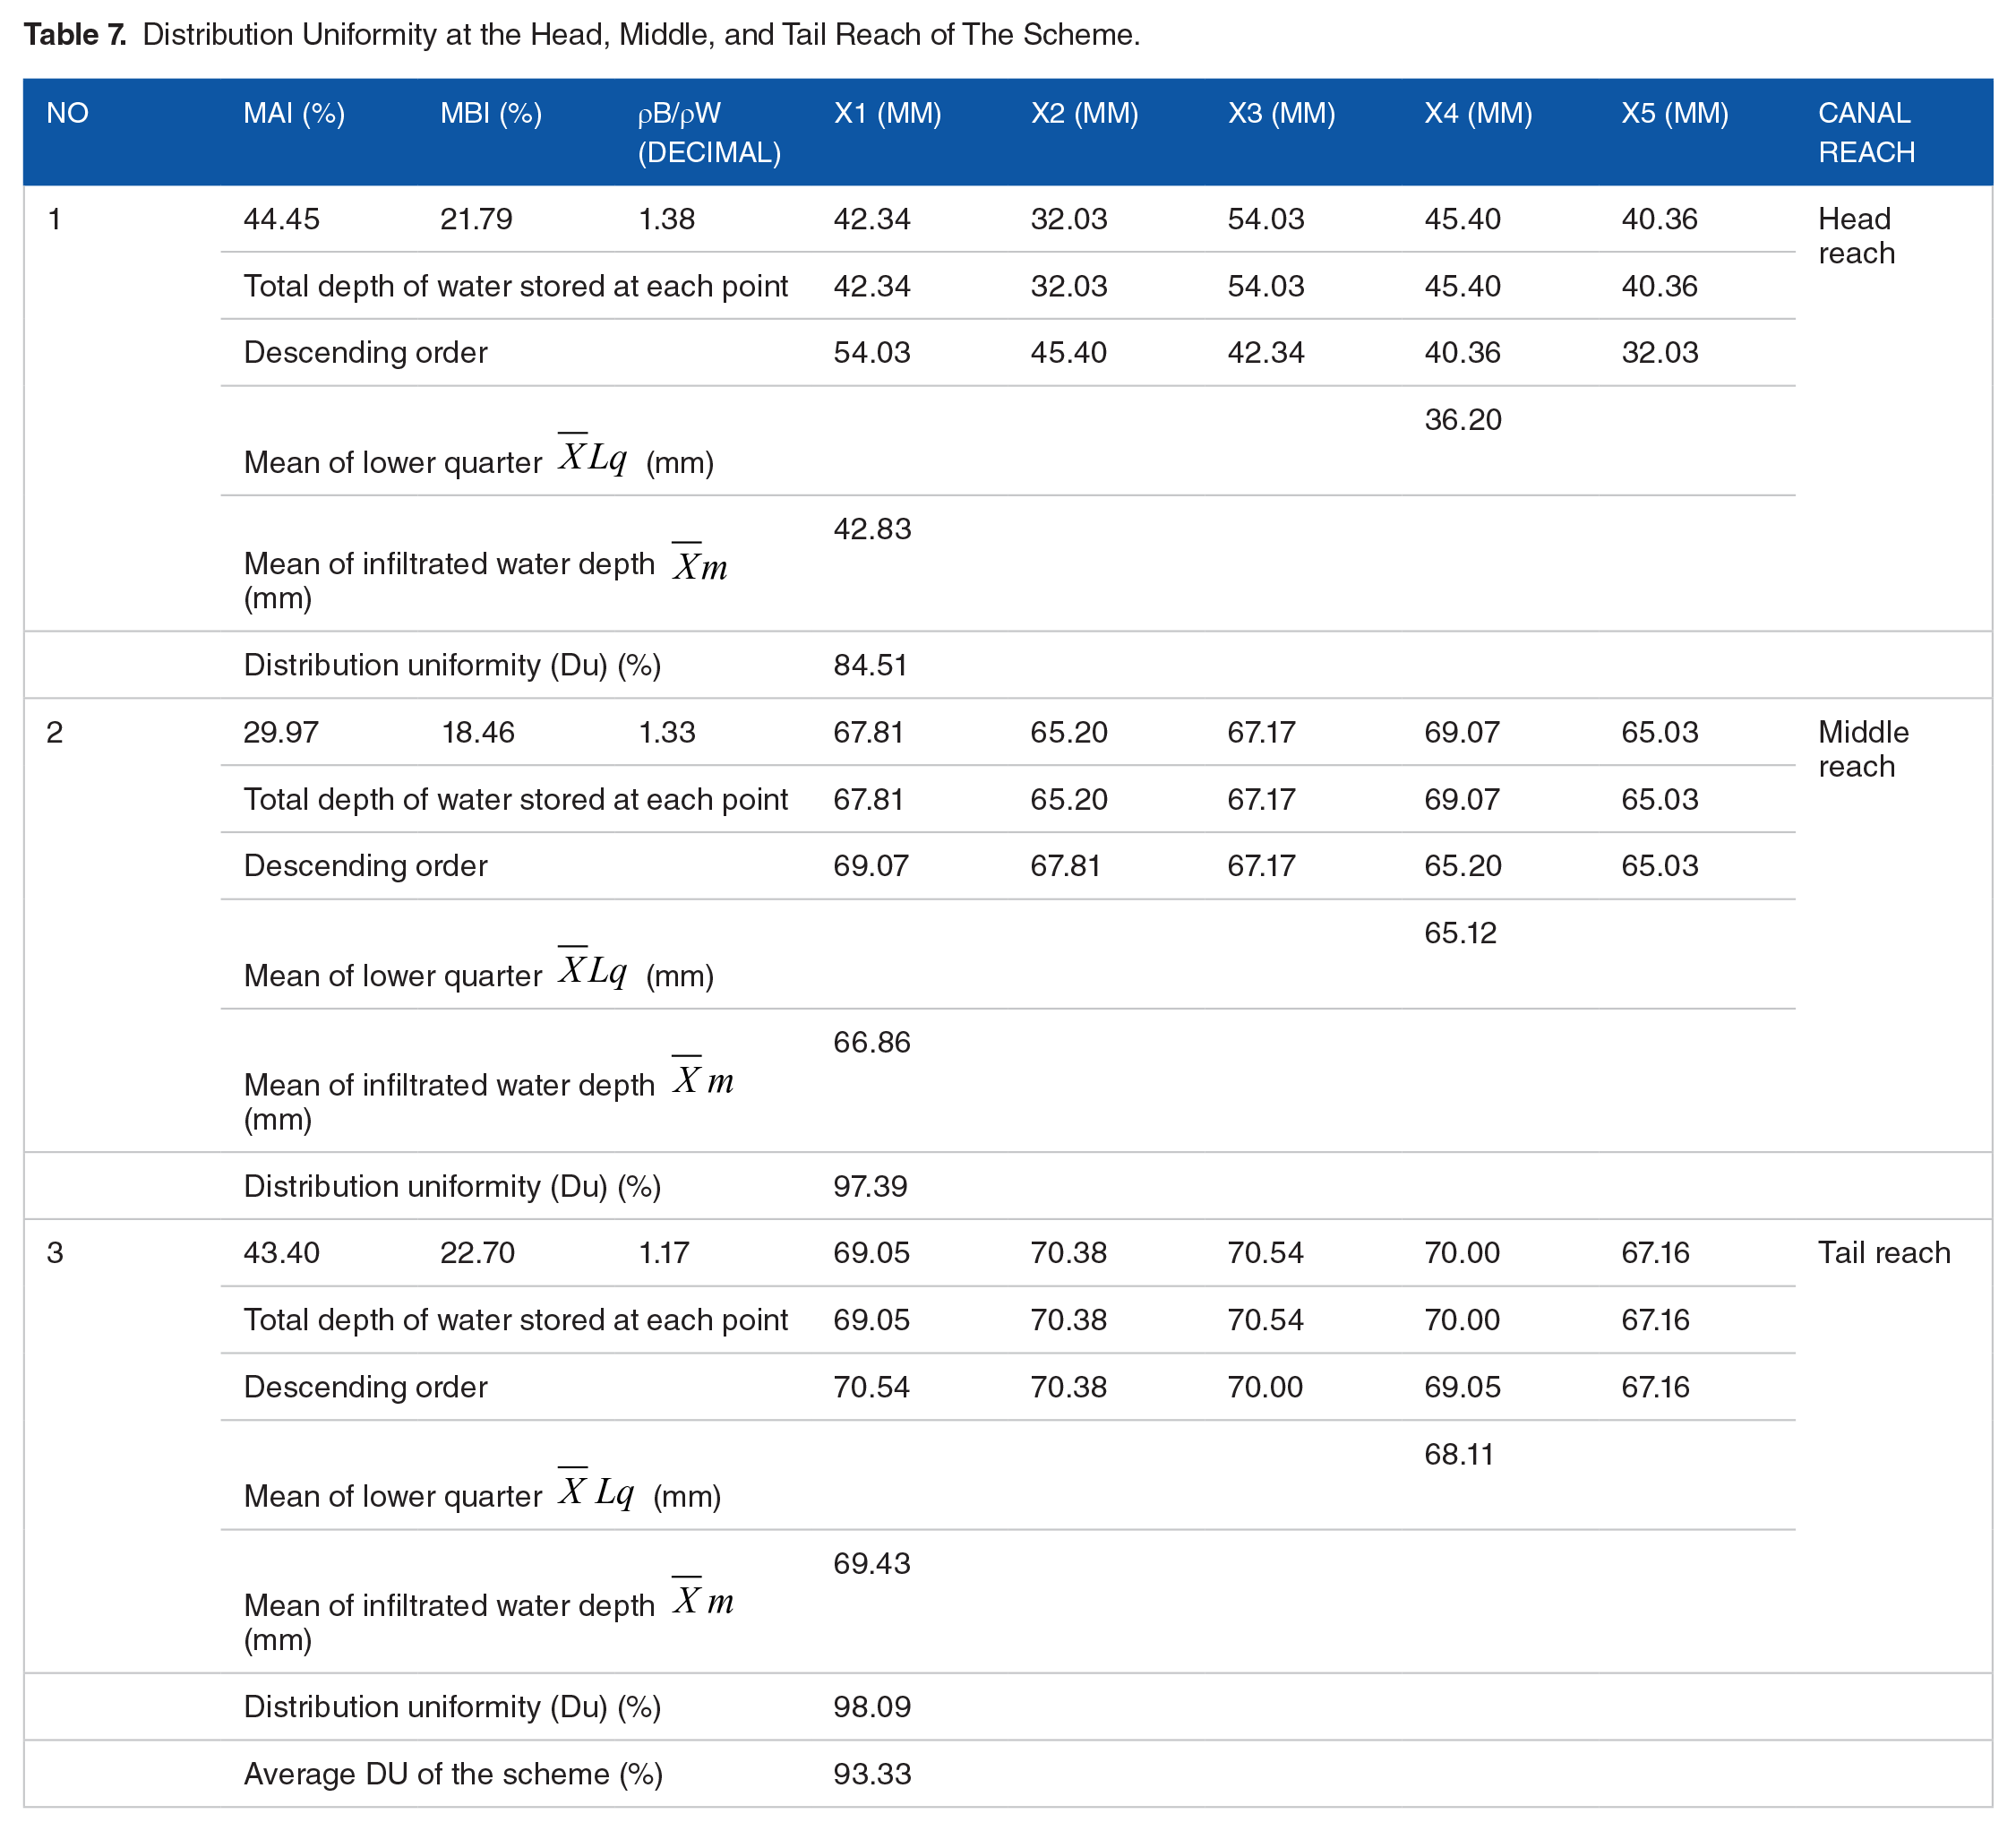
A distribution uniformity of 65% is considered as sufficient and if it is less than 30% the distribution was poor (Eisenhauer, 1997; FAO, 1992). According to San Joaquin Valley Drainage Implementation Program (1999), an effective distribution uniformity for furrow irrigation has to be between 80% up to 90%. Similarly, Dessalew and Dar (2016) obtained a distribution uniformity of above 90% while evaluating the irrigation performance of Bedene Alemetena irrigation scheme. There are also other scholars that obtained the distribution uniformity of a scheme above 90% which will create a positive attitude for the irrigation scheme sustainability (Tesfaye & Jemal, 2020). Based on the above justification it could be justified that the farmers were distributing the water to the field uniformly, even though there was a poor application efficiency.
Over all scheme efficiency
The poor application efficiency and low conveyance efficiency of the canal affected the overall scheme performance of the scheme. The result reveals that the overall efficiency of the scheme was 23.19% (Table 8). There was a courage that this application efficiency could be improved by training the farmers. Tesfaye and Jemal (2020) also obtained an overall scheme performance efficiency below 30% while evaluating the Wosha and Dodicha irrigation scheme, respectively. Similarly, Abo et al. (2024) obtained an overall scheme efficiency below 30% while evaluating the Bilate irrigation scheme. The overall irrigation efficiency values between 50% and 60% are good, 40% are reasonable, while 20% to 30% are poor (Rai et al., 2017). Therefore, the overall scheme performance of Temsa small scale irrigation scheme in the cropping season of 2016 was poor performance.
Over All Scheme Efficiency.

Performance of external indicators
Agricultural output indicators
The four basic agricultural output indicators of the scheme such as output per unit irrigated area, output per unit command area, output per unit irrigation diverted and output per unit water consumed gave 4,738.58(US$/ha), 1,176.08 (US$/ha), 1.66 (US$/m3), and 0.89 (US$/m3), respectively. The output per unit command area of a small-scale irrigation scheme was recommended between 1,223 and 9,436 US$/ha) for different irrigation schemes (Degirmenci et al., 2003). Accordingly, the agricultural output of 1,176.08 US$/ha was not in the recommended range as suggested by Degirmenci et al. (2003). This reveals that, the command area was not beneficial and the revenue farmers obtain in the cropping season was low. It could be improved through irrigating the whole or increasing the command area.
The output obtained per unit irrigated area from the scheme in the cropping season of 2016 E.C was 4,738.58 US$/ha. It is one of the physical performance indicators which shows the revenue gained by applying a cubic meter of water through irrigation. The revenue obtained from irrigated area was relatively higher than that of the command area. This shows that irrigation is more advantageous in the scheme and if applied effectively the economic benefit could be obtained. Similarly, Degirmenci et al. (2003), reported that the output per unit irrigated area among various irrigation schemes was in the range of 308 to 5,771 US$/ha. Accordingly, the output obtained per unit irrigated area from the Temsa irrigation scheme was in the recommended range. The output per unit irrigation diverted was 1.16 US$/m3. This production shows that there was a more benefit from the irrigated scheme. Similarly, Abo et al. (2024) obtained approximately similar value of benefit at Bilate small scale irrigation scheme. The value of output per unit of irrigation could be between 0.03 and 2.21 US$/m3 (Cakmak et al., 2004). Thus, the result of output per irrigation delivered was in the recommended range of Cakmak et al. (2004) for the scheme.
The output per unit water consumed was 0.89 US$/m3 for Temsa small scale irrigation scheme. Molden et al. (1998), suggested that the output per unit of water consumed for irrigation schemes could be in the range of 0.03 to 0.91 US$/m3. Accordingly, the result of output per water consumed was in the recommended range of Molden et al. (1998). This indicates that the water use efficiency of the scheme was good and farmers are managing effectively based on the standard given.
Water supply indictors
The water supply indicators namely, relative water supply and relative irrigation supply were considered as one of the optimal criteria for the measurement of the adequacy of water for the crop. There values are evaluated as greater than one or less than one, showing over supply of water and under supply of water, respectively (Ayana & Awulachew, 2008). The relative irrigation supply (RIS) of Temsa scheme was 2.37 m3 (Table 9). Similarly, Wakena et al. (2023) obtained a relative irrigation supply of above 2.0 while evaluating the performance of the Degero and Gura Daso SSI schemes which were 2.28 and 2.06, respectively. This show that there was an adequate supply of irrigation to meet the crop water demand and even there was an excess supply of water to the field. This could be due to poor knowledge of agronomic practice, irrigation scheduling problem and unpredictable rainfall.
Performance Evaluation of The Water Supply Indicators (WSI) At Tamsa Scheme.

As shown in Table 9, the relative water supply (RWS) of the scheme was 1.39, showing that there was an excess delivery of water to the field and to the crop. Molden et al. (1998) reported that the relative water supply value of one is better than the higher or lower values for any irrigation scheme. Similarly, Ayana and Awulachew (2008) obtained water supply ratio ranging from 1.46 to 2.05 at Wonji irrigation scheme, indicating that the amount of water supplied at scheme level exceeded the estimated crop water requirement. This value could be improved through practicing agronomic practice, irrigation scheduling, maintaining the intake of the off taking canals at some points.
Water delivery capacity indicator (WDC)
As shown in Table 10, the water delivery capacity of the canal at Tamsa irrigation scheme was 83%. This value is less than the expected capacity of the canal for delivering the intended quantity of water to the field. Water leakage due to the breakage of the structure lowered the delivering capacity of the canal. Due to this the water which was released from the head work take a long time to reach to the field.
Performance of the Water Delivery Capacity Indicator.

Physical indicators
Physical indicators are related with the changing or losing irrigated land in the command area by different reasons. It could be determined by studying the irrigation ratio, and the sustainability of the scheme by comparing the initially and currently irrigated area. In the current study the irrigation ratio and the sustainability of the irrigated area were 0.25 and 0.43, respectively (Table 11). The irrigation ratio was low due to the designing problem. When the command area was studied it was wide and up to 72 ha, but most of the lands were under the perennial crops such as coffee and other trees. How ever the farmers are not using the water for irrigating coffee because of the sloppy nature of their land and their previous experience at some areas of the scheme. Similarly, the sustainability of the scheme is also facing a challenge not because of the farmers interest but because of the suitability of the land for conventional irrigation. In addition to this since in the cropping year of 2016E.C, there was non-uniform distribution of rainfall especially at the beginning of the season, farmers didn’t give a concern for irrigation and due to this their farm was left without farming.
Performance Evaluation of the Physical Indicators.

Economic and financial indicators
For evaluating the economic and the financial indicators, gross return on investment, financial self-sufficiency, area, and water-based profitability were used for producing the obtained yield from the irrigation scheme as discussed below.
Gross return on investment
The Gross return on investment indicator considers the production and the total cost of infrastructure for the irrigation scheme. The total construction cost for the head work, canal, and ancillary structure was approximately 8 million Ethiopian birr (ETB). The standard gross value of production (SGVP) was determined on the currently irrigable area, crop type, and market price of the crop at the local market the farmers could get. The SGVP at the current cropping season was 3,575,250.0 Ethiopian birr. Considering the above estimations, at the current the gross return on investment was 48%, showing that the revenue was low. Similarly, Behailu et al. (2004) reported a gross return between 18.25% and 42.1% while evaluating the small-scale Irrigation Schemes in community-based irrigation scheme in Tekeze basin of Tigray.
Financial self-sufficiency
The financial self-sufficiency result indicates how much of the revenue generated was used for operation and maintenance. It shows the ability of the users to manage the scheme without government support. In the scheme smaller maintenance tasks such as canal cleaning were done by the farmer themselves. The canal was maintained currently with the cost of 7,000,000 ETB. Since the total revenue obtained from the irrigation scheme in the cropping season was 3,329,550 Ethiopian Birr and maintenance cost was 7,000,000 Ethiopian birr and accordingly the financial self-sufficiency was 0.5. This shows that the farmers need access to credit for input and other costs in addition to the water pricing at the scheme in the future.
Area and water-based profitability
Both the area and water-based profitability of the scheme were evaluated. The result reveals that the area-based profitability ratio and the water-based profitability were 0.42 and 0.17, respectively. This shows that the scheme profitability was low and this could be, poor management of the water at the field and lack of awareness on producing wheat crop in the scheme. This could be improved through practicing irrigation scheduling for effective management of the field water, cultivating commercial crops based on farmers interest and crops that need low input cost and also through construction of micro basin on the sloppy areas.
Conclusion
Both the internal and external performance indicators were evaluated to determine the status of Temsa small scale irrigation scheme in the cropping year of 2016. From the internal indicators the ability of the canal to deliver water from the head work up to the field is in a good condition, except maintenance at the middle reach of the scheme. Other internal indicators which depend on the farmers ability and climatic condition are also good but for a better performance they have to be supported by the irrigation experts from the Gomma district. Farmer’s practice of using a tied ridge has an advantage of controlling the water which could be lost in the form of run off, but still it needs an improvement on a sloppy land in the scheme to construct a micro-basin manually to save more water that could be lost.
Availability of water throughout the year and market accessibility near the scheme were the advantage of the scheme that encourage the farmers. However, the input costs for seed, fertilizer, herbicide and labor force were affecting the return from the product. Hence it is better to provide access to credit for the sustainable production and improve the farmers income. Generally, in the cropping dry season of 2016 E.C the performance of the Temsa small scale irrigation scheme was poor based on the internally and external performance indicators taken. Therefore, Gomma district irrigation agronomy experts, extension workers and water user association have to integrate for the improvement of its performance in the next cropping season and a head.
Footnotes
Acknowledgements
The authors are thankful to the Ethiopian Institute of Agricultural Research and small-scale irrigation scheme project coordinators for providing financial support for conducting the study. They also express appreciation for the staff members of the Irrigation and Water Harvesting Research program technical assistants, namely Ms. Kalisa Aba Jihad, Mr. Aliyi Ababulgu, and Mr. Abdurazak Abazinab. We are also thankful for the staff members of the Soil and Plant Tissue Analysis Laboratory of Jimma Agricultural Research Center.
Declaration of Conflicting Interest
The author(s) declared the following potential conflicts of interest with respect to the research, authorship, and/or publication of this article: The manuscript entitled “Performance Evaluation of Small-Scale Irrigation Scheme: A Case Study of Temsa Small Scale Irrigation Scheme of Goma District, Jimma Zone, South West Ethiopia” was a research conducted at Temsa scheme in the cropping season of 2016 E.C by the responsible researchers, namely Etefa Tilahun, Minda Tadesse, Addisu Asefa, and Hewan Tadesse. The necessary data were collected, analyzed and written by Etefa Tilahun, Minda Tadesse, Addisu Asefa, and Hewan Tadesse as a manuscript for publication. We hereby declare that this research is our original work, and all information in this document has been worked on responsibly and with ethical conduct. We also declare that, as required by these rules and procedures, all sources of materials that are not original to this work have been cited and duly acknowledged.
Funding
The author(s) received no financial support for the research, authorship, and/or publication of this article.
Availability of Data and Materials
The necessary data are available upon request from the corresponding author.