
Abstract
Soil water is the main water source for plants, which is replenished by rainfall in the water-limited agricultural systems. Quantifying temporal dynamics of water soil deficit and its replenishment by rainfall can evaluate whether soil water meet the water demand for plants. This would provide accurate guide for when and how the irrigation practices conducted. However, this topic has not been deeply elucidated. In this study, soil water content at varied soil depths and precipitation were continuously monitored during two growing seasons in an apple orchard in the Loess Plateau of China. Soil water storage, soil water deficit and replenishment were also quantified. The results showed that soil water content varied temporally due to the impacts of rainfalls. Soil water storage at 0 ~ 200 cm depth ranged from 272.5 mm to 355.6 mm and the degree of soil water deficit ranged from 0.34 to 0.53 correspondingly. Meanwhile, replenishment of soil water by rainfall was 13.00% in 2017 and 9.78% in 2018, respectively. The qualitative relationship between monthly rainfalls and replenishment indicated that soil water was replenished by rainwater only at soil layers shallower than 160 cm. From the temporal dynamics of soil water content and deficit conditions, soil water could meet the water demand at the fruit expanding stage of apple trees. Irrigation measures should be taken to reduce the soil drought stress at this stage. This study provided an effective hydrological basis to improve the irrigation management of orchards and the efficiency of water resource.
Introduction
Soil water, as an essential factor in the Soil-Plant-Atmosphere Continuum (SPAC), is the key link in hydrologic process of surface system which affects not only the runoff, infiltration, and soil evaporation but also the energy balance on ground surface (distribution of sensible heat and latent heat) (Dymond et al., 2017; X. Liu et al., 2022; Singh et al., 2019). Thus, wide attentions on soil water have been raised, which made great progress in the spatial distribution and temporal dynamic of soil water and their influencing factors (Broedel et al., 2017; Jiao et al., 2020; Rigden et al., 2018). Besides, soil water is one of the main water sources for plant growth and determines the productivity, morphological structure, and function of plants (Earles et al., 2018; Raczka et al., 2022). Especially for the orchards in the water-limited region, soil water shortage is a risk that widely existed (Blum, 2009; Müller & Bahn, 2022). Rainfall is the main recharge source of soil water and greatly impact on its dynamic, which could effectively improve soil water deficit and promote plants’ growth and development (Xiao et al., 2013; S. Wang, 2017). Nonetheless, previous studies revealed that soil water deficit in orchards was widely existed due to negative soil water balance (water loss > water input) in the arid and semi-arid regions (Chen et al., 2020; Cheng et al., 2020; D. Wang & Wang, 2017; Z. Zhang et al., 2018). Consequently, water stress still is the major obstacle that reduces the orchard production and yield (Meng et al., 2012).
In order to deal with the problem of soil water shortage in orchards, tillage practices aiming to save water and irrigation measures were developed and conducted (Li et al., 2017; Song et al., 2017; Vishwakarma, Kumar, Kumar, et al., 2023). For example, a water-saving technique, Rainwater Collection and Infiltration (RWCI) system, could use the rainwater to reduce drought stress in the rain-fed orchard in this region (Song et al., 2017). Additionally, by comparing 6 different tillage practices, Y. Liu et al. (2013) indicated that the subsoil tillage with straw mulching was the best way to hold soil water in apple orchards. Other irrigation techniques, such drip irrigation, trickle irrigation, and moistube irrigation, also were widely used to release water stress and enhance water use efficiency, improving orchard yield as well as quality (Fan et al., 2023; Jat et al., 2022; Rocha et al., 2023; Sun et al., 2023; Vishwakarma, Kumar, Abed, et al., 2023) Moreover, with increase of planting years, soil water content decreased and the soil desiccation layers formed in apple orchards, which was a threat to fruit yield and orchard sustainable development (Y. Q. Wang et al., 2011, 2015). However, although these measures improve soil water in the apple orchards, the time of irrigation is still difficult to be determined, which are crucial to enhance irrigation efficiency and improve water management (Vishwakarma, Kumar, Tomar, & Kuriqi, 2023; Z. Zhang et al., 2018).
To solve this problem, it is urgent to develop the method that assessing degree of soil water drought and degree of optimal soil water conditions, which are fundamental to determine the irrigation time (X. Gao et al., 2018; J. Küsters et al., 2021). Field capacity (FC) is the main criterion that is widely used to evaluate the soil water availability, the conditions of soil water deficit and the influence of soil water on plants (Granier et al., 2000; Q. Zhang et al., 2022). Xu et al. (2016) developed an evaluation criterion for optimal soil water of apple trees in different growth stages base on FC in apple orchards. Similarly, soil drought condition in orchards could be assessed by FC and measured soil water content (L. Gao et al., 2013; Xu et al., 2016). These studies provided the feasible ways to examine the degree of soil water deficit. However, due to rainfall events triggered soil water fluctuation, this question has not been widely and deeply investigated related to rainfalls.
The tableland region of the Loess Plateau, which is located in the semi-arid region of China, is the most suitable area for apple growth as well as the largest cultivation region of high-quality apple trees (Malus domestica) in China (S. Wang, 2017; Wu et al., 2021). In the recent 30 years, the development of apple orchards in this region has underwent a rapid growth and become a local leading industry promoting the development of regional economy (15,000 Yuan ha−1 for orchard more than 3,000 Yuan ha−1 for cropland) (Pang et al., 2019; Yu et al., 2009). For example, in Luochuan and Changwu counties, nearly 70% and 60% of cropland was converted to apple orchards (Hou et al., 2021; Huang & Gallichand, 2006). The area of apple orchards was up to 7,300 km2 and the yield reached to 11 million tons until 2016 in the Loess Plateau (S. Wang, 2017). Apple tree growth and its yield are tightly related to the soil water availability in the root zone (Sharma et al., 1986). In this region, soil water is the main water source for tree growth due to the thick soil layer (>30 m) (J. Wang et al., 2017; Yang et al., 2015). In this study, taken the representative tableland region of the Loess Plateau as the study area, a study plot of 10-year apple orchard was established for long-term continuous observations. Soil water content in varied soil depth of the orchard was continuously observed during 2 years. FC, soil water deficit and soil water replenishment by rainfalls in different soil layers were also quantified. The main purposes of this study are: (1) to investigate the spatial-temporal characteristics of soil moisture at 0 to 200 cm depth, (2) to quantify spatial and temporal characteristics of soil water storage, deficit and the replenishment of soil water by rainfalls, (3) to determine the time of irrigation in the apple orchard during the two growing seasons. This study attempts to provide an effective hydrological basis to improve the irrigation management of apple orchard and enhence the efficiency of water resource.
Materials and Methods
Study area
The study orchard is located in Zhaolaigou, Doujia Town, Yongshou County of Shaanxi Province, within the tableland region of the Loess Plateau (Figure 1). It is located at 34°47′30′′N and 108°16′17′′E with an elevation of 981 m. This area is in the warm temperate zone and has a semi-humid continental monsoon climate with an annual average temperature of 11.2°C (1959 ~ 2016). The mean annual precipitation of this area is 579.4 mm. The annual and monthly distributions of precipitation are uneven. The rainy season is from June to October, during which the precipitation (412.7 mm) accounts for 71.2% of the total precipitation throughout the year (Figure 2). Abundant in sunlight, this area has a yearly sunshine hour of 2,166.2 hr. The solar radiation is the lowest in December, accounting for 5.5% of the total amount in a year. The solar radiation is the highest in June, accounting for 12.2% of the annual amount. The data source of meteorology is China Meteorological Data Service Centre (https://m.data.cma.cn). The meteorological data used in this study from Yongshou Meteological Station (No.57030, 34°25′12′′N, 108°5′24′′E) included from 1959 to 2016. The soil type is Chernozems (according to IUSS-WRB, 2022). As the soil depth in this area is over 50 m, the plants mainly tap water from soil and the ground water is generally unavailable. In this study, the observation lasted 2 years (from January 1, 2017 to December 31, 2018).
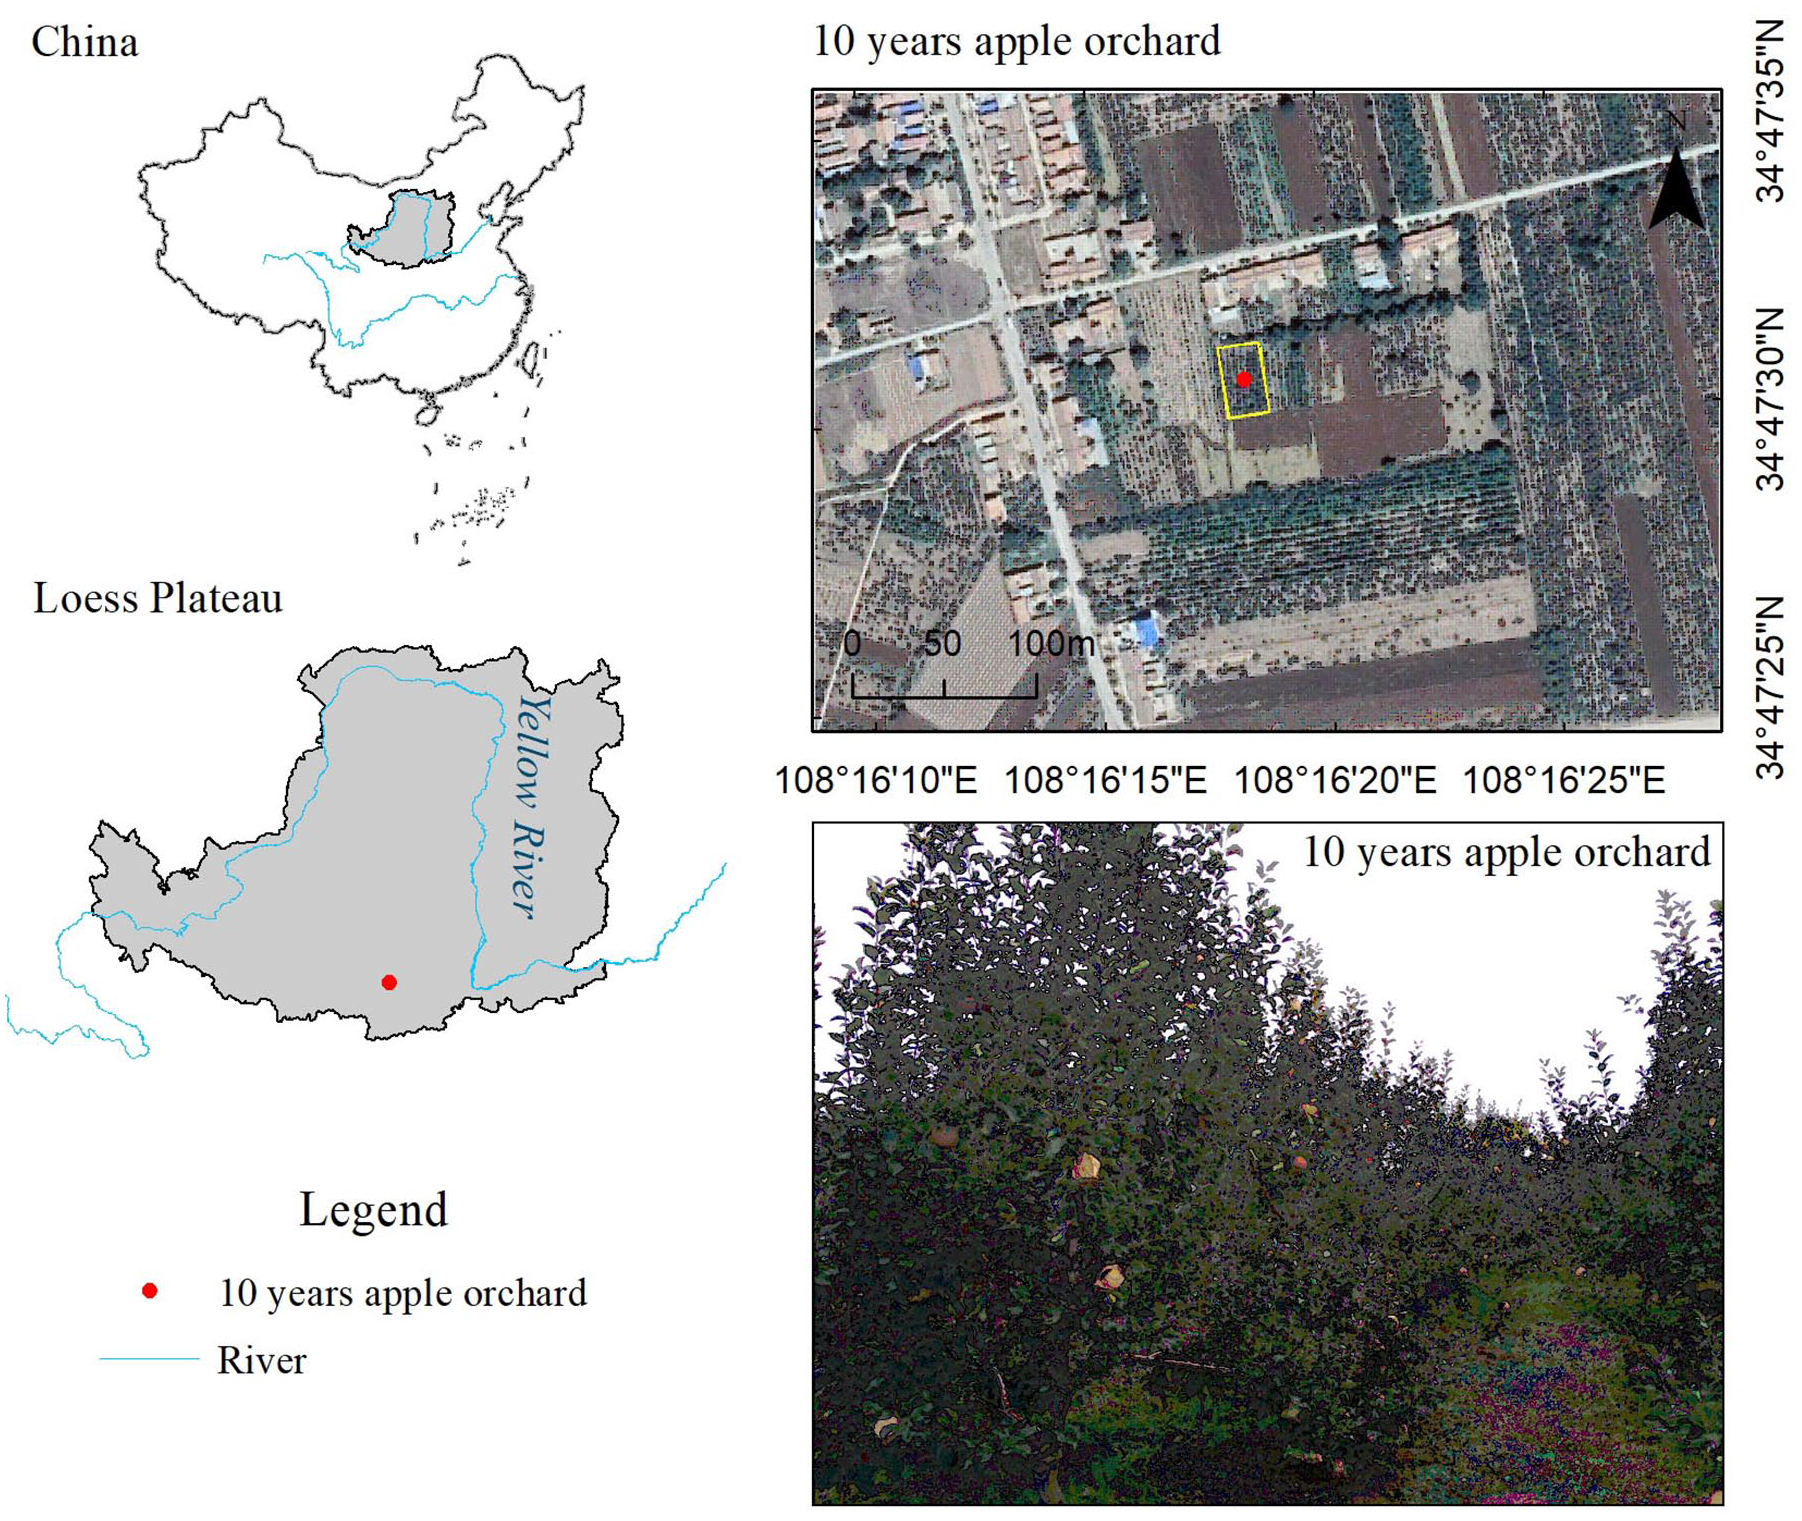
The location of the study site.

Monthly precipitation (P, mm) in the study area of 1959 ~ 2016 compared with that of 2017 and 2018.
The growing season of apple tree lasts from April to October, which can be divided into four stages, including bud formation stage, flowering stage, shoot and fruit development stage, and fruit expanding stage (Table 1). Multi-year mean precipitation in the growing season is 501.9 mm (1959 ~ 2016). In this study, the orchard is a 10-year apple orchard with a flat terrain. The inter-plant space is 2.5 m × 3.5 m. The mean tree high is 3.5 m and the average coverage is 65%. No tillage measures, such as weeding was taken in the study orchard during the growing seasons.
Growing Season of Apple Trees on the Loess Plateau and Optimal Relative Soil Water Content.

The evaluation criterion is obtained by analyzing the effect of soil water content on the shoot growth, stem growth, bud formation rate, and fruit-setting rate of apple tree in a relative soil water content test performed on the study apple orchard through irrigation control. Relative soil water content is obtained through Equation 3.
Meteorological factors
An automatic meteorological station (HOBO U30 Station, Onset Computer Corporation, Bourne, MA, USA) was installed in the study apple orchard for observing the meteorological factors during the study period. A tipping-bucket rain gage (S-RGB-M002, Onset Computer Corporation) was used to measuring the amount of rain during the study period. A thermo-hygrometer air temperature and relative humidity sensor (S-THB-M0002 Temp/RH Sensor, Onset Computer Corporation) was used to record the air temperature. The data was sampled at interval of 1 min and record at interval of 30 min. All the data were recorded on a HOBO data logger (U30, Onset Computer Corporation).
An empirical equation was used to explore the yearly or growing season precipitation patterns (dry, normal, or wet) of the 2 years during study period based on multiple year precipitation data (B. Zhang et al., 2008):


where Pi (mm) is the precipitation in the years or growing seasons of study period,
Soil physical properties
Soil water content (SWC, m3 m−3) at 5, 10, 20, 40, 80, 120, 160, and 200 cm soil depths in the orchard were measured through an EC-5 soil moisture probe. The sampling interval is 1 min and the data-recording interval is 30 min. A data logger (RR-1008, Yugen, Beijing, China) was used to store the recoded data. The probes were installed in May, 2016 and the observation began in January, 2017 after several-month soil compaction.
Relative soil water content (RSWC, %) refers to the ratio of SWC (m3 m−3) to field capacity (FC, m3 m−3), calculated by the equation:

Undisturbed soil samples in varied depths were collected for analyzing the soil bulk density and the soil water retention curve (SWRC) in laboratory. The bulk density was calculated through the volume and mass (constant weight dried at 105°C) of undisturbed soil sample. SWRC was obtained by using centrifugation method, and was fitted through van Genuchten equation. FC (SWC under 33 kPa) and wilting point (WP, SWC under 1500 kPa, m3 m-3) of each soil layer were obtained according to the fitting results (Table 2).
Soil Physical Properties in the Study Orchard in the Loess Plateau.

Data analysis
Soil water storage of soil layer i (SWSi, mm) in the study orchard can be calculated through the following equation:

where SWCi is the water content of soil layer i and di is the depth of soil layer i. The total water storage of 0 to 200 cm soil (SWS, mm) can be obtained by:

The degree of soil water deficit (DSW) at 0 to 200 cm depth can be calculated by:


where Da (mm) refers to the deficit amount of soil water storage, SWS refers to the actual soil water storage, and SWSFC (mm) is the soil water storage when the soil water is equal to FC. Equation 6 can show DSW before the rainy season and whether the deficit has been compensated at the end of the rainy season. If the DSW at the end of the rainy season is 0, then the deficit is completely compensated.
Replenishment of soil water storage (RSW, %):


where ΔSWS (mm) represents the change of soil water storage at the end of rainy season. SWSe (mm) and SWSb (mm) are the actual soil water storage at the end and beginning of rainy season, respectively, and Dab (mm) is the deficit amount of soil water storage at the beginning of rainy season. If ΔSWS < 0 at the end of rainy season, then RSW < 0, indicating that the deficit of soil water hasn’t been compensated in the rainy season or even gets worse. If RSW = 100%, it means that the deficit of soil water is fully recovered and compensated.
The mean and standard deviation of both the SWC and DSW in different soil layers were calculated. Analysis of Variance (ANOVA) was used to determine the differences of soil water conditions between the two growing seasons. Pearson correlation analysis was used to analyze the relationships between RSW and P at monthly scale in different soil depths. The data were analyzed using SPSS 16.0. Origin 2016 program was used to create the figures.
Results
Temporal variation in precipitation
The total P was 549.3 mm in 2017, which was lower than the multi-year average value (579.4 mm) (Figure 2). P in growing season was 486.1 mm in 2017, which accounted for 88.5% of the total amount of the whole year and was lower than the multi-year average value of growing season (501.9 mm). By comparison, the total precipitation was 611.6 mm in 2018, higher than that in 2017. The total P in growing season of 2018 was 571.0 mm (Figure 2). According to the Equations 1 and 2, it is implied that the growing season of 2017 was normal while the growing season of 2018 was wet.
Spatial-temporal variations in soil water
SWC varied spatially in the vertical soil profile during the study period in the orchard (Figure 3). The SWC showed a spatial trend of “increase-decrease-increase” with increase of soil depth (Figure 3). The average SWC at 10 cm and 120 cm soil depths were relative lower compared with other soil layers, with 0.12 m3 m−3 and 0.13 m3 m−3, respectively (Figure 3). SWC at upper soil layers (5 cm) were low owing to the strong evaporation on the surface. SWC declined at soil depth from 20 cm to 40 cm. Subsequently, it slightly increased along with the soil depth from 40 cm to 120 cm.

Spatial-temporal variations in soil water content (SWC, m3 m−3) and degree of soil water deficit (DSW) of the study orchard in the vertical soil profile during the study period.
Additionally, SWC varied temporally in the study apple orchard (Figures 3 and 4). SWS at 0 to 200 cm soil profile ranged within 272.5 mm ~ 335.6 mm in 2017 and within 293.4 ~ 383.5 mm in 2018, respectively. SWS was lowest at the beginning of each year (from January to March). From late March to early April, SWS increased slightly due to the influence of rainfalls. SWS rose in fluctuation from June to October due to the large number of rainfalls. SWS showed a decreasing trend since November due to the lack of precipitation in both years (Figure 4). The averaged SWC in the growing season of 2017 was 299.38 ± 17.32 mm, which was significantly lower than that in the growing season of 2018 (322.40 ± 21.66 mm) (p < .01).

Spatial-temporal changes of soil water content (SWC, m3 m−3), degree of soil water deficit (DSW), soil water storage (SWS, mm) and daily precipitation (P, mm).
Degree of soil water deficit
Similar with SWC, DSW varied spatially and temporally in the orchard during study period (Figures 3 and 4). DSW ranged within 0.42 ~ 0.53 in the growing season of 2017 and within 0.34 ~ 0.50 in the growing season of 2018, respectively (Figures 3 and 4). The mean DSW in the growing season of 2017 was 0.48 ± 0.03, which was significantly higher than that in the growing season of 2018 (0.45 ± 0.04) (p < .01). At the vertical soil profile, DSW in the top soil layer (5 cm) was highest than other soil layers during the study period (Figures 3-3 and 4-2).
Replenishment of soil water storage
The deficit of soil water at 0 ~ 200 cm soil depth was partly compensated and the RSW was 13.00% in the growing season of 2017 and 9.78% in the growing season of 2018, respectively. However, it is obvious that the replenishment of soil water by precipitation differed along the soil depths, with varied ΔS in different soil layers (Figure 5-1). Specifically, in the normal growing season of 2017, RSW in the shallow soil layers (from 5 cm to 80 cm) were higher than that in the deep soil layers (from 120 cm to 200 cm) (Figure 5-2). While in the wet growing season of 2018, RSW in the shallow soil layers were lower than that in the deep soil layers (Figure 5-2).

Changes of soil water storage (ΔSWS, mm) and replenishment of soil water storage (RSW, %) at different soil depths during the growing season of 2017 and 2018.
It can be known from the correlation analysis results of RSW and P at monthly scale, RSW at 5 ~ 120 cm soil layers increased along with precipitation increasing and R2 was positive, indicating that the soil water was compensated by precipitation (Figure 6-1 ~ 6-6). The results of the correlations between RSW and P at 160 cm and 200 cm soil depths showed that the replenishment slightly declined as precipitation increasing, indicating that soil water at the deeper soil layers was not compensated by the precipitation (Figure 6-7 and 6-8).

Relationships between the monthly replenishment of soil water storage (RSW, %) and the precipitation (P, mm) at different soil depths in the orchard.
Response of soil water content to precipitation
The response of SWC to precipitation was analyzed based on two rainfalls during the study period, which occurred during August 29, 2017 ~ August 30, 2017 and June 3, 2017 ~ June 5, 2017 (Table 3). The cumulative precipitation was 24.5 mm and 79.6 mm and lasted for 28 hr and 49 hr, respectively (Figure 7). For the precipitation of 24.5 mm, SWC at 5, 10, and 20 cm soil depths increased by 9.54%, 8.98%, and 3.87%, respectively. The corresponding SWC reached their maximum for 26, 32, and 67 hr, respectively. There are no obvious changes in SWC of soil depth more than 20 cm. For the precipitation of 79.6 mm, SWC at 5, 10, 20, and 40 cm soil depths increased by 11.48%, 15.21%, 8.47%, and 7.97%, respectively. The corresponding SWC reached their maximum for 32, 44, 48, and 68 hr, respectively. No obvious changes of SWC appeared in the soil depth more than 40 cm (Figure 7).
Characteristics of Selected Two Rainfall Events.


Responses of soil water content (SWC, m3 m−3) at different depths to rainfalls of different intensities.
Discussions
Effect of precipitation on soil water
This study found that the replenishment of soil water by precipitation varied obviously along the vertical soil profile. Precipitation, as the major soil water source of rain-fed apple orchard, determines the replenishment of soil water (S. Wang et al., 2013; Xiao et al., 2013). The results could be explained in detail from two aspects. By investigating the response of SWC at different depths to rainfall events during the study period, it was found that the infiltration depth of larger rainfall event was deeper than that of low amount of rainfall (Figure 7). The infiltration depth of rainwater was determined by the intensity of rainfall and vegetation cover types (Feng et al., 2018). In this study, rainwater infiltration in the heavier rainfall (79.6 mm) was deeper than that in the rainfall of 24.5 mm (Table 3 and Figure 7). Pervious study suggested that both the infiltration depth and cumulative infiltration were positively correlated with precipitation (S. Wang et al., 2013). By comparing the cumulative infiltration amounts and infiltration rates for five vegetation cover types, S. Wang et al. (2013) also concluded that natural grass displayed a rapid infiltration rate and the wetting front was able to reach a greater depth than subshrub, plantation and shrub. Also, SWC at 0 ~ 80 cm depth changed evidently, with higher SDs than that in deep soil layers (Figure 3), indicating that the influence of precipitation on soil water gradually reduced as the soil depth increasing. These findings were in accordance with previous studies conducted in the Loess Plateau (Li et al., 2017; Y. Q. Wang et al., 2015). Furthermore, the correlation analysis showed that the RSW was positively correlated with P at shallow layers (0 ~ 120 cm) (Figure 6-1 ~ 6-6), indicating precipitation effectively recharged soil water at these layers. However, the soil water was scarce recharged by precipitation, with negative relationship between RSW and P at deep layers (160 cm and 200 cm) (Figure 6-7 and 6-8). Therefore, the infiltration depth of rainwater exerted crucial role on soil water replenishment in the apple orchard.
Furthermore, there was a time lag between the moment the soil water content at deep depth started to increase or reached it maximum and the moment the rain began (Jia et al., 2016; Recha et al., 2016). When the intensity of rain increased, the variation amplitude and lag time of SWC increased as well, which was consistent with the results of Bao et al. (2012) and Ru et al. (2014). A study on the response of precipitation to soil water content in a locust forest in the loess area of western Shanxi Province found that the water content in the top 10 cm soil would not drop immediately after reaching the maximum, that is, there was a plateau (Bao et al., 2012). However, in this study, for the rainfall of 79.56 mm, SWC at 5 cm and 10 cm depths decreased after reaching its maximum. The plateau appeared at 40 cm soil depth. This was probably related to the difference of the soil textures between locust forest and apple orchard (Ru et al., 2014). The surface soil of locust forest was covered with fallen branches and leaves and the soil was compact. While the surface soil of apple orchard was loose due to cultivation, thus the water transfers rapidly in the surface soil. Therefore, the rainwater requires more time to infiltrate and improve the soil water deficit.
To alleviate the effect of time lag, the analysis on precipitation replenishment on soil water was conducted at a long-time scale in this study, that is, the monthly scale. Also, with regard to water management in the orchards, time lag, and infiltration depths should be take more attentions to maximum water use efficiency (Feng et al., 2018).
Soil desiccation in apple orchards
This study also found that soil water reduced in the 160 cm and 200 cm layers in the normal growing season of 2017. This was possibly related to less replenishment by precipitation (water input) but more soil water consumption through trees’ transpiration. Soil desiccation is defined as the SWC less than the stable field capacity (SFC, 60% of FC), which is induced by water output exceeding water input (Y. Q. Wang et al., 2010). According to this definition, soil desiccation was formed in the deep soil layers (deeper than 80 cm) in the study orchard. Meng et al. (2012) revealed that the water utilization depth of apple trees was more than 3 m based on the Darcy’s law. By using the stable isotopes technique, S. Wang (2017) found that the main water source of the 10-year-old apple trees varied throughout the growing season. Soil water in 60 to 150 cm and 160 to 300 cm soil layers was mainly absorbed in the shoot and fruit development stage. While in the fruit expanding stage, apple trees absorbed water from 160 to 300 cm soil layers. The transpiration of apple trees in both fruit development stage and fruit expanding stage was almost highest during the whole growing season (C. Liu et al., 2012). Therefore, the water source of 10-year-old apple tree came from deep soil layers during the period when its water demand was high, which possibly induced soil desiccation in the deep layers.
Previous studies suggested that SWC was much lower than that in farmland, and both the extent of soil desiccation and soil desiccation layer thickness increased with increasing age of apple orchard (Y. Q. Wang et al., 2011, 2015). The presence of soil desiccation exerted negative effects not only on the water cycling in the SPAC but also on the grain yield of the following crops and productivity of the rotations of plantations (Shangguan, 2007; Y. Q. Wang et al., 2015). After 30 years, fruit yield and quality declined due to available soil water depletion. One way of recovering the soil water was cutting the apple trees, but the recovery time was from 4.4 to 8.4 years for 0 to 3 m soil profile and from 6.5 to 19.5 years for 0 to 10 m soil profile, respectively (Huang & Gallichand, 2006). Therefore, measures should be conducted to improve soil water to maintain sustainable agriculture.
Implications for orchard irrigation management
To reduce the soil water deficit in the rain-fed orchard, different management measures were usually conducted. One management measure that related to hold soil water were carried out to reduce the soil water loss through soil evaporation. Evapotranspiration consisted of three components, that is, soil evaporation, transpiration, and canopy interception (Kool et al., 2014; Mitchell et al., 2009; Vishwakarma, Kumar, Abed, et al., 2023). Transpiration is directly related to photosynthesis and productivity (Jiao et al., 2016, 2018). The higher ratio of soil evaporation to evapotranspiration reflects that more water is used for soil evaporation not for plant transpiration, which can result in plant productivity degradation (Qiu et al., 2015). D. Wang and Wang (2017) found that the ratio of soil evaporation to evapotranspiration ranged from 40.1% ~ 43.7% in 17-year-old apple orchard and 51.7% ~ 53.6% in 7-year-old apple orchard. To reduce soil evaporation, Y. Liu et al. (2013) indicated that the subsoil tillage with straw mulching was the best way to hold soil water in apple orchards in this region by comparing 6 tillage practices. In addition, another management measure, that is, increase of water input, such as irrigation, was an effective way to alleviate soil water deficit (Vishwakarma et al., 2024). For example, a water-saving technique, Rainwater Collection and Infiltration (RWCI) system, could reduce drought stress and increase the efficient use of rainwater in the rain-fed orchard in this region (Song et al., 2017). These studies provided the effective measures that improve soil water in rain-fed apple orchards. However, when the measures were carried out during the growing season remained unclear.
RSWC is an agricultural drought index which is often used to represent the drought degree of soil (Table 4) (Xu et al., 2016). Specifically, a RSWC below 30% represents extra-heavy drought. A 30% ~ 40% RSWC represents heavy drought. A 40% ~ 50% RSWC represents moderate drought. A 50% ~ 60% RSWC represents mild drought. A RSWC over 60% represents no drought. The evaluation criterion, widely used in the Loess Plateau, is obtained by analyzing the effect of soil water content on the shoot growth, stem growth, germination rate, and yield of apple tree in a RSWC test performed on an apple orchard in the Loess Plateau through irrigation control (Xu et al., 2016). In this study, RSWC ranged within 40% ~ 50% from January 1 to March 31, 2017, and this moderate drought period accounted for 24.7% of a year. RSWC ranged within 50% ~ 60% from April 1 to December 31, 2017, and this mild drought period accounts for 75.3% of a year.
Soil Drought Conditions of the Test Apple Orchard Determined Through Relative Soil Water Content.
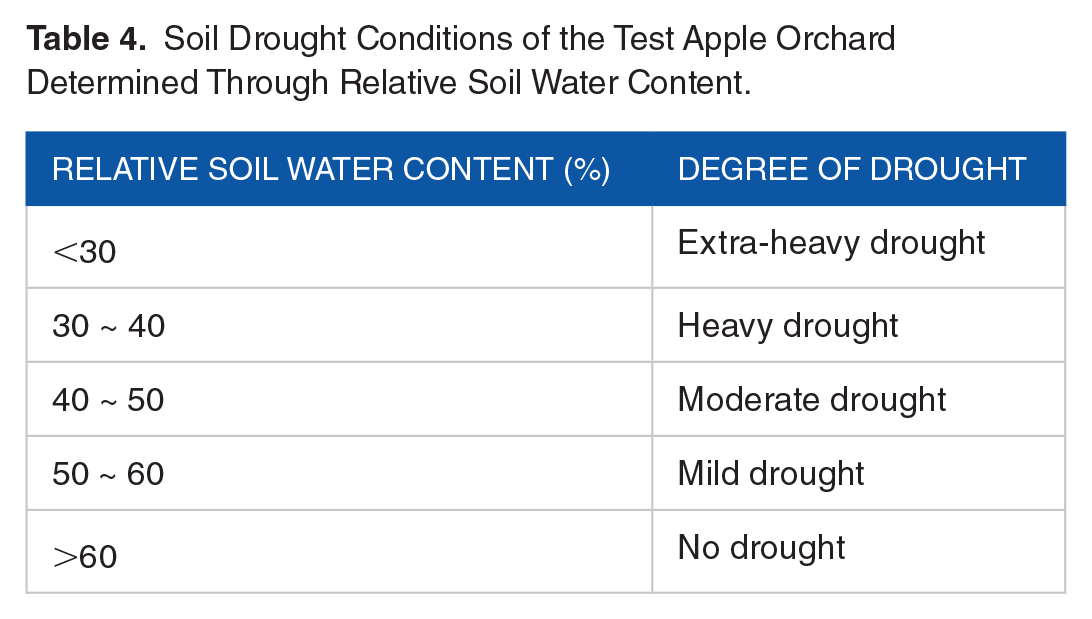
It should be noted that the optimal RSWC for apple tree varied at different growth stages (Table 1). At the bud formation stage, flowering stage, and shoot growth and fruit development stage, the optimal RSWC for apple tree was 50% ~ 60%. While at the fruit expanding stage, the optimal RSWC is 70% ~ 80%. The fruit yield and quality of apple trees will be affected if the optimal RSWC is not satisfied. In this study, at the bud formation stage, flowering stage, and shoot growth and fruit development stage, the RSWC at 0 ~ 200 cm depths was between 50% ~ 60%, which was within the range of optimal RSWC and were able to meet the water demands of apple tree. However, at the fruit expanding stage, the RSWC was lower than the optimal RSWC (70% ~ 80%). Therefore, irrigation measures should be taken and reduce the soil drought stress at this stage (Figure 8).

Dynamic of soil water storage (SWS, mm) in the orchard during the study period.
Conclusions
In the apple orchards on the tableland of Loess Plateau, soil water is the only water source for trees and is mainly recharged by precipitation. Therefore, the impacts of rainfall on soil water dynamic and replenishment are crucial for trees growth, development, fruit yield, and quality. In this study, although the deficit of soil water could be partly alleviated by rainwater, the replenishment limited to alleviate soil water conditions. Replenishment of soil water by rainfall decreased along the soil depths, which was related to the infiltration depth of rainwater. Furthermore, rainfall was unable to satisfy the water demands of the apple orchard at some stages of growing season (especially fruit expanding stage), thus irrigation was needed to alleviate soil drought in apple orchards in this region. Therefore, it is necessary to regularly observe soil water of the apple orchards in this region in order to evaluate the drought conditions at different growth stages. This study also provided a quantitative information on determining the irrigation time through investigating spatial-temporal dynamics of soil water and calculating replenishment of soil water by rainfall. This study provides scientific information and reference on optimization on orchard irrigation management based on analysis of soil water deficit and rainfall replenishment. Future work should focus on the simulation of soil water dynamic and movement to examine the water use efficiency under varied irrigation techniques.
Footnotes
Appendix
Index of abbreviations.

| Abbreviation | Description | Unit |
|---|---|---|
| DSW | Degree of soil water deficit | — |
| FC | Field capacity | % |
| P | precipitation | mm |
| RSWC | Relative soil water content | % |
| RSW | Replenishment of soil water storage | % |
| SWC | Soil water content | m3 m−3 |
| SWS | Soil water storage | mm |
| ΔSWS | Changes of soil water storage | mm |
| WP | Wilting point | % |
Acknowledgements
We sincerely thank Liwei Zhang from Shaanxi Normal University for his substantial work on manuscript revision. We also thank Sinuo Chen from Kang Chiao International School Xi’an Qujiang Campus for her help with literature search and language proofreading.
Author Contributions
Jiao Chen and Lei Jiao jointed designed the research. Zongshan Li and Dong Cheng conducted the research. Jiao Chen and Lei Jiao wrote the original manuscript. Zongshan Li and Lei Jiao reviewed and edited the manuscript.
Declaration of Conflicting Interests
The author(s) declared no potential conflicts of interest with respect to the research, authorship, and/or publication of this article.
Funding
The author(s) disclosed receipt of the following financial support for the research, authorship, and/or publication of this article: This study was funded by the National Natural Science Foundation of China (U2243231, 42271098), the Think Tank Connotation Construction Project of Shaanxi Provincial Department of Education (21JT022), the Natural Science Basic Research Plan in Shaanxi Province (2022JM-156, 2022JQ-396) and the New Urbanization and Human Settlement in Shaanxi Province Foundation (CZHYJ202007).