
Abstract
Background and research aims:
Most of volcanic landscapes on Java, Indonesia, are increasingly being used for agriculture. As a consequence, high rate of soil erosion due to agricultural cultivation cannot be avoided. Agricultural reservoir is one of methods to maintain soil loss due to erosion. Most research to date, however, have been based on the function of the reservoirs rather than on the arrangement of the reservoirs which are usually locally specific. Thus, an evaluation of the arrangement for agricultural reservoir becomes a crucial innovation. This study was aimed at examining the effectiveness of agricultural reservoir arrangement along rill erosion in reducing runoff volume as well as erosion rate, and increasing sediment trapped.
Methods:
The research was conducted using the field survey method at a key sampling area by considering the dominant relief and land cover on the volcanic landscape of the Sumbing Volcano. Data collected includes soil properties (texture, organic matter, porosity, soil pore distribution, permeability, and soil infiltration rate), runoff discharge, runoff volume, and sediment delivery. Research started by determining the points for placing the agricultural reservoirs along the rill erosion and continued with field and laboratory measurements.
Results:
Our results showed that placing agricultural reservoirs along the rill erosion effectively reduced erosion by 99.97%. Consequently, the erosion rate was only 5.5 × 10⁻⁴ ton ha−1. The effectiveness of agricultural reservoirs in reducing runoff volume and sediment delivery was 99.72% and 94.15%, respectively.
Conclusion:
Agricultural reservoirs that are placed along the rill erosion effectively trap sediment and reduce runoff so that erosion rates decrease.
Implications for conservation:
Placing agricultural reservoirs along rill erosion can improve the effectiveness of reservoirs in decreasing the erosion rate. This strategy helps reduce runoff and sediment to maintain the productivity of agricultural land. Finding a suitable strategy for the evaluation of erosion and sedimentation processes has important implications for soil and water conservation.
Introduction
Volcanic landscapes have good land resource potential for the development of the agricultural sector. Volcanic ash contains nutrients for soils (Fiantis et al., 2019). Soil that develops from weathered volcanic ash is so fertile that it is widely used as agricultural land (Sambodo & Arpornthip, 2021). However, inappropriate land management may degrade land and decreasing land quality (Singh et al., 2017; Wang et al., 2019; Zhang et al., 2016, 2024), obstructing sustainable land resource development (Nugraha et al., 2022), and accelerate erosion (Cerdà et al., 2018; Wang et al., 2017).
Erosion is a form of land degradation that often occurs in volcanic landscapes. Soil erosion is a major environmental threat to agricultural productivity, for example, in Iran (Amiri, 2010), in China (Tang et al., 2015; Zhang et al., 2016); in Indonesia (Ardianto & Amri, 2017; Mu’minah, 2009; Jauhari et al., 2018; Suharto et al., 2023). The erosion rate at the Bompon Sub-Watershed, which is located on the foot slopes of the Sumbing Volcano, is classified as very high (Effendy et al., 2018). High erosivity accompanied by high erodibility results in immensely erosion-prone soils in the Bompon Sub-watershed. Soil loss in the untreated erosion experiment plot in the Bompon Sub-Watershed reached 132.3 kg, equivalent to 142.26 tn ha−1 (Wardhana, 2017). The problem of erosion requires a site-specific conservation strategy because erosion management strategies differ between landscape characteristics.
Many research of soil and water conservation conducted on vary landscape characteristics. The most common soil and water conservation strategy is the implementation of terraces for degraded land (Ahmad et al., 2020; Xu et al., 2018; Zhang et al., 2015). Other soil conservation strategies using vegetative methods have also been conducted, such as strip cropping for steep slope landscape (Campanelli et al. 2023; Juventia et al., 2022), intercropping in rainfed maize-wheat rotation in Himalaya (Sharma et al., 2017), in China (X. Li et al., 2020). Ridge and sediment trap were also implemented for soil conservation strategy (Pan et al., 2017; Satriawan et al., 2015). Dry farming could be a type of water conservation strategy in a landscape with low rainfall intensity (Shinde et al., 2019). Micro-basin tillage also as a water conservation practice on sloping croplands between 5° and 7° (Sui et al., 2016).
Agricultural reservoir is one of conservation strategy to reduce the rate of erosion. The application of agricultural reservoirs on land with a slope of 15° resulted in a much lower runoff volume (13 m3) and a lower amount of soil loss (157 kg) compared to land without agricultural reservoirs (66 m3 and 7,744 kg) (Han et al., 2018). The runoff volume and erosion rate were 187.31 m3 ha−1 and 20.40 tn ha−1 on steep slopes with agricultural reservoirs, respectively, and 235.81 m3 ha−1 and 30.80 tn ha−1 on land without these reservoirs, respectively (Satriawan et al., 2017). An agricultural reservoir can also be a function of sediment trap to reduce soil loss (Han et al., 2018), as well as reservoirs for rainfall and runoff (Bohluli et al., 2014), thereby substantially increasing the amount of water infiltration into the soil (41.38%) (H. Li et al., 2018). The increase in infiltration is followed by an increase in groundwater storage (Wirasembada et al., 2017).
Agricultural reservoirs in volcanic landscape are still considered ineffective to reduce runoff and to trap sediment if they are randomly distributed. Volcanic landscape usually has a large degree of slope which is more than 15% (Malik & Sartohadi, 2017), and are dominated by hilly landscape (Ramlah et al., 2020). Those characteristics aggravate the soil loss. Applying these reservoirs decreased erosion rates on steep land by 67% (Francaviglia & Neri, 2020). But, the application of agricultural reservoirs is mostly based on the density of agricultural reservoirs per hectare (Pratiwi & Salim, 2013).
The arrangement of agricultural reservoirs should improve their effectiveness in reducing runoff and soil loss. Agricultural reservoirs built in a zigzag manner on a plot measuring 3 m × 10 m showed an effectiveness value of 22.01% and 68.7% in reducing runoff and erosion, respectively (Masnang et al., 2022). Meanwhile, the effectiveness of agricultural reservoirs built linearly from the upper slope to the lower slope on a plot measuring 22 m × 4 m in reducing runoff and erosion was 88.55% and 85.42%, respectively (Y. Y. Devianti et al., 2020). Agricultural reservoirs built in a triangular pattern effectively reduced runoff by 42.5% (Guo et al., 2019). Further evaluation of the arrangement of agricultural reservoirs has become important. Therefore, this study examined the effectiveness of agricultural reservoirs placed along the rill erosion in reducing runoff volume as well as erosion rate, and increasing sediment trapped.
Study Area
The study area is part of the upstream Bompon Sub-Watershed, located on the middle slope of Sumbing Volcano (Figure 1a). The area covered about 2,350 m2, which is dominantly by agricultural land under vegetation type of cassava (Figure 1b). According to Schmidt-Ferguson’s climate classification, the climate type of the study area is rather wet, with nine wet months and three dry months in a year. Therefore, the study area has two seasons in a year, that is, wet season and dry season. The average annual rainfall is 2,761 mm, and the average temperature is 26°C. Field measurements were performed on natural rill erosion used as cassava farming land (Figure 2b). The slope is ranging from 8% to 35% and having thick clay soil. The research location was divided into four zones based on slope position and slope degree, namely, residual zone, erosional zone, transitional zone between erosion and deposition zones, and depositional zone.

The study area: (a) sumbing quartenary volcanic landscape and (b) catchment area.

View of research location: (a) rill erosion, (b) cassava farming land, (c) surface flow in rill erosion, (d) pole for AWLR, (e) outlet, and (f) runoff and sediment trapped in the agricultural reservoir after one rainfall event.
Research Methodology
Data collecting
This study was conducted on January to May 2022. The sampling method was purposive sampling, where the sampling points were taken based on the geomorphological zonation (erosion zone, deposition zone, and transition zone) in the catchment area. There are five agricultural reservoirs arranged in the catchment area (Figure 1): two reservoirs in the erosion zone, one reservoir in the transition zone, and two reservoirs in the deposition zone with a volume of 2 m3 each. Deposition zone of the catchment area also has a function as an outlet for the measurement of surface runoff and sediment yield. The plot-size for measuring runoff and sediment yield affected by soil loss was covering the whole catchment area.
Soil samples were collected in each zone on the left and right side at 0 to 20 cm depth. The soil properties analysis included those that affect the potential of rainfall to become runoff, such as texture, organic matter, porosity, soil pore distribution, and soil permeability. Soil texture was measured by the pipette method, that is, by determining the percentage content of the fraction of sand, loam, and clay in the soil. The analysis of organic matter was conducted using the Walkley and Black method. Soil porosity is determined empirically using specific weight and bulk density, while the soil pore distribution is measured with the pressure plate apparatus at various pF pressures (0, 2, and 2.54). Soil permeability was measured with a permeameter. Soil laboratory analyses were conducted based on technical insructio created by Agricultural Ministry (2023).
Soil infiltration was also measured in this study. It was collected using a single ring infiltrometer. Infiltration rate measurement was conducted using Horton equation model, as below (Beven & Robert, 2004):
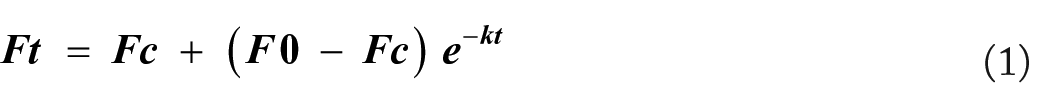
Ft: Infiltration rate (cm/hr)
t: time (hr)
F0: initiate infiltration rate (cm/hr)
Fc: constant infiltration rate (cm/hr)
k: constanta showing decreasing infiltration rate
e: 2.718
The Horton is a model that is widely used because it is considered appropriate for representing the infiltration process. The Horton is used more to find the value of the infiltration rate in surface runoff. Infiltration in the Horton Model uses an empirical approach from the function of time (Equation 1).
Rainfall measurements were collected on every rainfall event using an ombrometer modified with a 1.5 L bottle placed in an open field. The collected rainfall volume was measured after the rainfall ended (maximum at 5.30 p.m.). Rainfall depth (mm) was obtained by dividing the volume of rainfall in the bottle by the cross-sectional area of the bottle. Rainfall duration was recorded to determine the rainfall intensity using Equation 2.

I = rainfall intensity (mm/hr)
H = rainfall depth (mm)
t = rainfall duration (hr)
Other field measurements during rainfall events were also conducted to measure runoff discharge and volume, sediment trapped in the agricultural reservoirs, and sediment delivery leaving the outlet. Runoff discharge and volume were measured at the outlet, while sediment was measured at two reservoirs in the deposition zone and the outlet (Figure 2d and e).
Surface runoff was determined by measuring the runoff velocity and water level recorded by AWLR (Automatic Water Level Recorder) every 2.5 min, while the runoff volume was obtained from the increasing of water level at the field (Equation 3). To determine sediment trapped in the agricultural reservoirs, the sediment samples was taken out using a 0.33 L bottle, then filtered with filter paper and oven it to determine sediment weight (Mostafazadeh et al., 2024). The dry weight of sediment was divided by the volume of sediment to obtain the sediment content. Sediment delivery leaving the outlet was conducted using sediment yield and runoff occurred within a catchment area (Equation 4)

V = runoff volume (m3)
A = area of water measurement station (m2)
H = water level in each reainfall event (m)

Sediment = sediment leaving the catchment (kg/m2)
Cs = sediment yield (g/L)
Ro = runoff volume (L)
A = catchment area (m2)
Data analysis
The data analysis was carried out both qualitatively and quantitatively. The qualitative analysis was implemented to analyze the factors that influence rainfall forming runoff and erosion. The quantitative analysis was implemented to analyze surface runoff and sediment yield response toward rainfall. It used mathematical equations to determine rainfall intensity, runoff discharge and volume, sediment yield which was trapped in the agricultural reservoirs, and sediment delivery in the outlet. The sediment delivery leaving the outlet and the runoff volume can strongly affect the geological formation (Mostafazadeh et al., 2024), such as erosion. The effectiveness of agricultural reservoirs was determined from the ratio of the runoff volume to sediment content.
The spatiotemporal dependencies were also conducted during the analysis. The spatial approach was implemented depended on the terrain indices which were classified based on the geomorphological zones. The temporal approach was implemented for the surface runoff and sediment yield measurement during the rainy season.
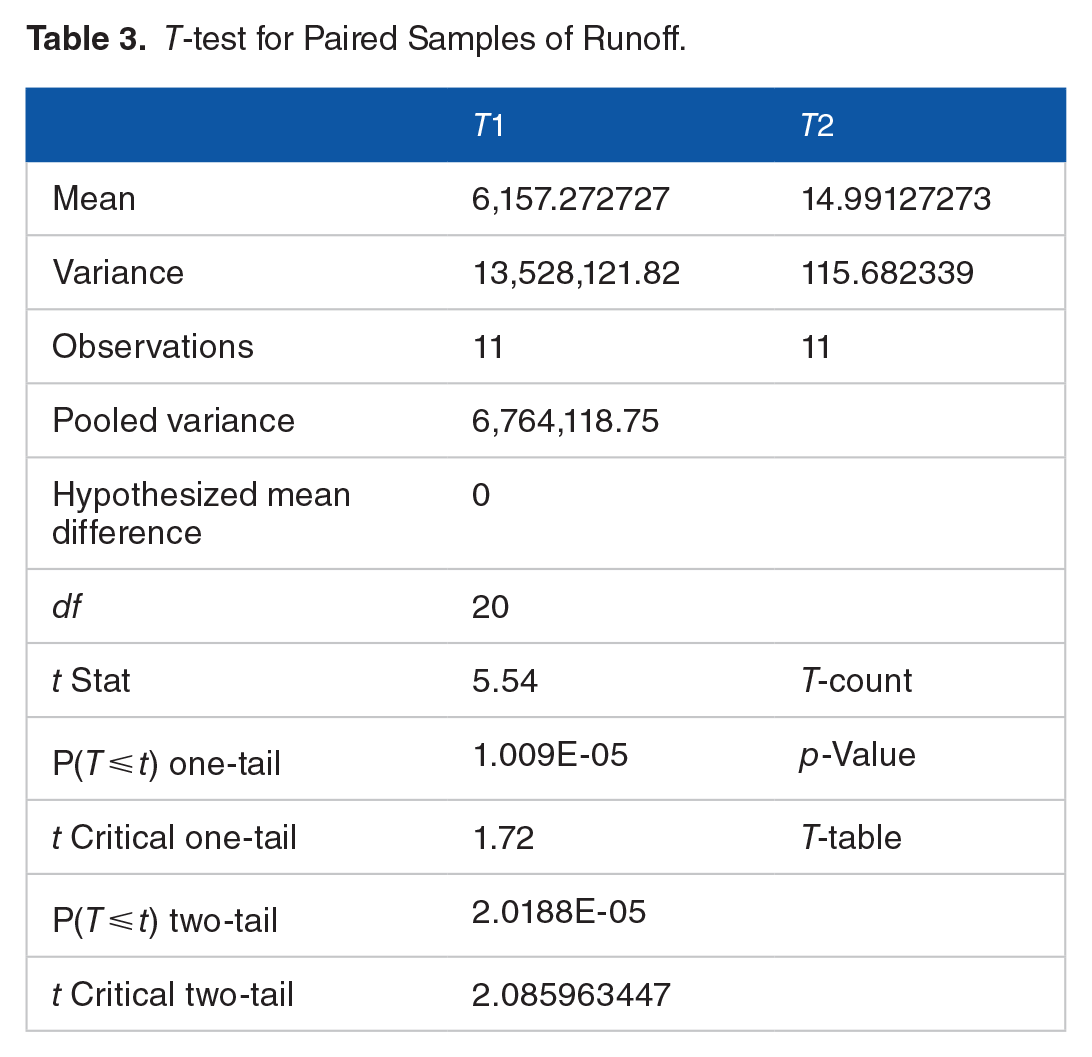
T-test was used for the statistical analysis. Paired T-Test was conducted to compare and determine the significance of measurement in the fields (i.e. runoff, sediment, and erosion rate) before and after the application of the agricultural reservoirs. Paired t-test is part of a comparative test in statistical analysis which aims to compare the means of two samples when each observation in one sample can be paired with an observation in the other sample (such as before and after test) (Raharjo, 2021). In the T-test, the null hypothesis (H0) is formulated with the expectation of rejection, and rejecting H0 leads to accepting the alternative hypothesis (H1) at a significance level of 0.05 (α = 5%). The conditions for accepting H0 and rejecting H1 are T-count ⩽ T-table or p-value > α, while the conditions for rejecting H0 and accepting H1 are T-count > T-table or p-value < α (Magdalena & Krisanti, 2019). In this test, H0 posits that the measurement results before and after the application of agricultural reservoirs are the same, while H1 posits that the measurement results before the application of agricultural reservoirs are greater than afterward.
Results
Soil physical–chemical properties
Soils in the study area have a high clay content and low organic C content. The percentage of clay content ranged from 59% to 86%, and the average organic C content was 1.90% (Table 1). The high clay content and low organic C affect the distribution of total pore space, low bulk density, low particle density, and poor soil porosity, with the porosity considerably larger than 40% (Table 1). The soil permeability is relatively slow to moderate at 1.75 to 6.08 cm hr−1 because of influence of poor porosity.
Soil Physical

R = Residual; E = Erosion; T = Transition; D = Deposition; l = left land; r = right land.
Similar patterns of infiltration rates were formed among the residual, erosional, transitional, and depositional zones. However, the cultivation land on the right side has a lower infiltration rate than that on the left side (Figure 3). In addition, field measurements showed a difference in the infiltration rate from the starting time to the ending time in the measurement of the left-side cultivation land but not the right-side cultivation land.

Soil infiltration rate.
Surface runoff
High rainfall intensity increases runoff discharge and volume. The highest rainfall intensity (second rainfall event) during the measurement was 36.9 mm hr−1, resulting in a runoff discharge rate of 3.7 L s−1 and a runoff volume of 19.6 L. Meanwhile, the lowest rainfall intensity (ninth rainfall event) was 3.5 mm hr−1, resulting in a runoff rate of 0.1 L s−1 and a runoff volume of 2.1 L. The total volume of runoff leaving the outlet during the measurement was 115.0 L, and the average measured discharge was 1.1 L s−1 (Table 2).
Rainfall Intensity, Runoff, and Sediment.

Sediment and erosion rate
The greater the runoff is, the higher the sediment delivery. Sediment trapped in the agricultural reservoirs, sediment released at the outlet, and the erosion rate at the highest runoff volume (second rainfall event) were 11.1 g L−1, 1.8 g L−1, and 1.5 × 10⁻⁴ tn ha−1, respectively. Meanwhile, when the runoff volume formed was low (ninth rainfall event), the sediment trapped in the agricultural reservoirs was 0.5 g L−1, the sediment released from the outlet was 0.2 g L−1, and the erosion rate was 1.6 × 10⁻⁶ tn ha−1. The total sediment trapped in the agricultural reservoirs during the measurement was 53.1 g L−1, the sediment released at the outlet was 9.4 g L−1, and the erosion rate was 5.5 × 10⁻⁴ tn ha−1 (Table 2).
Statistical analysis
Statistical analysis was conducted to strength the implication among runoff, sediment, and erosion rates after the agricultural reservoirs were implemented. The statistical interpretation were formulated as follows:
H0 : µ1 ⩽ µ2 (the means obtained at T1 (before implementation) are equal or less to the means obtained at T2 (after implementation))
H1 : µ1 > µ2 (the means obtained at T1 (before implementation) is more than the means obtained at T2 (after implementation))
There was a significant difference in runoff volume, sediment, and erosion rates before and after the implementation of the agricultural reservoirs. This result was strengthened by the statistical results in Tables 3 to 5 which showed that all H0 was rejected, H1 was accepted. It means that the results before the implementation of the agricultural reservoirs showed more or greater value than the results after the implementation of the agricultural reservoirs. It can be seen from the comparison in the runoff volume, the T-count value (5.54) was greater than the T-table value (1.72) in the T-test (Table 3). The decreased runoff volume, then, caused a reduction in sediment transported from the outlet. The difference was reflected in the T-count value of sediment (3.14), which is greater than the T-table value of sediment (1.72) in the T-test (Table 4). Thus, the decrease in runoff volume and sediment released from the outlet reduced the erosion rate at the measurement location. This was evidenced by the comparison of the T-count value (3.99), which is greater than the T-table value (1.81) in the T-test of erosion rate (Table 5). Those showed a significantly different, indicating a significant impact between before and after the implementation of the agricultural reservoirs.
T-test for Paired Samples of Runoff.
T-test for Paired Samples of Sediment.

T-test for Paired Samples of Erosion Rates.

Discussion
The characteristics of the soil (Table 1) affect the amount of runoff formed at the measurement site. Soil characteristics affect the velocity of water infiltrating the soil surface during rainfall events. The high content of clay and low organic C resulted in the poor ability of the soil to pass through water. Soil infiltration decreased when the soil began to saturate (Sun et al., 2021). The infiltration rate at the right side of land, including the residual, erosion, transition, and deposition zones, reached a constant point at 0.4 hr, while at the left side of land reached a constant point at 0.6 hr (Figure 3). It is inline with the study of Bergeson et al. (2022) stated that commonly the infiltration rate reached a constant point at >0.3 hr.
The differences in reaching the constant points of infiltration rate were caused by variation of rainfall duration, and thus resulting in a variation of runoff starting period. Furthermore, it may effect the sediment production. In the study area, the sediment production was directly formed once the runoff was formed (Figure 2c). Consequently, the soil erosion was also performed at the same period. The interdependency among the rainfall-runoff-sediment-erosion variables was described on Table 2.
The increase in rainfall intensity is always followed by an increase in runoff discharge, runoff volume, and sediment (Table 2). A larger runoff discharge has higher potential energy, indicating a greater ability to transport sediment. Rainfall, runoff, and sediment have a significant positive linear correlation (Luo et al., 2020). As the intensity and duration of rainfall increase, the runoff rate increases, triggering soil erosion, initiating rill and gully erosion, and transporting sediment from the outlet (Hadini et al., 2019).
The runoff is strongly influenced by rainfall duration and intensity. Rainfall duration during the study was longer than the time for the soil infiltration rate to reach a constant point (Figure 3, Table 2). Consequently, the runoff was easily formed. Along with an increase in rainfall duration, constant rainfall depth increases runoff (de Almeida et al., 2021). The higher the rainfall intensity is, the higher the runoff discharge and runoff volume formed (Tao et al., 2021; Yao et al., 2021).
Slope conditions affect runoff velocity and accumulation (Figure 4). Runoff discharge increases because of the high-speed runoff caused by the steep slope. An increase in the slope also causes greater runoff (Jourgholami et al., 2021). In rainy conditions with the same intensity, the steeper the slope is, the faster the runoff (X. Li et al., 2020). Runoff formed from the upper slope will descend the slope and accumulate along the rill erosion. A higher runoff accumulation occurs in the deposition zone, indicating that the slope position affects the runoff accumulation. After reaching a lower slope, the runoff has greater momentum, and the runoff velocity is more concentrated (Yulina et al., 2015). Concentrated runoff in the deposition zone causes greater sediment delivery from the outlet.

Flow direction and accumulation in the measurement area at a scale of 1:100.
The increases in runoff discharge and runoff volume were always followed by an increase in sediment yield (Table 2). There is a significant relationship between them, as evidenced by the regression determination value (R2) of 0.9079. This aligns with the findings of Luo et al. (2020), who reported a significant positive linear correlation between runoff and sediment. Larger runoff carries higher potential energy, indicating a greater ability to transport sediment. As the runoff discharge increases, it transports sediment from the outlet, triggering soil erosion, and initiating rill and gully erosion (Hadini et al., 2019).
The runoff volume measured at the outlet was the accumulated flow formed from the residual zone to the deposition zone. The volume of runoff formed was influenced by the intensity of rain during the measurement period. The research results were in line with the research results of Yao et al. (2021) and de Almeida et al. (2021) which stated that high rainfall intensity also results in high runoff. The sediment yield collected in the deposition zone represents the majority of sediment content transported from the entire catchment area. The higher the level of sediment collected in the agricultural reservoirs means that the application of the these reservoirs could reduce the level of sediment transported out of the research area catchment so that the soil loss measured at the outlet was lower.
The sediment transport process begins when runoff forms. Many factors influence the initiation threshold of runoff, including soil characteristics. Friable soil, indicated by low bulk density values (refer to Table 1), results in soil aggregates being easily crushed by falling raindrops. Low bulk density values indicate that the cohesion force between soil particles is low, making the soil susceptible to detachment. Wang et al. (2022) reported that low bulk density values affect the high detachment capacity of soil, with a significance value of 0.97. Additionally, a high clay content (refer to Table 2) results in a higher amount of sediment due to its association with the ease of runoff generated (Mostafazadeh et al., 2023). Runoff has the ability to move or transport soil particles that have been released from their aggregates (Amaru et al., 2020).
Agricultural reservoirs functioned as reservoirs for runoff and sediment. The storage capacity of all these reservoirs reaches approximately 10,000 L, with dimensions of 2 m in length, 1 m in width, and 1 m in depth. The construction of the agricultural reservoir is various, some were made of cement/impermeable surface (2-f) and others were directly based by soils. Agricultural reservoirs in the erosion zone and transition zone are designed to have an impermeable surface base, while those in the deposition zone do not have an impermeable base. The impermeable surface base helps maintain the volume of runoff that can be accommodated, while the non-impermeable surface base supports sediment storage. Nasyirah et al. (2015) mentioned that the impermeable surface base is influenced by the percolation rate. In other words, after reaching the water-saturated soil layer and continuous rainfall, water will continue to move downward due to the influence of gravity, reaching the groundwater level.
The arrangement of agricultural reservoirs was based on the flow direction and runoff accumulation (Figure 4). The results showed evidence that the runoff was concentrated in the rill erosion located between the two terraced lands. The rills have mostly a trapezoid-like basin shape (Figure 5). The shape of the rills and their position at the terrace causes the runoff formed concentrated in the rill erosion. It was proved by the study of Nugraha and Sartohadi (2018) that the flow on land use with a terracing system will be concentrated on the sides of the terrace.
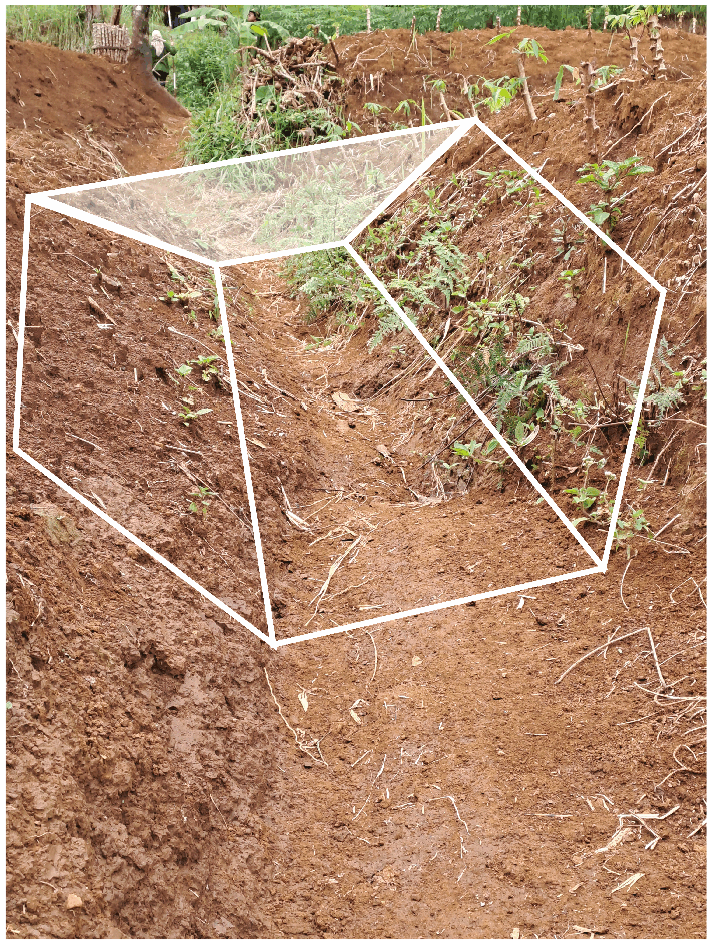
Shape of rill erosion.
The arrangement and volume of the agricultural reservoirs were adjusted to the amount of erosion. The previous study by Kurniawan (2019) mentioned that the amount of erosion in the study area was ±6,950.89 kg, equivalent to 1.8991 ton ha−1 during 4 months of observation at the peak of the rainy season.
This study found that a higher runoff accumulation occurred in the deposition zone compared to the residual, erosion, and transition zones (Figure 4). This higher runoff increases the erosion of the soil surface around the rills so that the shape of the rill erosion becomes wider and deeper (Shen et al., 2015), as shown in Figure 6.

Illustration of the arrangement of agricultural reservoirs in the study area.
The agricultural reservoirs at the measurement location were interconnected from the top to the bottom along the rill erosion (Figure 6). The agricultural reservoirs located along the rill erosion were intended to allow the runoff and sediment that cannot be accommodated in the top to be trapped in the lower agricultural reservoirs. The runoff and sediment were mostly accommodated in the agricultural reservoirs, thereby decreasing the amount of runoff and sediment released from the outlet. Runoff and erosion rates were lower on land with agricultural reservoirs than on land without (Han et al., 2018; Masnang et al., 2022; Yu et al., 2019). The agricultural reservoirs function as a sediment trap; thus, they can reduce soil erosion and nutrient loss (Han et al., 2018).
Age of plants and morphological characteristics of land cover affect the amount of erosion. Cassava plants (Figure 6), as land cover plants at the measurement location, have finger-shaped single leaves. Because of the young age of these plants, which was only 1 to 3 months, the plant cover had almost no effect on reducing rainfall erosivity. Denser land cover can reduce the impact of raindrops and reduce the amount of erosion (Devianti, 2018). The higher kinetic energy of rainfall increases the destructive power of soil aggregates (Harjianto et al., 2015). Meanwhile, under the same rainfall intensity and vegetation type, an increase in land cover can reduce runoff (Zhao et al., 2019). High runoff has a high carrying capacity, thereby increasing sediment delivery.
The agricultural reservoirs built along the rill erosion effectively reduced runoff and sediment delivery (see Tables 3–5). Agricultural reservoirs can accommodate sediment transported by runoff, decreasing the sediment released from the outlet. After these reservoirs were constructed, the sediment carried from the outlet was reduced by 96.51% from the previous study by Hadini et al. (2021). The runoff volume after constructing the agricultural reservoirs was reduced by 99.76% compared to the previous study by Kurniawan (2019) when agricultural reservoirs had not been built. Compared to Kurniawan (2019), the decrease in erosion rate after the construction of agricultural reservoirs reached 99.98%.
The substantial decrease in runoff and erosion rate showed that the placement and volume of the agricultural reservoirs adjusted to the amount of erosion at the measurement location made the effectiveness of the reservoirs is high. The results of this study are strengthened by Tarigan et al. (2016) studying erosion using a SWAT model approach, which shows that the effectiveness of agricultural reservoirs in a watershed in controlling runoff depends on their placement.
Conclusion
Agricultural reservoirs are effective to be implemented in small catchment areas such as the Bompon Sub-Watershed. However, in a larger area, the practical limitation would be arisen since we have to ensure where the runoff comes from in order to calculate the soil erosion rate in a particular area. More source of runoff is possible to occur at the larger area. The arrangement of agricultural reservoirs that were interconnected from the top to the bottom along rill erosion was proven to effectively reduce the amount of soil loss due to runoff. Agricultural reservoirs can trap sediment transported by runoff and decrease sediment released from the outlet. This capability substantially reduced the erosion rate at the measured location. For future direction, implementing some treatments along the rill erosion are required to compare the effectiveness of existing agricultural reservoirs. Furthermore, the farmers’ willingness to construct more reservoirs for trapping more sediment in the sub-catchment area arose. The farming communities do not feel disadvantaged eventhough agricultural reservoirs construction reduce their cultivation areas, as they derive greater benefits from the use of water and sediment resulting from agricultural reservoirs.
Implications for Conservation
A agricultural reservoir is a conservation method that can trap sediment to reduce soil loss. This capability helped reduce runoff and sediment to maintain the productivity of agricultural land. Our results emphasize the importance of determining the arrangement of agricultural reservoirs so that their effectiveness in reducing soil loss is maximized. Placing agricultural reservoirs along the rill erosion substantially increased their effectiveness in trapping sediment, reducing volume of runoff, and lowering erosion rate.
Sediment trapped in the agricultural reservoirs provide benefits for cultivation activities in the land. It is because runoff carried on topsoil material into the agricultural reservoirs, which possesses a high nutrient content. The agricultural reservoirs’s trapped sediment exhibits a higher organic content (Mujilestari, 2022) than the subsurface soil material at the research site (Damayanti, 2022; Yahya, 2021). Farming communities periodically return the sediment to the land to redistribute eroded nutrients into the soil (Bohluli et al., 2014; Robotham et al., 2021). Additionally, water collected in the agricultural reservoirs is also used by farmers for irrigation during the dry season, ensuring adequate water availability to meet crop needs and enhance agricultural productivity. Therefore, despite some of their cultivation areas are reduced due to agricultural reservoirs construction, the farming communities do not feel disadvantaged as they derive greater benefits from the use of water and sediment resulting from agricultural reservoirs.
Footnotes
Acknowledgements
The author would like to thank to Transbulent research team for their help and support during the field survey. This publication is a part of Bachelor thesis of first author which was carried out with the title of “The Effectiveness of Pits in Controlling Surface and Sediment Runoff in the Upstream Sub-Watershed of Bompon, Magelang.” A considerable improvement to this article was made by the second and the third authors, particularly in the discussion part.
Author Contributions
Jihan D.I wrote the manuscript, carried out the field survey and laboratory analysis; Nur Ainun H.J.P. contributed to wrote the manuscript, to analyze and do interpretation of the results; Junun S contributed to supervise the findings of this work. All authors provided critical feedback, helped shape the research, and contributed to the final manuscript.
Declaration of Conflicting Interests
The author(s) declared no potential conflicts of interest with respect to the research, authorship, and/or publication of this article.
Funding
The author(s) disclosed receipt of the following financial support for the research, authorship, and/or publication of this article: This research was partially funded by Research Grant 2022 from the Research Center for the Environment, Universitas Gadjah Mada. This research was also partially supported by National Research and Innovation Agency 2023 under scheme of Riset dan Inovasi untuk Indonesia Maju (RIIM) Batch 4, with ID number 196 (Decree Number 37/II.7/HK/2023) for publication.
Availability of Data and Material
Please contact the authors for any data requirements.