
Abstract
Advanced oxidation processes based on photocatalytic generation of •OH radicals have emerged as promising technologies for the removal of recalcitrant pollutants in water. However, their poor recyclability has reduced their potential large-scale application. Herein, a Fe3O4-embedded ZnO system has been prepared and its photocatalytic •OH radicals activity was evaluated by monitoring the photo-assisted bleaching of p-nitrosodimethylaniline (pNDA). Water disinfection performance was determined by measuring Escherichia coli inactivation under different conditions. Bleaching of nearly 80% of the initial pNDA concentration after just 120 minutes under UV365nm irradiation was determined. Bacterial inactivation at different concentrations (0.1, 1.0, and 5.0 mg mL−1) of the Fe3O4/ZnO nanocomposite was determined, finding that the best performance was obtained at 0.1 mg mL−1 (90%) just after the first 30 minutes under UV irradiation. The materials are easily magnetically recovered and their performance evaluated after 3 consecutive cycles of reuse. These magnetic and photoactive nanocomposites showed improved performance and could be used for wastewater treatment or disinfection processes of water.
Keywords
Background
The World Health Organization has stated that infectious diseases are the third largest cause of mortality in the world. 1 In addition, the growing global population rises pollution and the demand for clean water, which has led to an increase in waterborne disease outbreaks.2,3 To ensure drinking water to all people, water must be treated and disinfected to avoid health issues. Unfortunately, pollutants in water such as dyes,4-6 hydrocarbons,7-9 other xenobiotic compounds,10-12 as well as pathogens have proven to be resistant to conventional treatments. The lack of an adequate disinfection process leaves many areas with unsafe drinking water, favoring waterborne diseases. 13 Among specialized technology to solve the fact that novel pollutants persist in wastewater, Advanced Oxidation Processes (AOPs) serve as an attractive alternative to eliminate xenobiotic compounds, which are among the most effective methods to obtain safe drinking water. 14
The oxidation process occurs when reactive oxygen species (ROS), such as hydroxyl radicals (•OH), interact with other chemical species.15,16 These radicals are not selective and attack directly other molecular structures transforming them into less dangerous by-products. Semiconductor-assisted photochemical reactions are useful for its high degradation capacity toward recalcitrant pollutants and favor the •OH generation, making it a simple and cost-effective method.4,17,18 Our interest in •OH generation is due to the fact that is one of the most important oxidants for bacteria and other water pollutants, according to its oxidation potential (E0 = +3.06 V), 19 which may lead to the partial or full oxidation of organic matter. The •OH radicals are formed on the surface of a photocatalyst, where they can be trapped by other molecular species, leading to oxidation of such specie. 20 Many current advanced oxidation methods exploit •OH as a way of attaining bacteria inactivation.
ZnO is a widely used semiconductor for photocatalysis; it presents a wide band gap (3.37 eV)19,21 in the near-UV spectral region, has a strong oxidation capacity, is insoluble in water, and is economically affordable.13,22,23 The ability to produce ROS in aqueous solutions under UV irradiation24,25 makes ZnO one of the most popular materials for the design of innovative AOPs for wastewater treatment. However, the recovery of the photocatalyst for being reused remains a complex challenge, and losses of the catalyst can become sources of new polluting material into the environment. A practical approach to confront this problem is to attach to the photocatalysts a magnetically active component, making the material easily recovered with the help of an external magnetic field.26-29 This will not only prevent the loss of the material, but also may facilitate its reuse on further wastewater treatment cycles. 21 Coupling ZnO with a magnetic matrix, such as Fe3O4, is an attractive alternative that has been recently explored.29,30 However, recyclability of these structures needs to be evaluated.
In this work, magnetic Fe3O4 nanoparticles embedded into a photoactive ZnO coating have been prepared. To determine whether the synthesized nanoparticles have the potential to be used in water treatment, the photocatalytic performance of these nanostructures were tested with 2 assays: (1) their ability to photo-bleach p-nitrosodimethylaniline (pNDA), a selective •OH probe compound that has been extensively reported in the literature; and (2) the bacterial inactivation performance toward Escherichia coli under UV365nm irradiation as an method to assess the disinfection capacity. These assays were compared with the performance of the individual components, ZnO and Fe3O4. Also, the magnetic photocatalytic nanocomposite was recovered using a permanent magnet, and its performance on pNDA bleaching under UV365nm irradiation was compared after 3 consecutive cycles of use.
Materials and Methods
Chemicals and materials
All reagents (FeCl3∙6H2O, FeCl2∙4H2O, NH4OH, Zn(Ac)2∙2H2O, LiOH∙H2O, and solvents such as ethanol) were reagent grade and obtained from Sigma-Aldrich Co. and used as received without any further purification. In all procedures, triple distilled water (TDW) was used. To minimize magnetic-induced agglomeration of the magnetic nanoparticles, all stirring in the experiments were performed at 1000 r/min using a lab-made, non-magnetic thin stainless-steel wire embedded in a small diameter glass tube, flame-sealed at the extremes, instead of regular magnetic bars. For the recovery of the magnetic materials, a circular disk permanent Nd magnet (diameter = 5 cm), with a magnetic field of 11 800 Gauss.
Synthesis of ZnO nanoparticles
Photocatalytic ZnO nanoparticles were prepared by the alkaline hydrolysis of Zn(Ac)2∙2H2O mixed with LiOH∙H2O with a molar ratio of 1:2 under ethanol and heated to 80°C for 5 hours. After cooling down at room temperature (25°C), the product was recovered by centrifugation at 5000 r/min and dried in a vacuum oven at 60°C overnight.
Synthesis of Fe3O4 nanoparticles
The magnetic particles were prepared by a co-precipitation method, previously used in our group. 31 Typically, FeCl3∙6H2O 0.2 M and FeCl2∙4H2O 0.1 M aqueous solutions were prepared. Afterward, equal volumes of both solutions were mixed and stirred for 5 minutes. Then, concentrated NH4OH was rapidly added to the solution with vigorous stirring, forming a black solution. After 1 hour of continuous stirring, the black precipitate was magnetically decanted and washed several times with TDW until the solution was stabilized at pH = 7.0. The black material was finally dried in a vacuum oven at 60°C overnight. The black material was carefully grinded manually and stored for further use.
Synthesis of Fe3O4/ZnO nanocomposite
The magnetic/photocatalytic nanostructured composite was prepared according to a previously reported method with minor modifications. 28 After Fe3O4 nanoparticles were synthesized, the black precipitate was washed several times with water, and redispersed under sonication in ethanol (96%). Then, the suspension was mixed with Zn(Ac)2∙2H2O and LiOH∙H2O with a molar ratio of 1:2:4 under ethanol using a magnetic bar into a glass capsule. The mixture was transferred into a flask and kept at 80°C for 5 hours under stirring. After cooling down to room temperature (25°C), the product was separated with a permanent magnet and washed 3 times with ethanol and water (until pH was 7.0), and finally dried in vacuum oven at 60°C overnight.
Characterization of nanocomposite
The particle size distribution was determined in solution via dynamic light scattering (DLS) with a Nanotrac Wave II (Microtrac, Montgomeryville, PA, USA) instrument, at room temperature in water as dispersing media, using a laser of 780 nm and working with a power intensity of 3 mW for 60 seconds. Samples were obtained by dispersing the materials in TDW using an ultrasonic bath for 20 minutes before analysis, and 1 mL aliquot of the supernatant was used for the analysis. Fourier transform infrared (FTIR) spectra were recorded for dried, grinded solids on a Cary 630 (Agilent, Santa Clara, CA, USA) spectrophotometer equipped with an attenuated total reflectance detector, and recorded in the 4000 to 400 cm−1 region. Photoluminescence (PL) measurements at room temperature were performed on a Fluoromax-3 (Horiba, Kyoto, Japan) spectrophotometer. Samples were excited with a 330 nm wavelength source (3.7 eV). Spectra were deconvoluted with the application of a multipeak Gaussian adjustment. Morphological analyses were performed using a MAIA (Tescan, Brno, Czech) field emission scanning electron microscope working at 20°kV and equipped with a Bruker Quantax (Bruker, Billerica, MA, USA) energy-dispersive spectrometry (EDS) detector. Samples were deposited on graphite conductive tape on an aluminum pin and dried at room temperature prior the analysis.
Photocatalytic activity evaluation
The generation of hydroxyl radicals (•OH) was followed using the pNDA bleaching assays; this reaction has 1:1 stoichiometry, meaning that one •OH can bleach one pNDA molecule. 32 The scavenging agent pNDA is well known for its highly selectively trapping of •OH over other ROS species (singlet oxygen, superoxide anions, or other peroxides) with a high reaction rate (order of 1010 M-1 s−1) for the formation of •OH radicals.32-34
In a typical photo-bleaching experiment, 1.0 mg mL−1 of the synthesized NPs was dispersed in 40 mL of 10 μM pNDA (distillated water base) and kept inside in a closed dark box under continuous stirring and 3 different conditions: no light (dark), UV irradiation, and white light irradiation. Under dark conditions, samples were kept away from any light source; under UV irradiation, samples were illuminated by an UV365nm lamp (Cole Parmer, 03402-10, USA; UV-A) of 100 W (UVP, B-100AP), and under white light samples were illuminated by a commercial fluorescent lamp of 15 W (Technolite, F15T8D, 610 lumen, Mexico) with a continuous emission spectrum from 380 to 750 nm. 35 The experimental setup is illustrated in Figure 1B.
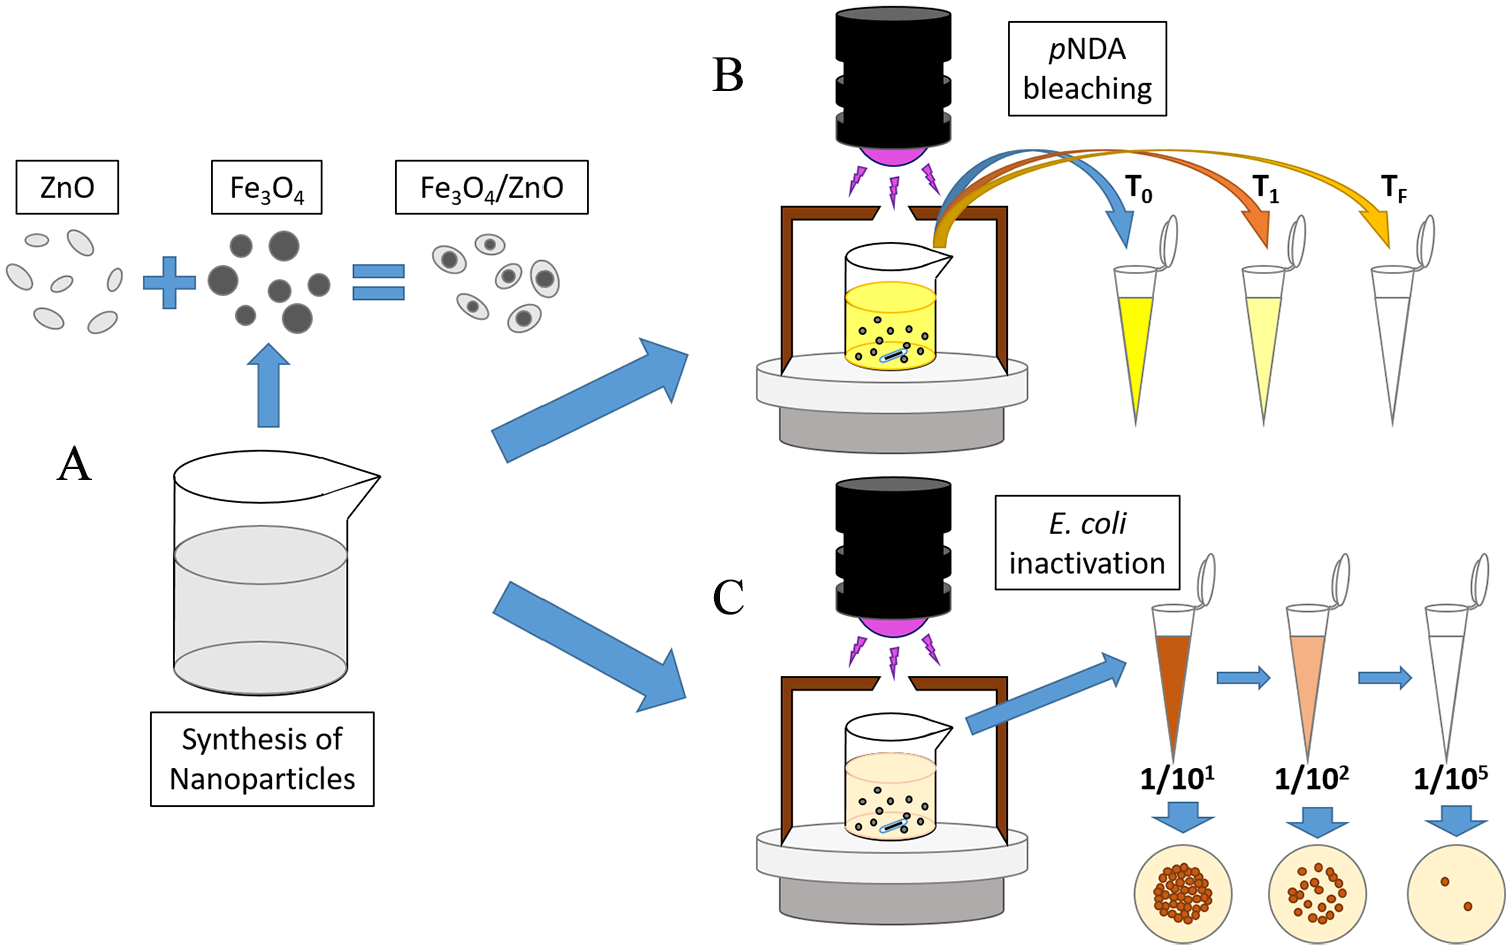
Schematic representation of the methodology of this study: (A) synthesis of the different nanomaterials; (B) photocatalytic assay: pNDA bleaching under UV365nm irradiation, aliquots taken at various times; and (C) antibacterial activity assay: Escherichia coli inactivation under UV365nm irradiation, samples taken at various times and serial diluted prior incubation. pNDA indicates p-nitrosodimethylaniline.
Aliquots of 1.0 mL were taken at 0, 15, 30, 60, 90, and 120 minutes and stored in 1.5 mL Eppendorf tubes away from any light source to reduce the effect of residual light. For a fast collection, aliquots were centrifuged at 10 000 r/min for 10 minutes to precipitate any remaining catalysts, to avoid nanoparticulated material interfere with the UV-Vis lecture. The concentration of pNDA in solution for each one of the aliquots was measured using a UV-Vis spectrophotometer Hatch DR/4000U at 440 nm, which correspond to the wavelength for pNDA following Beer’s law.36-38 To determine the •OH generation efficiency of the NPs, the statistic software R was used to fit the data into a linear equation as indicated by equation (1):
where BE is the bleaching efficiency, A0 the initial absorbance and At the final absorbance for each time. All assays were performed by triplicate to report the average of each result.
Bacterial inactivation assay
To evaluate the bacterial inactivation properties of the NPs, a fresh culture of E coli ATCC 25922 was used. The culture was obtained from the strain collection of the Microbiology Research Laboratory at Universidad de las Americas Puebla, stored in glycerol (20%) at −80°C and later cultured in Petri dishes containing MacConkey agar (Bioxon) to confirm the classical E coli phenotype. The strain was cultured in 10 mL of LB broth (bacto-tryptone 10 g, yeast extract 140.5 g, NaCl 5 g, pH 7.2) and incubated overnight to have the culture on logarithmic phase for use in each assay. Before each experiment, the culture was centrifuged at 5000 r/min for 10 minutes, the supernatant was discharged, and the pellet (cells in the bottom of the tube) was rinsed with saline isotonic sterile solution (SISS) (NaCl 0.85%), then adjusted the cell concentration suspending the pellet with SISS to a similar turbidity of tube No. 2 of the McFarland standard, which corresponds to ~6 × 10⁸ CFU.
The experimental setup is illustrated in Figure 1C. A glass beaker containing 10 mL of TDW, a lab-made stainless-steel wire embedded in glass, and nanocomposite (0.1, 1.0, or 5.0 mg mL−1) was previously sterilized using a UV lamp of 260 nm for 30 minutes to reduce other possible microbial contaminants. For the photo-inactivation, the system was set below an UV365nm lamp of 100 W at 20 cm of distance corresponding to 576 μW cm−2. It is important to mention that at this UV wavelength bacteria are not inactivated. 39 An amount of 100 μL of the previously adjusted bacterial suspension was added to the system corresponding to a final concentration of approximately 6 × 10⁶ CFU. Samples of 100 μL were taken at different times (0, 5, 10, 15, 30, 45, and 60 minutes; for some experiment samples were taken each minute during the first 10 minutes) and added to 0.9 mL of SISS. Each sample was then serial diluted 4 more times (1:10) until 1 × 10⁻⁵ using SISS. Afterward, from each dilution, 10 μL was dropped, with a respective duplication, onto the nonselective media “tryptic soy agar” (Bioxon: agar 15 g L−1, casein peptone (pancreatic) 15 g L−1, NaCl 5 g L−1, soy peptone (papainic) 5 g L−1) plates. All plates were incubated at 37°C overnight and colonies were counted. Considering that the number of counted colonies correspond to the number of cells in the sample (as each cell after incubation develops a colony), all calculations (and graphs) were based on counted colonies. As the number of cells in the beginning of each run are not exactly the same, all calculations were normalized using equation (2):

where N0 is the initial number of cells at the beginning of the experiment and Nt is the number of cells at the t time analyzed. The inactivation efficiency was calculated using equation (3):

where IE is the inactivation efficiency, N0 the number of cells at the initial time, and Nt the number of cells at the end of each time t. All assays were performed by triplicate to report the average of each result.
Results and Discussion
Characterization of Fe3O4, ZnO, and Fe3O4/ZnO composite
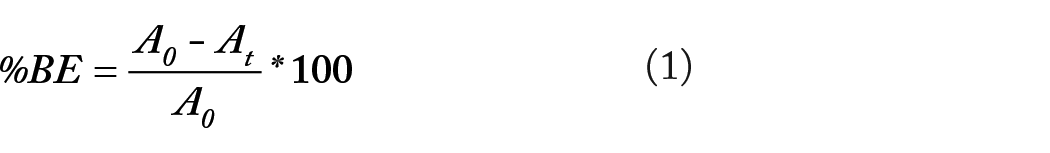
The relative particle size distribution in solution of the different materials in water was obtained by DLS analysis. Figure 2A to C shows the size distribution of the Fe3O4, ZnO, and Fe3O4/ZnO systems, respectively. The size distribution of the Fe3O4 NPs (Figure 2A) was in the range of 400 and 1100 nm, having an average size of 566 nm. For the Fe3O4/ZnO composite, the average size was 466 nm, whereas the ZnO NPs had a size distribution was between 90 and 630 nm with an average size of 580 nm. The zeta potential (ζ) values at neutral pH for the prepared materials were of ζ = + 1.8 mV for Fe3O4, whereas Fe3O4/ZnO showed a ζ = −7.7 mV, and ζ = +3.3 mV for ZnO. These results indicate that the prepared particulate systems tend to agglomerate due to their ζ being near zero. This implies that particles have very low surface charge, not enabling electrostatic repulsion between them, resulting in agglomeration. 40
Particle size distribution determined by DLS of (A) Fe3O4, (B) ZnO, and (C) Fe3O4/ZnO, in water at room temperature, pH = 7.0. DLS indicates dynamic light scattering.
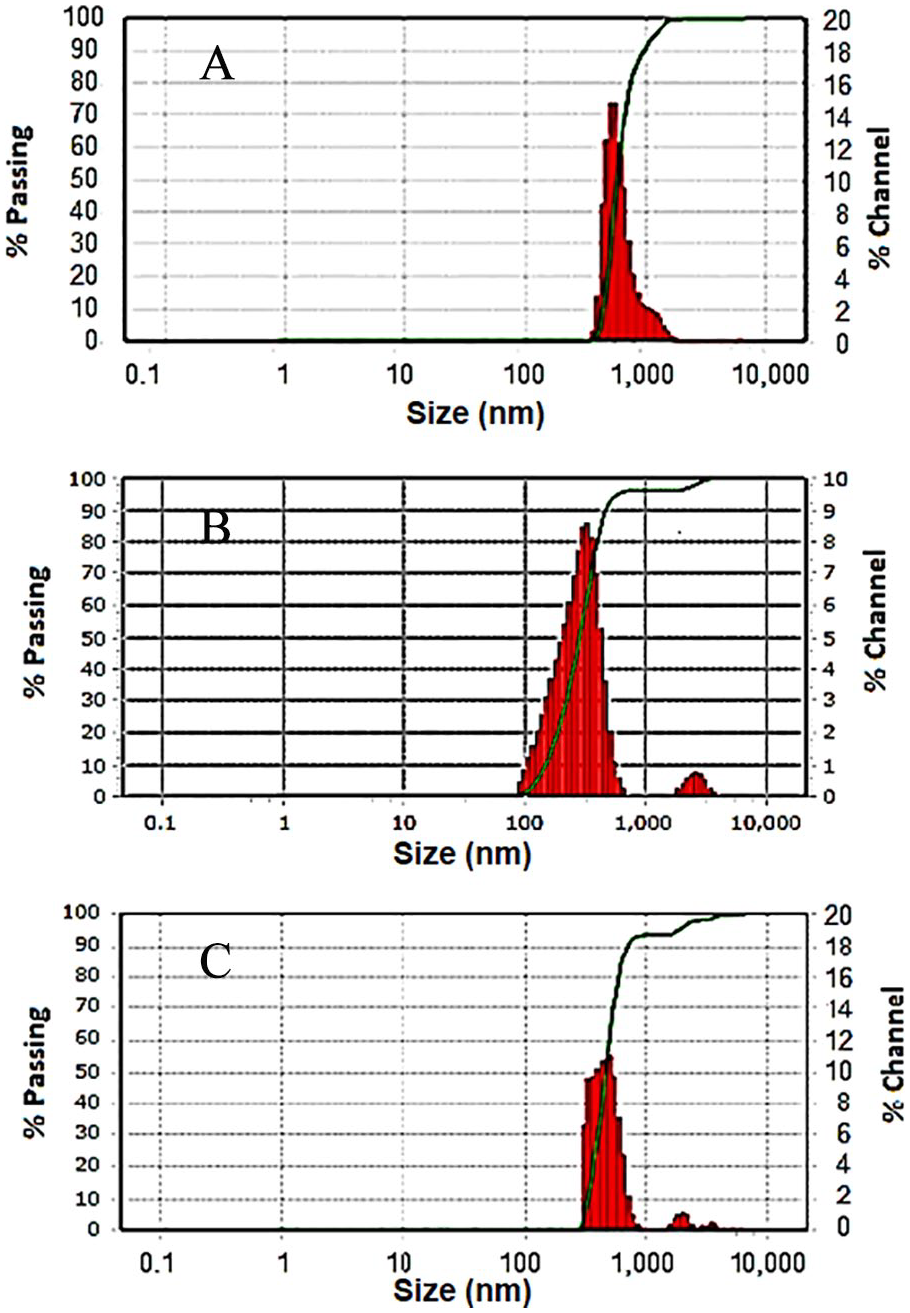
The FTIR spectra for Fe3O4, ZnO, and Fe3O4/ZnO are depicted in Figure 3. According to previous reports, ZnO FTIR spectra are influenced by size and morphology. 41 As a metal oxide, ZnO gives absorption band fingerprints below 1000 cm−1, which correspond to inter-atomic vibrations. The peaks at 1040 cm−1 of Figure 3C and the peak around 563 cm−1 in both Figure 3B and C correspond to the characteristic absorption peaks of Zn-O bonds, which confirms the presence of ZnO,25,41,42 whereas 462 cm−1 corresponds to Zn-O stretching which can hint a wurtzite structure. 43 The characteristic peak associated with Fe-O stretching at 540 cm−1 wurtzite structure 45 in Figure 3A is clear and intense, but it was not observed in Figure 3C, which may be an indication that this material is underneath the ZnO shell. Finally, it is worth mentioning that the most prominent bands of Fe3O4/ZnO correlate with another reported spectrum for another synthetic route of the same material. 46
FTIR spectra of (A) Fe3O4, (B) ZnO, and (C) Fe3O4/ZnO. FTIR indicates Fourier transform infrared.
Photoluminescence emission spectra for Fe3O4/ZnO, ZnO, and Fe3O4 at room temperature with deconvoluted peaks are shown in Figure 4. For ZnO (Figure 4B), the emission band of 3.22 and 3.16 eV appears, representing the near band edge electron transition. Similarly, Fe3O4 (Figure 4A) presented the λmax of 569 nm (2.18 eV) which correlates with previous reports. 44 The spectra of Fe3O4/ZnO (Figure 4C) include emission bands at 3.31, 2.97, 2.23, 2.10, and 1.71 eV. The sharp emission band at 3.31 eV in Fe3O4/ZnO correlates with the slightly shifted emission band for ZnO at 3.22 eV, which is attributed to the near band edge electron transition between bands. This indicates an effective band gap of 3.31 eV for the composite. The broad and intense visible light emission bands at 2.24 eV for ZnO and 2.23 eV for Fe3O4/ZnO are assigned to electronic transitions between levels created by structural defects, impurities, or oxygen vacancies.47,48 It is also noted that the emission band of 3.31 eV in Fe3O4/ZnO is not as intense as other bands in the spectrum, which could mean that the magnetite has an influence on the material and will not surpass the band gap, leading to recombination of the hole/electron pair. This is mostly observed for the composite, suggesting that Fe atoms serve as recombination sites. From what is reported on the literature, 30 PL spectra for Fe3O4/ZnO are associated with defects caused during the synthetic conditions, which is why a few bands may be more prominent.
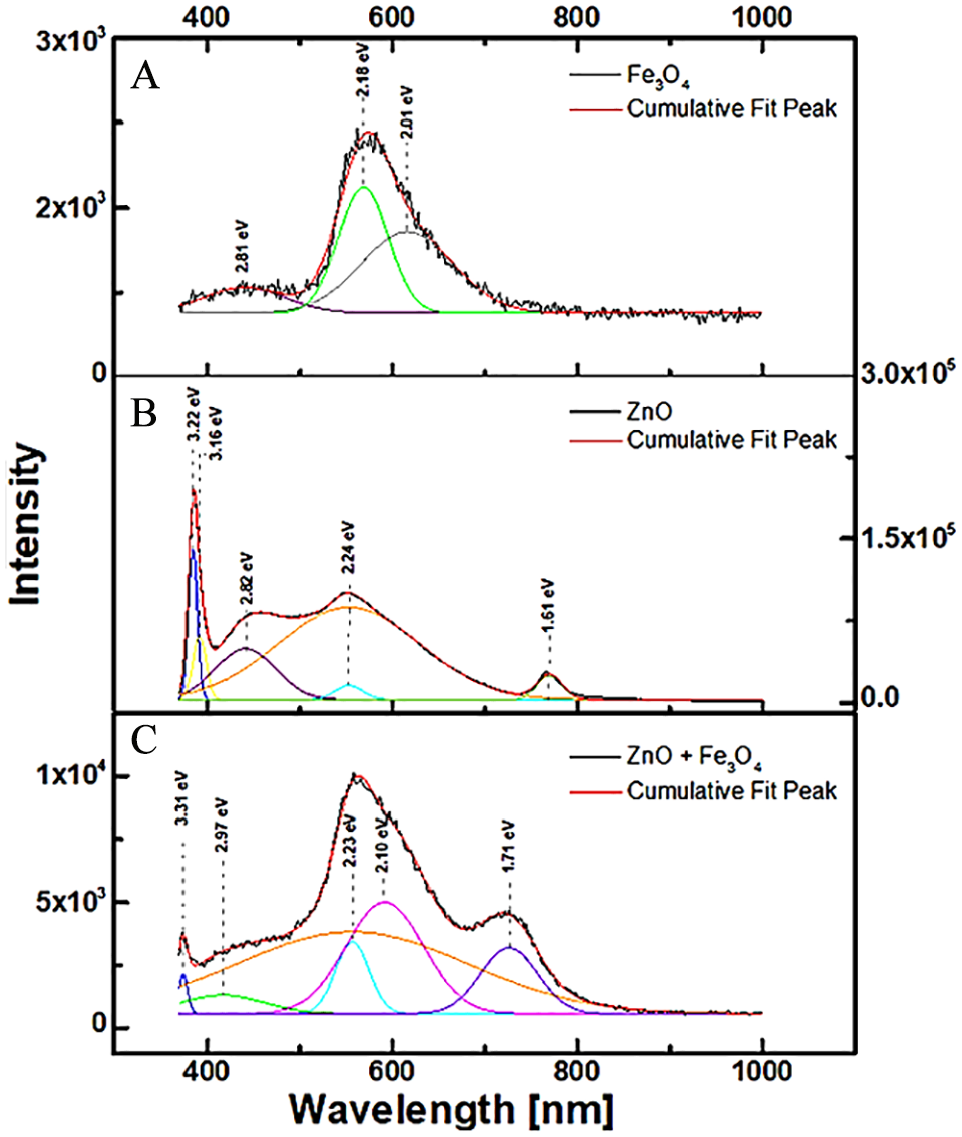
PL emission spectra and Gaussian fit bands of (A) Fe3O4, (B) ZnO, and (C) Fe3O4/ZnO. PL indicates photoluminescence.
Morphology of Fe3O4, ZnO, and Fe3O4/ZnO nanocomposites
The morphology and chemical composition of the different materials was studied by SEM and EDS, respectively. Figure 5A shows a selected image of the as-prepared ZnO particles, which present rod-like structures with a diameter less than 100 nm and lengths of up to 500 nm; there are also other irregular NPs varying from 50 to 200 nm present in the product. The EDS analysis in Figure 5A (inset) shows the presence of Zn and O as expected. The C-band is present due to the use of the graphite tape. Figure 5B features a selected image for Fe3O4, showing round particles of 20 to 50 nm of diameter, most of them mainly agglomerated. Figure 5B (inset) shows EDS analysis, featuring O and Fe signals and residual C-band of the graphite tape.
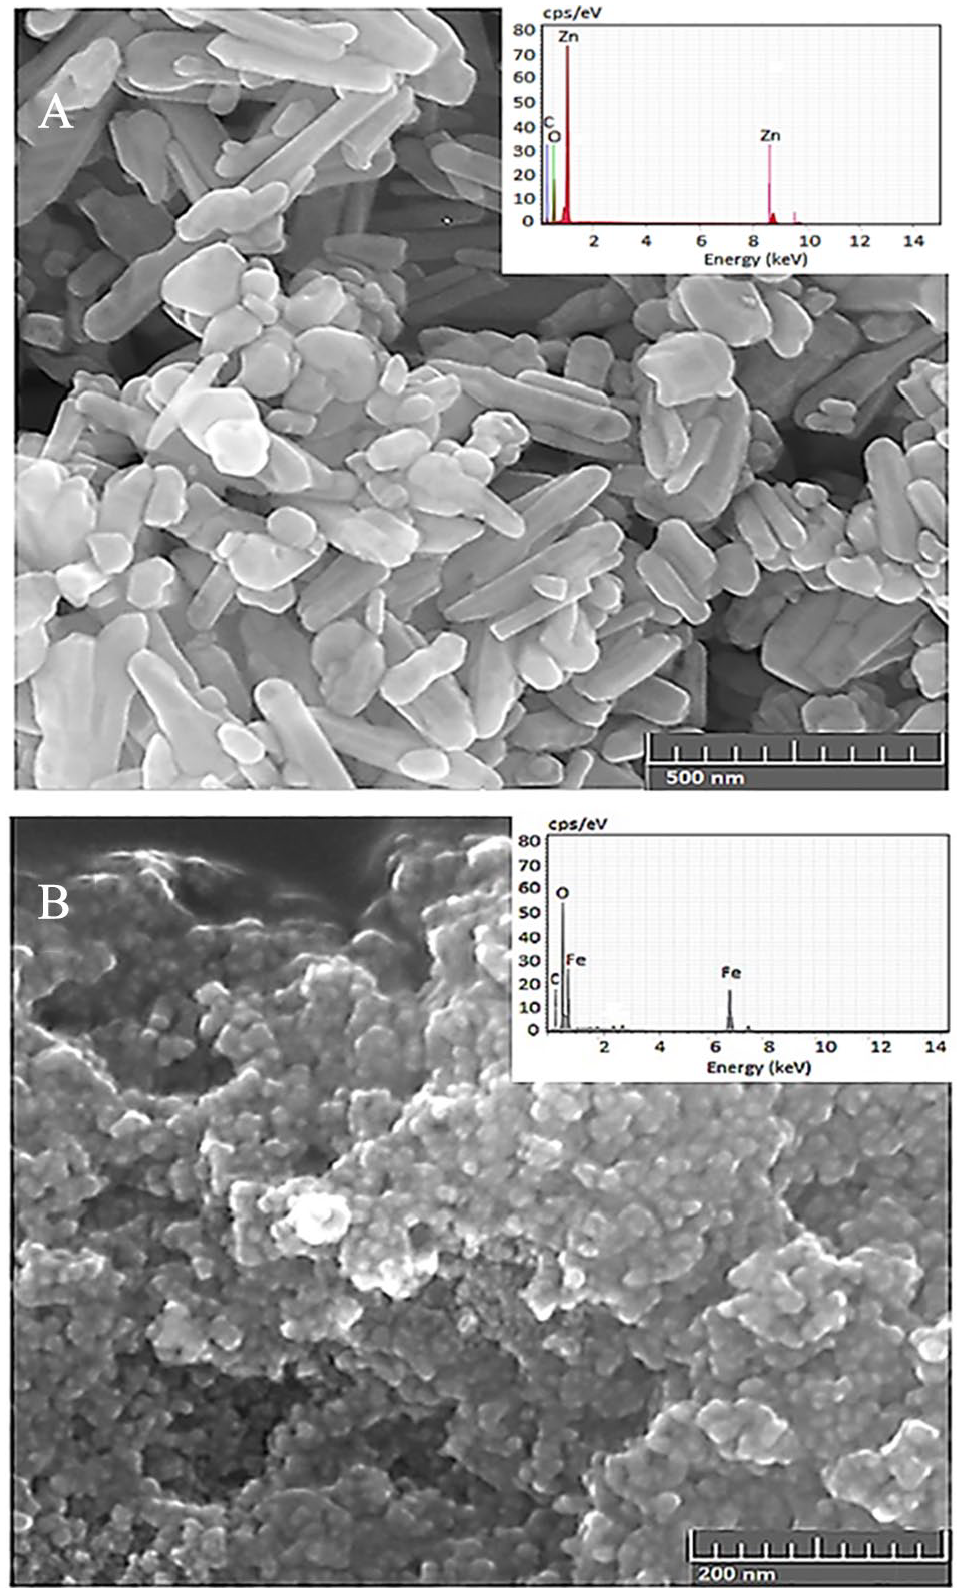
SEM micrographs and their respective EDS analysis (insets) of (A) of ZnO and, (B) of Fe3O4 nanoparticles. EDS indicates energy-dispersive spectrometry; SEM, scanning electron microscope.
For the as-prepared Fe3O4/ZnO, SEM images are presented in Figure 6. These particles are bigger because the ZnO is coating multiple Fe3O4 centers. The EDS analysis (Figure 6 inset) shows C (not labeled), O, Zn, and Fe bands, with atomic % of 65.33, 27.27, 6.49, and 0.92, respectively (C-band belong to the graphite tape). The band appearing at ~1.47 keV is for Al, belonging to the aluminum pin support.
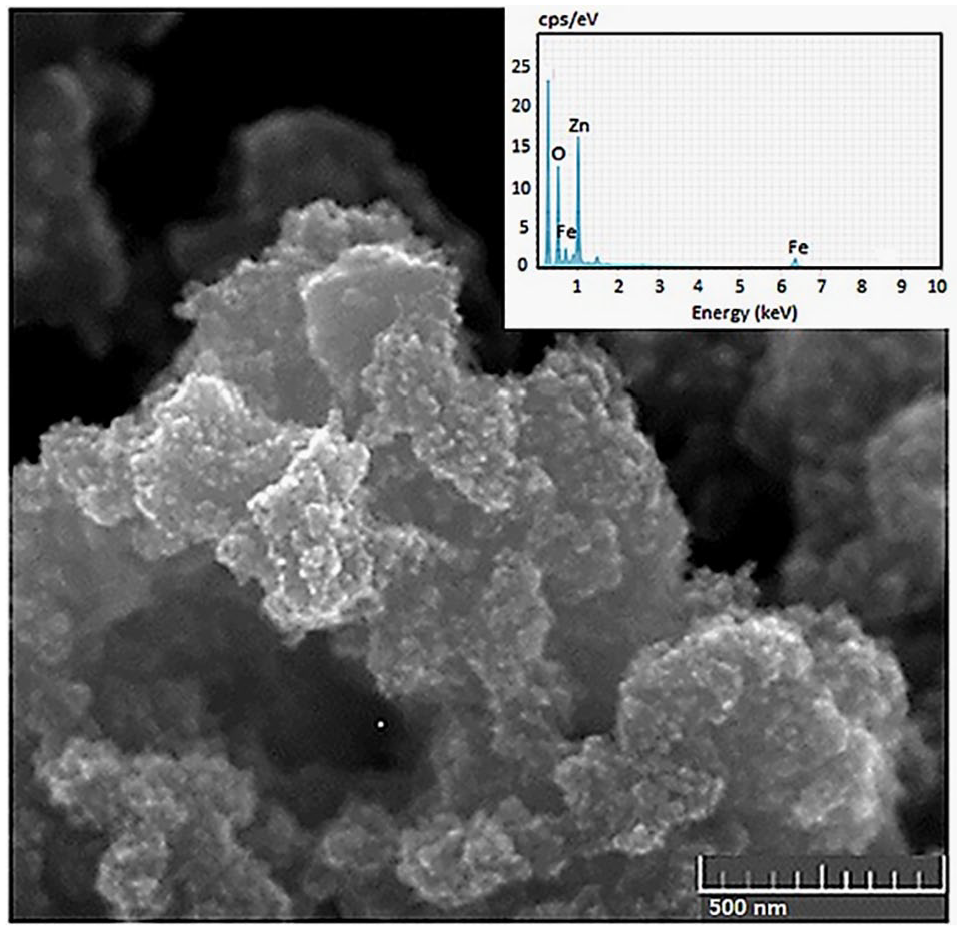
SEM micrograph and EDS analysis (inset) of the Fe3O4/ZnO nanocomposite. EDS indicates energy dispersive spectrometry; SEM, scanning electron microscope.
To determine whether the magnetic nanoparticles were uniformly coated with ZnO, elemental mapping images were obtained for Fe3O4/ZnO (Figure 7). Figure 7A shows the specific mapped area, whereas Figure 7B to D is the elemental mappings for Fe, O, and Zn, respectively. The relative energy intensity for Zn (Figure 7D) is larger than that for Fe, suggesting that the surface of the particles is mainly composed by ZnO. On the contrary, the relatively fainter, but detectable, intensity for Fe (Figure 7B) may be associated with the fact that the Fe3O4 is under the layer of ZnO. Due to the nature of the EDS analysis, the thin ZnO film coating the Fe3O4 nanoparticles may not be thicker than 10 nm, although it may be also coating them partially, leaving uncoated some portions of the surface. Oxygen mapping is intense as that element is present both in ZnO and Fe3O4. Figure 7E shows the result of a linear EDS analysis, which was performed for a selected cluster of the Fe3O4/ZnO NPs (inset of Figure 7E). It can be seen that along the selected linear mapping, the Fe-Kα signal is very low (~5% of the Zn-L signal), which is in agreement with its distribution under the surface of the composite. On the contrary, the Zn-L signal appears very high toward center of the cluster corresponding to its location on the surface of the material. O-K signal is high toward the center as well, which correlates with both ZnO and Fe3O4. Some regions show that the Fe-Kα and the Zn-L signals overlap, indicating that ZnO coating may not be completely homogeneous.
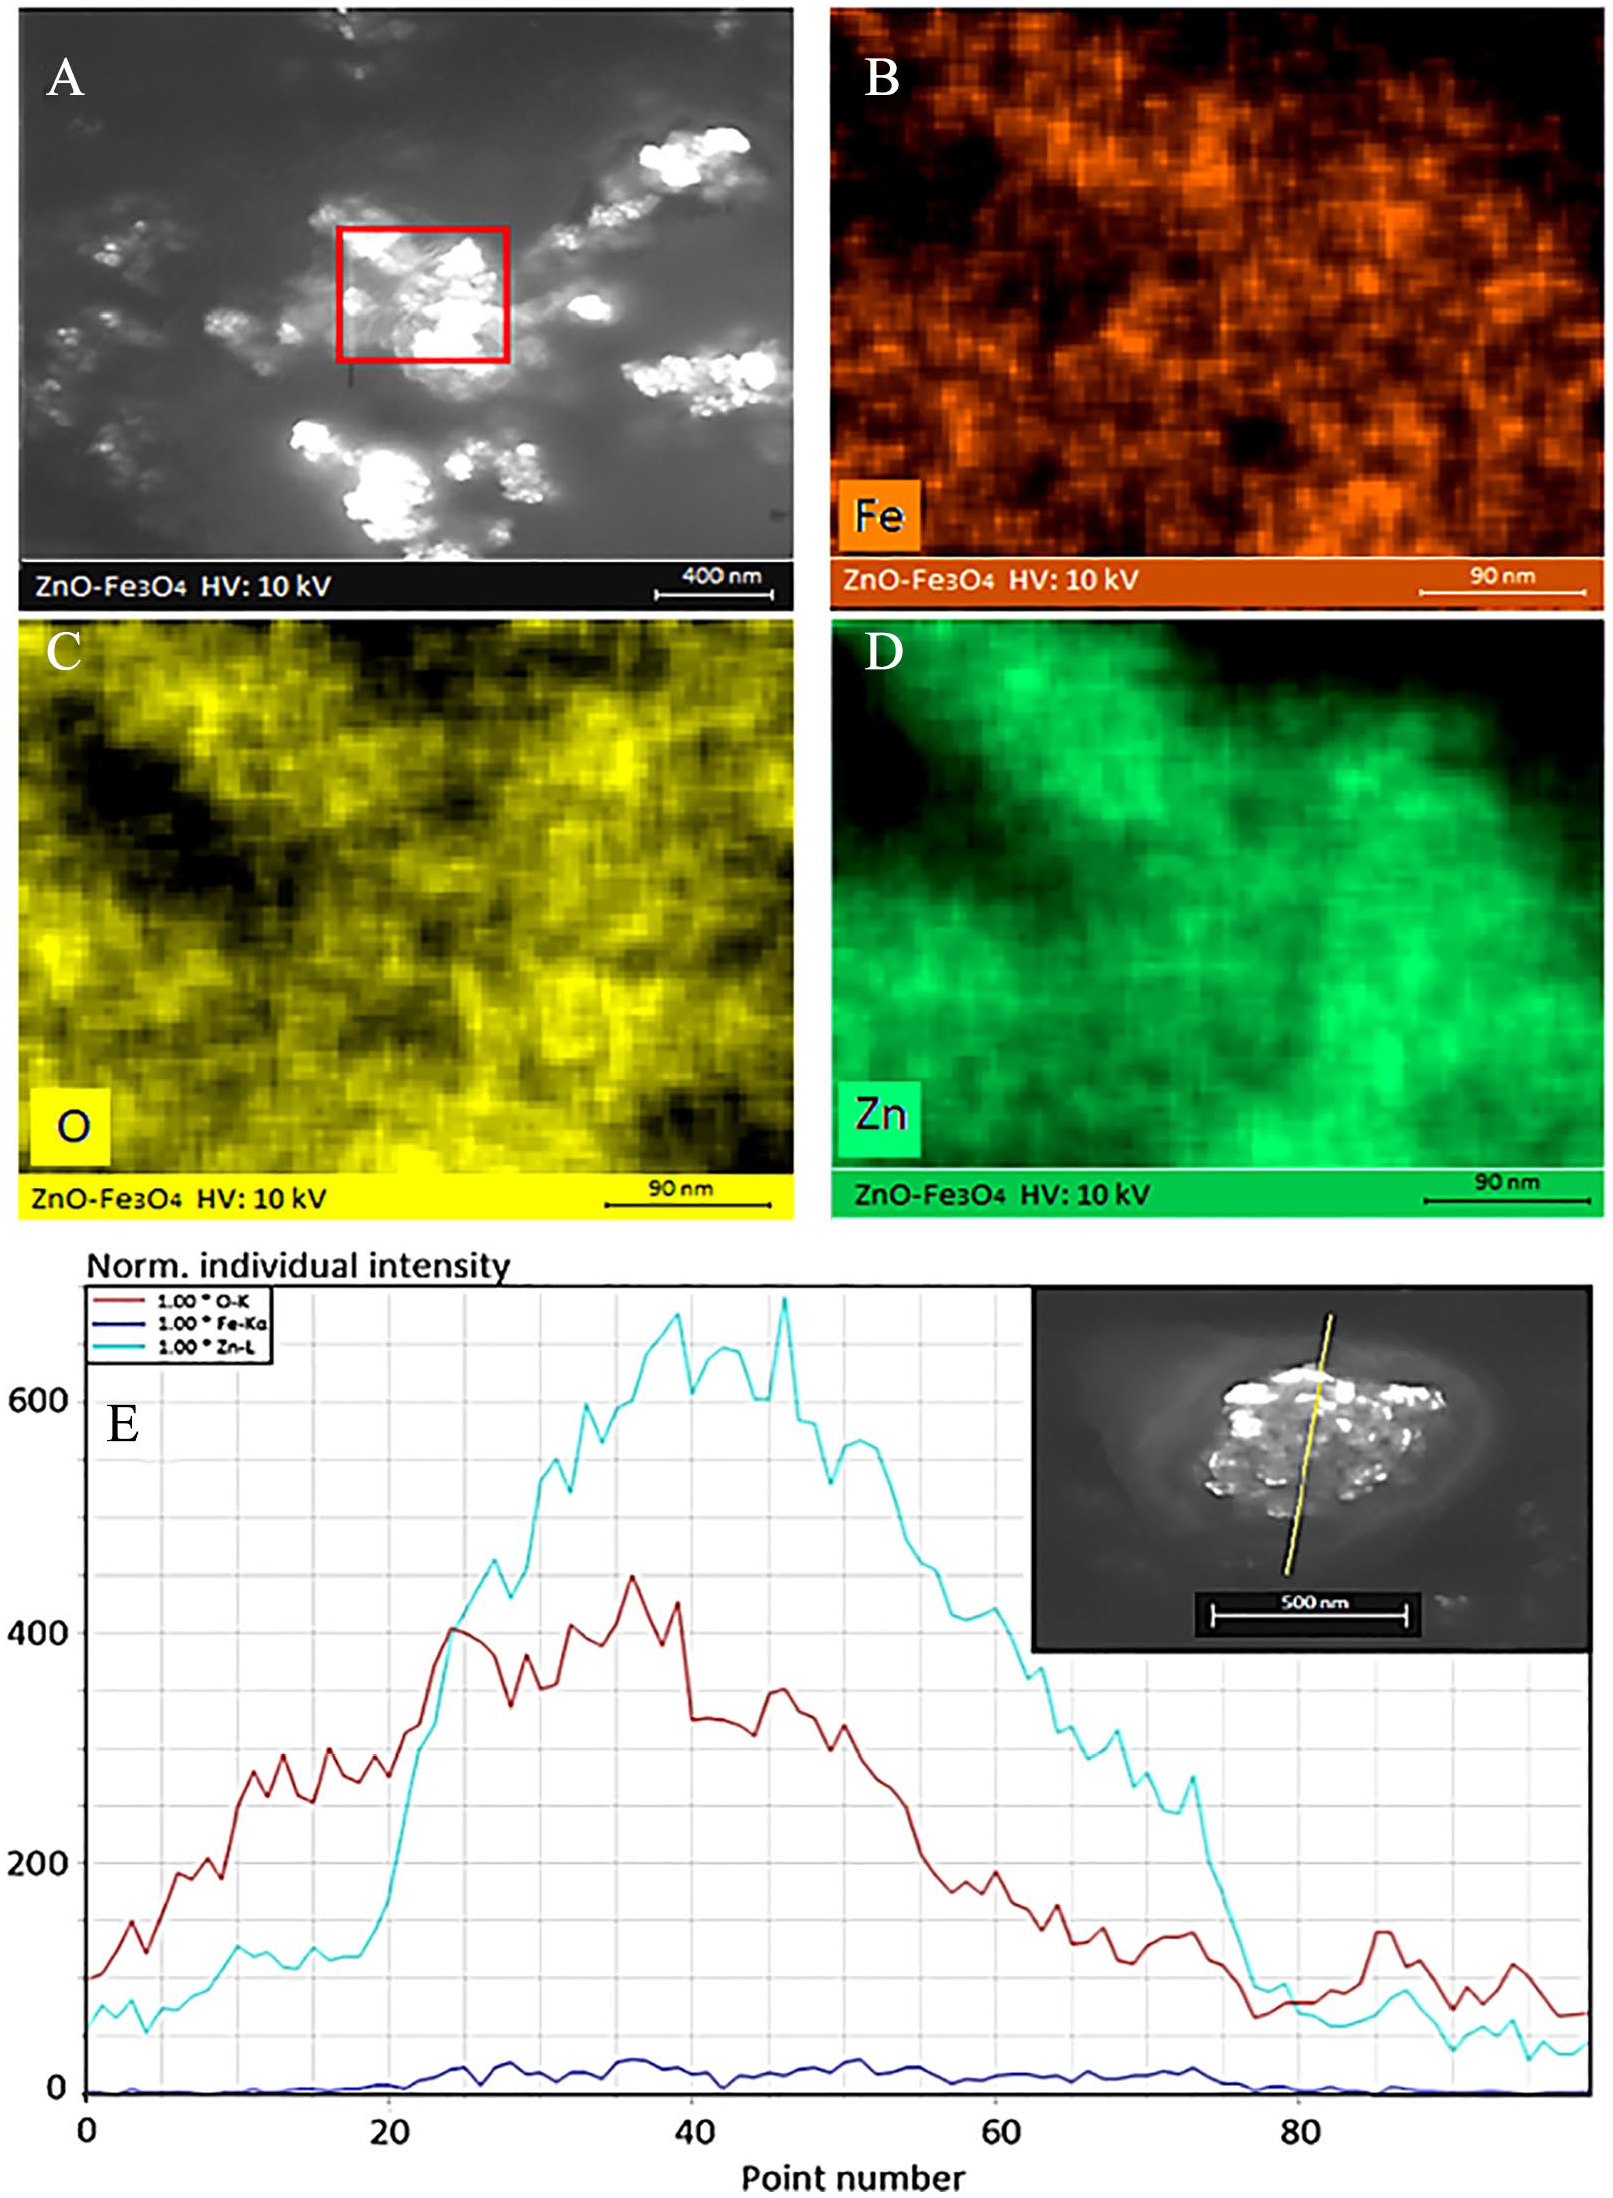
SEM-EDS mapping images for Fe3O4/ZnO: (A) SEM micrograph; (B to D) mapping images of Fe, O, and Zn elements in selected area of (A). (E) Linear EDS analysis of a selected Fe3O4/ZnO cluster (inset) with normal individual intensity of O, Fe, and Zn. EDS indicates energy-dispersive spectrometry; SEM, scanning electron microscope.
Photocatalytic activity: pNDA bleaching
The photocatalytic activity of the prepared magnetic nanocomposites was evaluated by following the bleaching of pNDA in water under different light conditions. Figure 8 shows the results of the assays. As expected, ZnO nanoparticles fully bleached (100%) pNDA in less than 20 minutes under UV light and above 90% after 60 minutes under white light as previously reported. 32 On the contrary, Fe3O4 nanoparticles bleached nearly 19% after 120 minutes under UV light irradiation due to the generation of small amounts of •OH as previously reported. 49 For the Fe3O4/ZnO nanocomposite, it achieved nearly 80% of photo-bleaching after 120 minutes under UV light radiation, while no perceptible effect was observed when the system was irradiated with white light. A possible reason why Fe3O4/ZnO had less bleaching efficiency is that the composite itself contains less amount of ZnO than a pure ZnO sample, and since we used the same concentration in the photocatalytic assays. This seems to be the case as the EDS results indicate that there is Fe3O4 in the nanocomposite, meaning less amount of active photocatalyst.
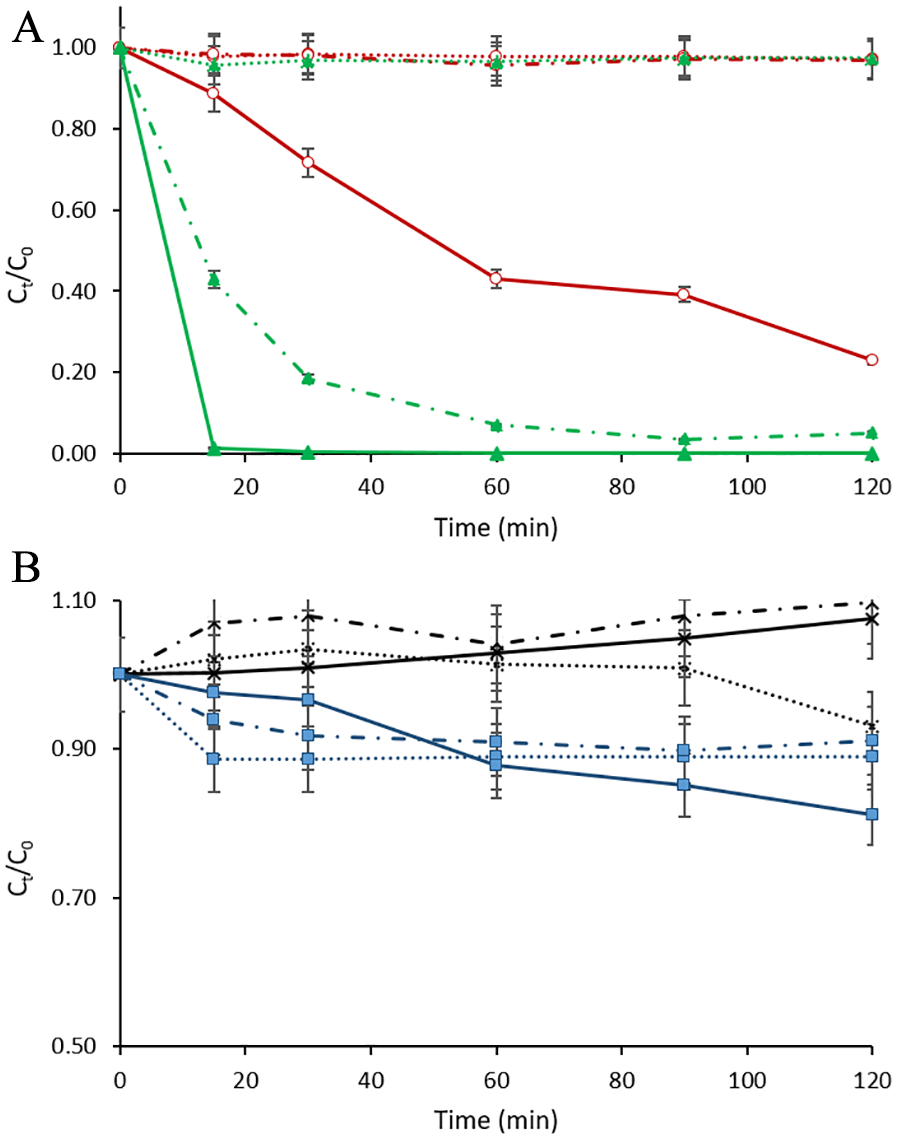
Bleaching of pNDA (1 μM) using Fe3O4, ZnO, and Fe3O4/ZnO at 1 mg mL−1 using different light sources: (A) ▲: ZnO; •: Fe3O4/ZnO; (B) ▖: Fe3O4; X: no NPs (∙∙∙∙∙∙∙∙: No Light; – ∙ – ∙ –: White Light; : UV light). SD = ±0.5.
In all cases, white light irradiation had less favorable results than when using UV irradiation, specifically for Fe3O4/ZnO and Fe3O4, as expected. White light does not favor photocatalysis on ZnO as it does not possess the specific wavelength needed to excite electrons to surpass the band gap. Once again, as there is less amount of ZnO in the Fe3O4/ZnO than in ZnO sample, this may explain why it had less favorable results. Under dark conditions, no degradation of pNDA was observed for either the ZnO NPs or the Fe3O4/ZnO nanocomposite. Only magnetite decreased the concentration of free pNDA in solution in both dark conditions and under white light irradiation and only in the first 15 to 20 minutes, where an adsorption-desorption equilibrium takes place. 50 Adsorption of pNDA may be possible due to magnetite having near-zero ζ (+1.8 mV) and the nonpolar pNDA structure.
Magnetic properties after successive runs were evaluated to test whether the magnetic photocatalysts could be recovered and recycled. By placing a permanent magnet at the bottom outside the flask, all the NPs were attracted to the magnet, making them easy to recover from solution. The NPs were reused 2 more times under the same conditions, previously rinsed with TDW before the follow assay. The photocatalytic activity of the Fe3O4/ZnO nanocomposite did not had any noticeably change, showing a bleaching efficiency of 84% to 89% after 120 minutes in all consecutive assays (Figure 9). These results indicate that this material can be reused without significant loss of its photocatalytic activity at least 3 times and it may maintain its photocatalytic activity after several more cycles. These results are similarly recyclable to previously reported hybrid photoactive nanocomposites.51-53 However, comparison among these reports in terms of efficiency is difficult as they used different photocatalysts and substrates.
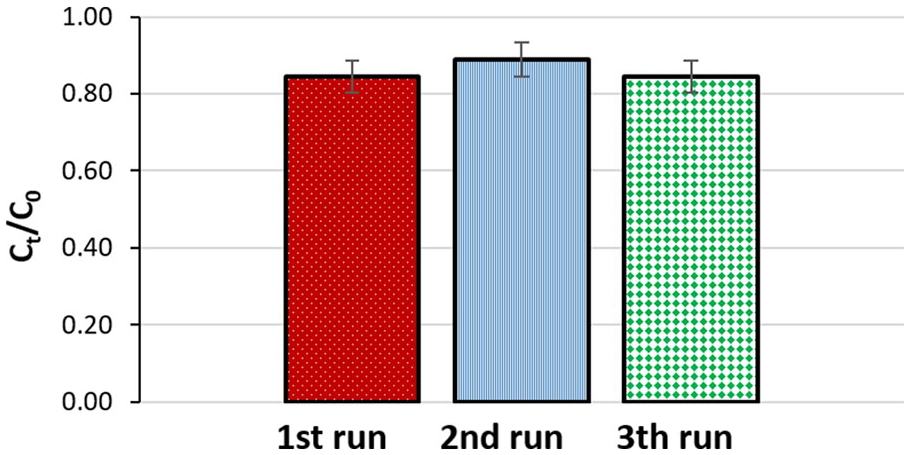
Recycling results of bleaching of pNDA in 120 minutes (1 μM) using Fe3O4/ZnO at 1 mg mL−1. pNDA indicates p-nitrosodimethylaniline.
E coli inactivation
The ability of the different prepared systems to inactivate E coli under different irradiation conditions was evaluated as previously described. As expected, E coli inactivation under dark condition and under white light alone (data not shown) had no effect, which is in agreement with previously reported results.32,54 However, E coli inactivation occurred to some extent when the produced NPs were exposed to UV365nm irradiation (Figure 10). These results could be explained by the ROS generation, which oxidize the E coli membrane, disrupting of enzymatic activity and other vital structures, including chromosomal DNA, inducing cell destruction as reported previously.55-58
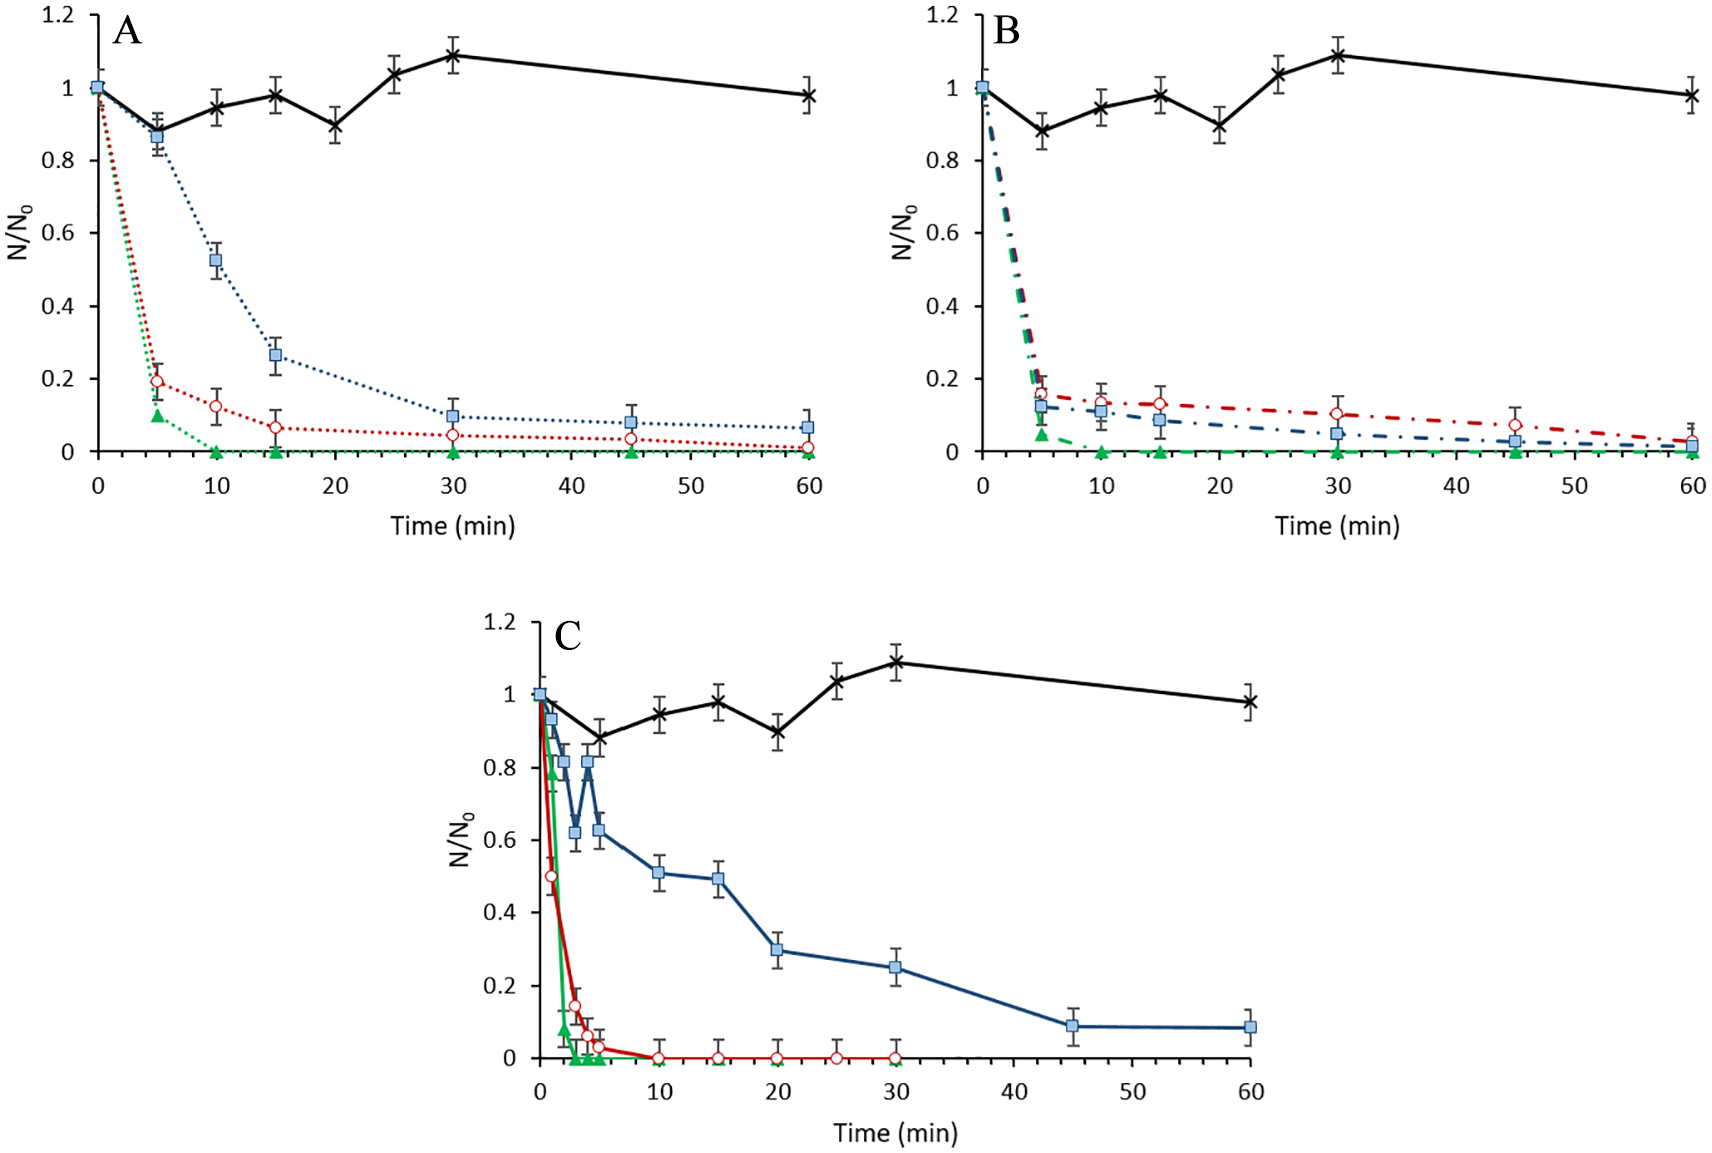
Escherichia coli inactivation under UV365nm light using different NPs and concentrations: (A) 0.1 mg mL−1, (B) 1.0 mg mL−1, and (C) 5.0 mg mL−1. (▖: Fe3O4; ▲: ZnO; •: Fe3O4/ZnO;
Figure 10 shows the inactivation of E coli over the time using different NPs and concentrations. It was observed that using different amounts of photocatalyst used to inactivate the E coli cells affected the inactivation efficiency. When using Fe3O4/ZnO NPs at 0.1 and 1 mg mL−1 (Figure 10A and B), similar inactivation efficiencies were observed, reaching nearly 90% of inactivation after 30 minutes of exposure. In contrast, when using 5.0 mg mL−1 of Fe3O4/ZnO (Figure 10C), full inactivation was achieved after just 5 minutes. As expected, ZnO proved to be the most effective inhibitor as it produced full inactivation in less than 10 minutes for all concentrations. This correlates with the pNDA bleaching results, supporting the idea of having more amount of active photocatalyst in a pure ZnO sample. On the contrary, Fe3O4 alone had the less favorable performance overall, but at 1 mg mL−1 had >90% of inactivation rate after 15 minutes. This could suggest that at higher concentrations, NPs overshadow one another, reducing the amount of direct light over each NP and decreasing the inactivation rate. Finally, it is worth to mention that at this UV wavelength, bacteria are not directly inactivated, 59 which means that inactivation is caused by ROS generated by the NPs rather than the light source. These results are very important due to the complete bacterial elimination in a short time, which satisfy the requirements of safe drinking water of having an absence in coliforms.3,13,60 This means that the synthesized photocatalyst has the potential to be employed in locations where safe drinking water is not available, reducing the waterborne diseases due to bacterial etiology.
Conclusions
In this work, the preparation of a nanostructured, recoverable, and recyclable Fe3O4/ZnO photocatalytic magnetic composite was successfully achieved. Photocatalytic, structural, and chemical properties of the nanocomposite were compared with those of their lone components, ZnO, and Fe3O4. The photo-bleaching performance of the synthesized materials toward pNDA and E coli inactivation was found to be comparable with that of pure ZnO, demonstrating that the photo-degradation process occurs mainly through •OH generation under UV365nm irradiation, but not under white light or dark conditions. More importantly, this nanocomposite was easily recovered by using an external permanent magnet, and its photocatalytic performance was reevaluated at least thrice, with minimal loss of activity. The above-mentioned magnetically recoverable, photoactive nanocomposite represents a substantial advantage over other previously reported nonmagnetic, nonrecoverable, nonrecyclable photoactive systems, which need other more expensive, time-consuming methods for recovering and reuse.
These results are of great interest as the design and optimization of recyclable, more attractive cost-efficiency systems, with improved performance, as an alternative to the use of nonrecoverable photocatalytic systems for wastewater disinfection or drinking water treatment. The magnetic recovery of the photocatalysts will avoid significantly their release to water bodies and could certainly reduce operation costs by allowing their reuse.
Footnotes
Acknowledgements
The authors thank M. Aceves Mejia, L. Palacios, and A. Romero-Morán from Laboratory of Electro-Photonics (INAOE) for their help during the PL analysis.
Funding:
The author(s) disclosed receipt of the following financial support for the research, authorship, and/or publication of this article: The authors are thankful for partial financial support from the Office of Graduate Programs and Research (UDLAP) and for the partial scholarship support to the PhD student O D Maynez-Navarro. To Conacyt for partial scholarship support to the PhD student O D Maynez-Navarro.
Declaration of conflicting interests:
The author(s) declared no potential conflicts of interest with respect to the research, authorship, and/or publication of this article.
Author Contributions
ODM-N: Contributed with the research experimental development, characterization and formal analaysis of the results, writing of the manuscript. MAM-R: Contributed with the experimental design of the nanostructure synthesis and SEM-EDS analysis, and manuscript review. DXF-C: Contributed with the experimental design of the nanostructure synthesis and manuscript review. JLS-S: Contributed with the conceptualization of the research proyect, design of the microbiology experiments and writing of the manuscript.