
Abstract
The work reported in this article raises some serious concern about the drinking water quality and its standards. Mere presence or absence of an indicator organism does not assure that the water is safe for drinking purposes. Instead of infecting directly, many pathogens pass through a host and retrieve their virulent properties by causing diseases/infections in humans. Pathogenic bacteria which exist in aquatic habitats show a unique and peculiar pattern of appearing or reappearing in different microenvironments. Several factors that prevail in the water system make a safe house for the growth, proliferation, and colonization of microorganisms. In our case, 6 different microenvironments inside the premises of an office building were taken as the sampling sites to study the effect of seasonal variations (summer, monsoon, and post-monsoon/winter) on bacterial diversity and inhabitants. Results suggested that the presence of total and thermotolerant coliforms were highest in the monsoon followed by summer and post-monsoon/winter seasons. To know the bacterial diversity and pattern of appearance/reappearance prevailing in the water system, bacterial strains were analyzed by 16S rRNA sequencing which showed Pseudomonas putida to be the predominant identified bacterial strain occurring about 38% to 77% in all 3 seasons. This was followed by Lelliottia nimipressuralis (6%-21%), Escherichia coli (4%-18%), Salmonella typhimurium and Aeromonas dhakensis (4%-10% each), and Klebsiella pneumoniae (5%-6%). Despite the absence of other opportunistic bacteria, P putida was reported to be present as a single organism in water coolers and dispensers. This might be due to the persistent nature of P putida in low-nutrient environments and capable of colonizing by forming a rigid biofilm inside the water cooler/dispenser which makes a conducive environment for it.
Keywords
Introduction
Water is one of the major entities to sustain life. It is the basic requirement of the human population. No life exists without water. The major source of drinking water on earth is groundwater and river. But these sources are getting shrunk due to growing population’s demand and rapid industrialization resulting in water dearth.
In 1 survey, the Union Ministry of Water, Government of India forecasted the current country’s water requirement to be around 1100 billion m3/year, and by 2025 it will increase up to 1200 billion m3. However, at this rate, the water requirement as per the country’s demand will certainly reach around 1447 billion m3 by 2050. 1
In this context, when we took a close look on the water requirement in India’s capital Delhi, it was found to be an average of 835 million gallons per day. 2 On the contrary, if it is compared with the growing population of Delhi which is about 18 million, sooner or later water scarcity will emerge as a major problem. 3 Subsidizing the fact, Delhi itself does not have other water resources through which it can meet the future demand. For instance, if we overlook this issue, then people will be forced to use contaminated water. To meet the drinking water supply, a long network of water pipelines is spread throughout Delhi. 4 As a result, possibilities in the change in water parameters (both chemical and microbial) always remain open in these distribution pipes. Leakage/spillage caused due to damage by any means results in the outflow of water that forces the soil sediments and organic matter inside the pipelines which leads to deposition of soil sediments, thereby making a favorable microenvironment for the living organisms to grow and proliferate.
Microbial and chemical pollutants are one of the major factors responsible for various public health issues. 5 Water is the medium through which enteric pathogens such as Vibrio cholera, Escherichia coli, and Salmonella typhimurium transfer and can cause cholera, typhoid, dysentery, and hepatitis. 6 Annually, the number of children dying from waterborne diseases increases day by day. The World Bank estimated an average of 1600 reported cases of diarrhea deaths per year only in India, whereas 21% of communicable diseases occur due to unsafe drinking water. 6 In addition, lack of cleanliness, inappropriate sewage disposal, plummeting water levels, drying up of reservoirs, and water contamination with arsenic and fluoride have become issues of concern. 7
Pathogenic bacteria enter into the distribution system network and remain in the biofilm for a longer period causing turbidity, bad taste, and fouling smell. Biofilm formation accelerates the rate of corrosion causing structural damage to the pipes. 8 , 9 Microbiologically induced corrosion (MIC) costs huge amounts of money every year toward its maintenance and enhance head loss in the distribution channel. 10 The biofilm acts as a safe haven for these pathogenic bacteria where they are able to survive. 11 However, these organisms become more resistant to different disinfectants as compared with other genera. 12
Regular monitoring of drinking water quality is done to find out whether the source for drinking water is contaminated by pathogens and if yes then to what extent. For many decades, government agencies have been focusing on indicator organisms, typically E coli. However, coliforms belong to a vast genera, and their transmission through contaminated water gives rise to serious public health risks. Therefore, expansion and use of rapid techniques become essential. A lot of development has been made to understand the diversity, physiology, ecology, and utmost their source/origin. As a matter of fact, there are many waterborne pathogens that remain for long even in the absence of favorable conditions. These groups of organisms have a relatively short lifespan and remain capsulated inside the complex layer called biofilm. This is why only the presence or absence of indicator organisms does not assure that the water is safe for drinking; under such circumstances, identifying all potential pathogens becomes mandatory. Therefore, in this article, we performed rigorous monitoring and covered 3 seasons, namely, summer, monsoon, and post-monsoon/winter to understand the effect of climatic conditions on the growth/regrowth of the bacterial population actively prevailing in the water system. These groups of organisms are opportunistic and showed their presence in spite of indicator organisms.
Materials and Methods
Sample collection
An office building in Naraina Industrial Area was selected as the sampling site. Samples were collected from 6 different locations inside the premises of the office building. Water supply inside the building was mainly through 1 common inlet which was later collected in 2 different overhead tanks, namely, tanks 1 and 2. From overhead tank 1, water is supplied to the kitchen, whereas water is diverted from overhead tank 2 to the laboratory, ladies & gents toilet tap, water cooler, and dispenser. Samplings were performed at 15-day intervals during 3 seasons, namely, summer (April-June), monsoon (July-September), and post-monsoon/winter (October-December). For collecting the samples, 250 mL of sterile wide-mouth plastic bottles (Tarsons, India) were used containing 3% NaHSO4. The tap was sterilized by applying ethanol/rectified spirit and water was allowed to flow for 2 to 3 minutes before drawing the samples. The autoclaved bottle was filled with water leaving 1 in at the top. The bottles were marked accordingly and stored at 4°C. Analyses were performed as soon as the samples were carried to the laboratory to prevent any false results arising from secondary microbial growth.
Assessment of total coliform and thermotolerant (fecal) coliform
Media preparation and membrane filtration technique
Water samples were analyzed for total coliform and thermotolerant (fecal) coliform using selective media such as M-Endo Agar and M-FC Agar (HiMedia, India), respectively. To enumerate total coliform, M-Endo Agar medium was used which comprises the following (g/L): tryptose—7.5; casein enzymic hydrolysate, peptic digest of animal tissue—3.7; lactose—9.4; yeast extract—1.2; dipotassium phosphate—3.3; sodium chloride—3.7; monopotassium phosphate—1.0; sodium deoxycholate—0.1; sodium sulfite—1.6; sodium lauryl sulfate—0.05; basic Fuchsin—0.8; agar—15; and distilled water. To this medium, 20 mL of 95% ethanol was added and the final pH of the medium was maintained at 7.2 ± 0.2. To enumerate thermotolerant (fecal) coliform, M-FC Agar medium was used which comprises the following(g/L): tryptone—10.0; proteose peptone—5.0; yeast extract—3.0; bile salt mixture—1.5; sodium chloride—5.0; lactose—12.5; aniline blue—0.1; agar—15.0; and 1 L distilled water containing 10 mL 1% rosolic acid (FD058). The pH of the medium was maintained at 7.4 ± 0.2.
Prior to membrane filtration, water samples were diluted using the serial dilution method ranging from 10–1 to 10–6 folds aseptically inside the laminar airflow. An appropriate amount of respective water samples (100 mL) were then allowed to pass through the 0.45 μm membrane (Merck-Millipore, India) using the membrane filtration unit and the filter papers were placed on the respective freshly prepared media plates (55 × 14 mm2 Petri plates; Tarsons). The plates were incubated at 35°C ± 0.5°C for 22 to 24 hours and at 44.5°C ± 0.2°C for 24 ± 2 hours for total coliform and thermotolerant (fecal) coliform, respectively. 13 Colonies were enumerated using a digital colony counter (Scientific [SSC-105], India) and transferred onto selective media for subsequent taxonomic identification.
Calculation of coliform density
For total coliform, both the typical and atypical colonies were counted, whereas different shades of blue-colored colonies of thermotolerant (fecal) colonies were taken into consideration on M-FC Agar plates. Using the following formula, coliforms were recorded

Isolation, characterization, and identification of pathogens and thermotolerant coliforms
Colonies exhibiting typical characteristics for suspect coliforms (both enteric and opportunistic bacteria) were confirmed by streaking on freshly prepared selective media such as TCBS Agar, MacConkey Agar, Klebsiella Selective Agar, Nutrient Agar, Pseudomonas Isolation Agar, and XLD Agar (HiMedia) for further purification. Repeated subculture was performed at an interval of 15 days and stored subsequently. Gram-negative bacteria were classified as per Bergey manual of determinative bacteriology. 14
Morphological and biochemical characterization
Bacterial colonies differ in appearance, shape, size, margin, and surface features. Therefore, the pure isolates were stained by following the Gram staining procedure and observed under a fluorescent microscope (Leica DM3000 LED; Leica, Germany). This was followed by conducting biochemical tests using a readymade identification kit prescribed for Enterobacteriaceae (KB001 HiMViC, Himedia). The test kits were incubated and supplemented with test reagents according to the manufacturer’s instructions (HiMedia). Results of microscopic and morphological observations and biochemical characterizations are presented in Tables 1 and 2, respectively.
Morphological and microscopic characterization of the bacterial isolated colonies.

Biochemical characterization of the bacterial isolated colonies.

“–” means negative (more than 90%); “+” means positive (more than 90%); “V” means 11% to 89% positive.
Bacterial identification using 16S rRNA sequencing
For genomic DNA extraction, the NucleoSpin Microbial DNA kit was used (as per the manufacturer’s instructions). 16S rRNA sequencing was performed at Triyat Scientific Cooperation, Nagpur, India. Polymerase chain reaction (PCR) amplification was performed using a universal set of forward and reverse primers, ie, 8F (5′AGAGTTTGATCCTGGCTCAG3′) and 1541R (5′AAGGAGGTGATCCAGCCGCA3). The amplified products were purified using the Montage PCR Cleanup kit (Millipore, USA). The PCR product was sequenced using an ABI PRISM BigDye Terminator Cycle Sequencing Kit with AmpliTaq DNA polymerase (FS enzyme; Applied Biosystems, USA).
Sequencing protocol
Single-pass sequencing was performed on each template using the below 16S rRNA universal primers. The fluorescent-labeled fragments were purified from the unincorporated terminators with an ethanol precipitation protocol. The samples were resuspended in distilled water and subjected to electrophoresis in an ABI 3730xl Sequencer (Applied Biosystems).
Bioinformatics protocol
The 16S rRNA sequence was blast using NCBI blast similarity search tool. The phylogenetic analysis of the query sequence with the closely related sequence of blast results was performed followed by multiple sequence alignment. MUSCLE 3.7 is a program used for multiple alignments of sequences. 15 The resulting aligned sequences were cured using the program Gblocks 0.91b 16 and finally PhyML 3.0 aLRT was used for the phylogenetic analysis. The program Tree Dyn 198.3 was used for tree rendering. 17
Results and Discussion
A wide range of microbial communities play a significant role in deteriorating the water quality standards and are solely responsible for making these waterbodies unfit for drinking purposes. As per World Health Organization (WHO) and Bureau of Indian Standards (BIS), drinking water must not contain any total coliforms and thermotolerant (fecal) coliforms. 18 Still, their presence in treated drinking water supply could not be ignored. However, a wide range of weather conditions across a vast geographical scale and the topography play a vital role; therefore, it becomes necessary to keep a close watch on the drinking water quality and its prevailing conditions that could lead to the growth of waterborne pathogens. As a result, surveillance of drinking water quality, especially bacteriological analysis, becomes indispensable. The objective of this study was to investigate the effect of seasonal variation (summer, monsoon, and post-monsoon/winter seasons) on the bacterial diversity and inhabitants (populations) in 6 different microenvironments of an office laboratory for a period of 1 year. The study will help in tracing out the incidence, nature, type, and overall impact of waterborne pathogens in drinking water.
Seasonal variation in bacterial population and diversity
Climatic condition plays a vital role in the growth and proliferation of microorganisms that prevails in waterbodies; therefore, focus was made on isolating, enumerating, and identifying those viable bacterial species that occur during summer, monsoon, and post-monsoon/winter seasons using 16S rRNA sequencing. This will provide insightful information regarding the change in bacterial diversity and their nature of appearance/reappearance. Figure 1 shows the effect of seasonal variation on bacterial inhabitants present in drinking water of an office building. It was found that maximum numbers of total coliforms were recorded during the monsoon season, where Lelliottia nimipressuralis was observed to be 1280 CFU/100 mL followed by E coli (1235 CFU/100 mL) > S typhimurium (727 CFU/100 mL) > Aeromonas dhakensis (703 CFU/100 mL) > Klebsiella pneumoniae (395 CFU/100 mL).
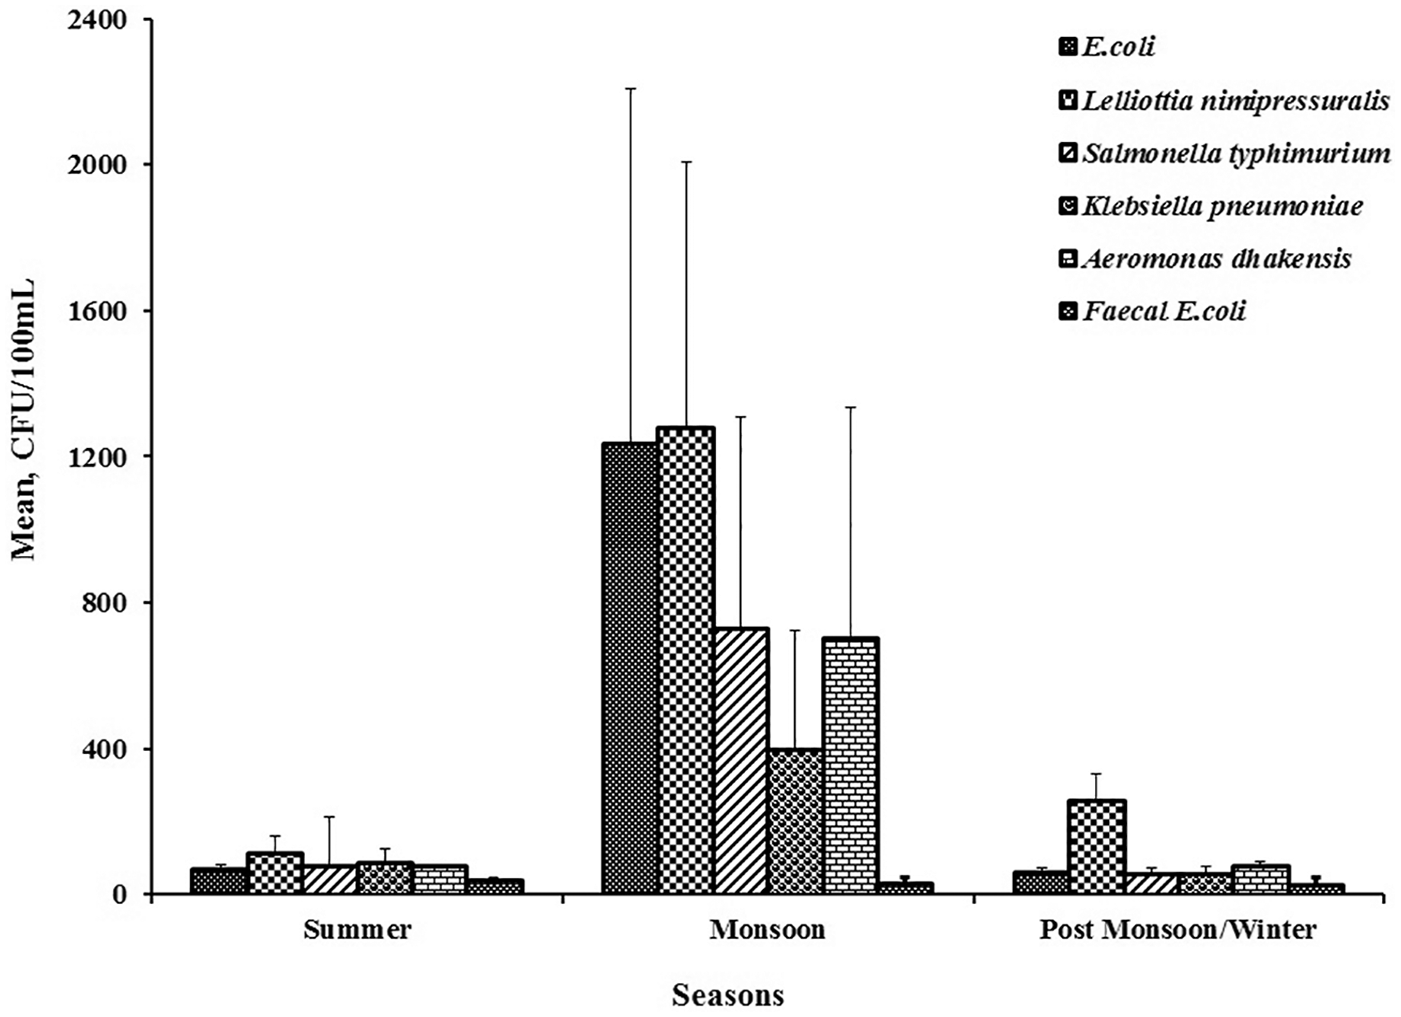
Effect of seasonal variation on bacterial inhabitants present in drinking water of the office building.
An overall representation of different types of bacterial inhabitants and their concentrations in different microenvironments of the office building is summarized in Table 3. It was observed that in summer, the total coliform number varies from 0 to 1000 CFU/100 mL, whereas in monsoon it appears to be in the range from 2 to 1100 CFU/100 mL. A significant difference was observed in the post-monsoon/winter season where the range varies from 2 to 490 CFU/100 mL. There was no particular trend in numbers or occurrence observed during any of the season. However, among all the bacterial strains, Pseudomonas putida was found to be the most predominant microorganism residing in the water samples in all the seasons. Nonetheless, if the data of monsoon and post-monsoon/winter seasons are compared, then a similar trend in occurrence/reoccurrence can be observed up to E coli. However, with change in season, ie, monsoon to post-monsoon/winter, change in number and diversity was recorded such as A dhakensis followed by K pneumoniae > S typhimurium (Table 3).
Summary of bacterial population measured at different microenvironments of the office building, New Delhi.
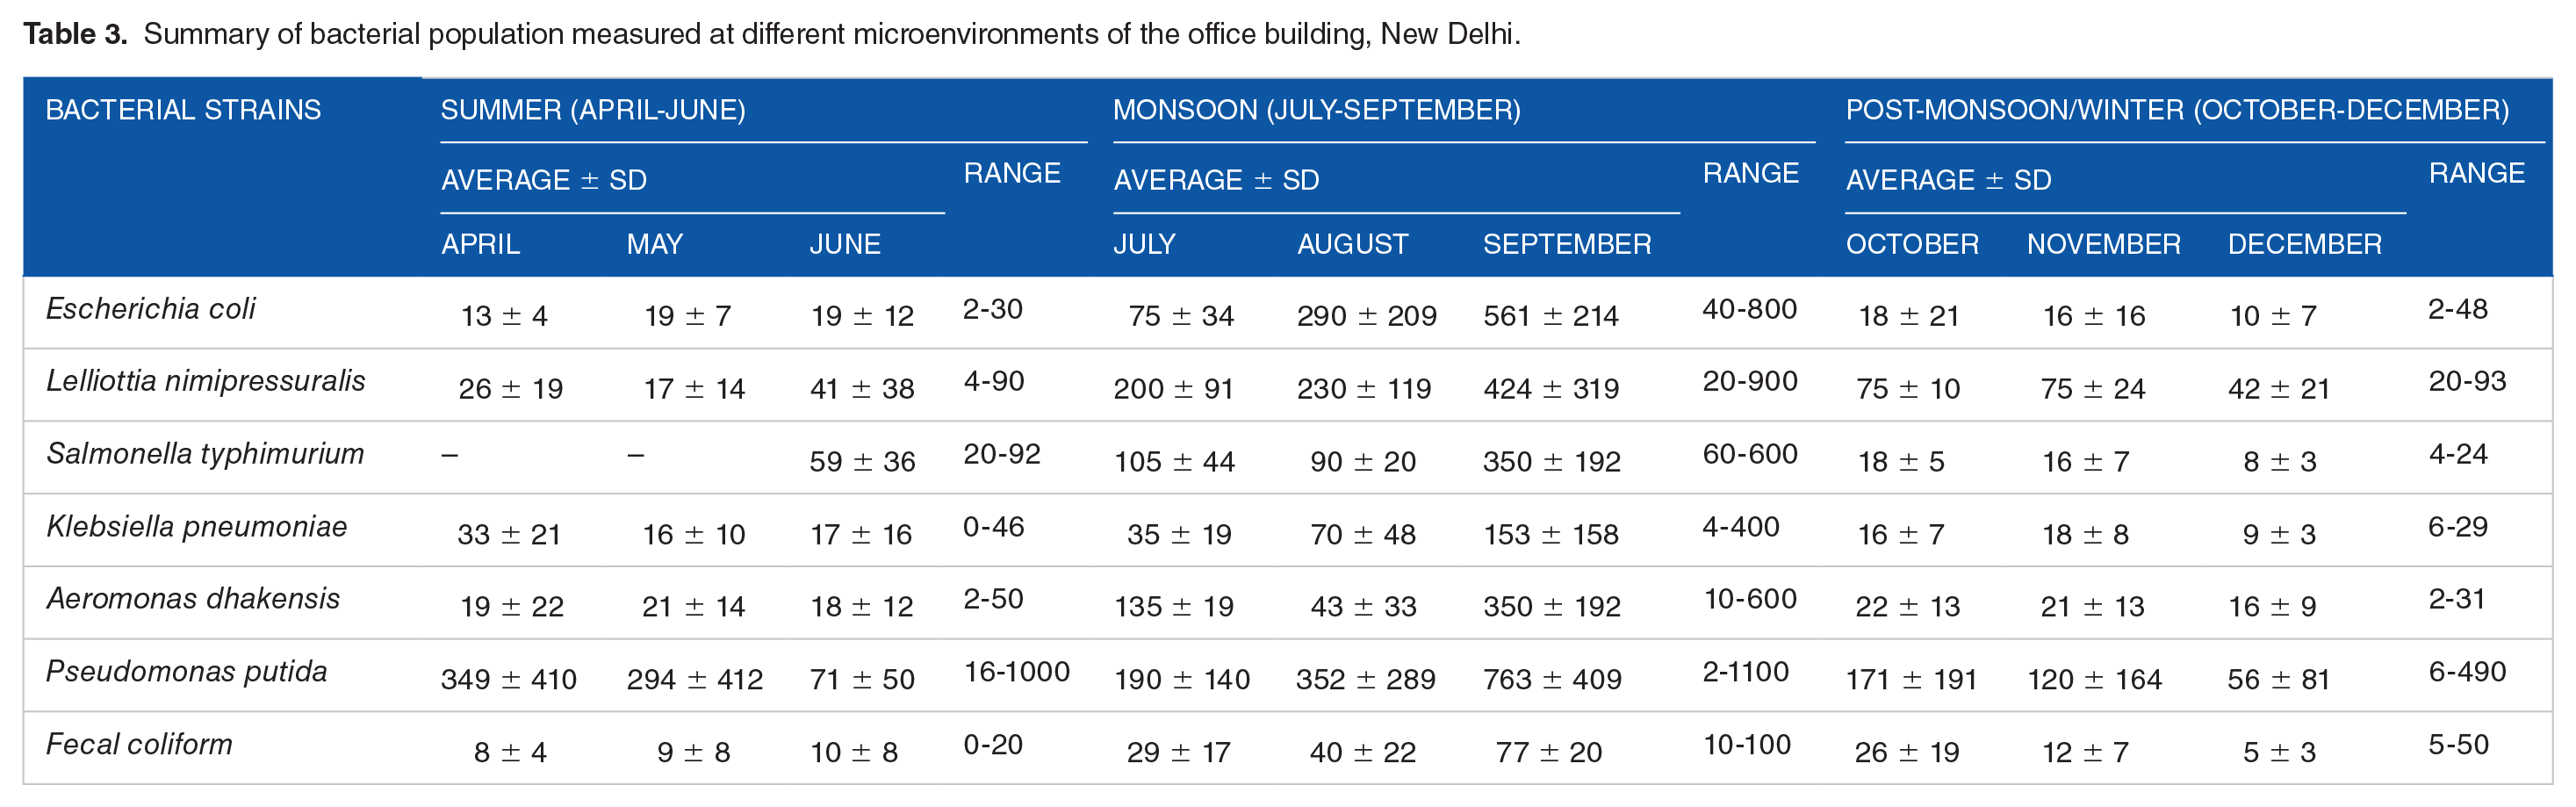
On average, the occurrence of total coliforms was significantly higher when water temperatures increase above 15°C. This could be due to the reason that temperature is an important controlling factor that influences bacterial growth. LeChevallier et al 19 reported maximum bacterial activity observed above 15°C and minimum below 15°C. Instability in growth activity/pattern also depends on the surrounding environment and adaptation by the prevailing microbial species (psychrophiles). 6 Variations in thermotolerant (fecal) coliform was recorded and found to be 0 to 20 CFU/100 mL in summer, 10 to 100 CFU/100 mL in monsoon, and 2 to 50 CFU/100 mL in post-monsoon/winter (Table 3).
Seasonal variation in P putida
One of the major issues which we found during entire assessment studies was inconsistency in P putida concentration. Therefore, to discuss this issue in detail, the results are presented monthwise in Figure 2.

Effect of seasonal variation on the concentration of Pseudomonas putida present in the drinking water samples of the office building, Delhi.
It was observed that, especially in the month of September, the count increases to 763 CFU/100 mL as compared with the months of July and August (190 and 352 CFU/100 mL, respectively). Munna et al 20 reported that the average temperature during the monsoon season varied from 26°C to 34°C as observed in our case which could be considered to be the most favorable temperature for the growth and proliferation of P putida. 21 On arrival of the post-monsoon/winter season, a decrease in P putida population was noted ranging from 6 to 490 CFU/100 mL (refer to Table 3). This could be due to the temperature effect that ranges from 26°C to 34°C favoring the growth and proliferation of P putida.
Figure 3 presents the effect of variation in P putida population with respect to microenvironments inside the premises of the office building. The highest concentration of P putida was recorded during the monsoon season, ie, in the gents toilet tap (770 CFU/100 mL), followed by the kitchen tap (567 CFU/100 mL) and the ladies toilet tap (525 CFU/100 mL), whereas the least count was observed in the water cooler (14 CFU/100 mL). If we compare with the summer and post-monsoon/winter seasons, the least growth was observed during post-monsoon/winter in the staff room dispenser (387 CFU/100 mL), followed by the kitchen tap (146 CFU/100 mL). However, in summer, the values were 678 and 477 CFU/100 mL in the staff room dispenser and water cooler, respectively (Figure 3).

Effect of variation in Pseudomonas putida population with respect to microenvironments inside the premises of the office building.
Notably, when microenvironments were taken into consideration, it was observed that the samples collected from the water dispenser and cooler showed a lot of variation in P putida ranging from 42 to 1000 and 2 to 800 CFU/100 mL, respectively. Despite their prevalence, no other coliforms were detected in the above 2 cases in any season, indicating the efficiency of removal of other waterborne pathogens excluding P putida, which is solely responsible for biofilm formation.
When the results were critically examined, it was evident that the microenvironment plays a crucial role in their appearance/reappearance and the number of coliforms. It was observed that 2 microenvironments, namely, water cooler and dispenser, showed peculiar results, pointing out serious questioning regarding their efficacy. However, the experiment was repeated twice to observe any error but the observation was found to be the same. P putida was not considered as a virulent strain earlier, but nowadays it is one of the emerging problems causing human health issue, which might be due to its multidrug resistivity nature that becomes a major concern. Many cases of P putida infections such as nosocomial, pneumonia, wound, and septicemia were reported in the past decade. 22 Kim et al 23 reported 18 cases in which 77% were related to medical device infections (catheters) and 56% cases of immune-compromised patients.
Lynch 24 reported that Pseudomonas sp. sustains for a prolonged period due to the reuse of nutrient from dead cells and the low concentration of biodegradable dissolved organic carbon (BDOC) present in the water distribution system. P putida is considered to be a fraction of microbial community which grow, survive, and colonize to form colonies (called as biofilm) inside the pipelines. 25 , 26
A report published in 2017 by Environment Canada 27 suggested that stagnant water in the pipeline increases the motility rate and cell densities of P putida up to 2.5 × 10³ CFU/cm. Gagniere et al 28 reported that P putida takes a mean rate of 4.3 cm/d to form a biofilm. All these reports indicate that the presence of Pseudomonas sp. inside the water pipelines results in the formation of biofilm through either regaining of injured/damaged cells or regrowth processes. 29 Once these organisms started to express themselves, they colonize with other enteric and opportunistic bacteria such as Acinetobacter sp., Legionella pneumophila, Pseudomonas sp., Aeromonas sp., and Mycobacterium sp. by living ecologically in drinking-water-associated biofilm. 30 , 31
Bacterial identification
Based on morphological, biochemical, and genomic identification, only 7 bacterial strains were found to be prevalent in 6 different microenvironments. This group of bacteria belongs to γ-proteobacteria, namely, A dhakensis, P putida, K pneumoniae, E coli, S typhimurium, and L nimipressuralis. The closest identified phylogenetic relatives of partial 16S rRNA bacterial sequences are listed in Table 4. Based on bacterial identifications, the amount of P putida was estimated to be 38% to 77%; E coli, 4% to 18%; L nimipressuralis, 6% to 21%; S typhimurium, 4% to 10%; A dhakensis, 4% to 10%, whereas K pneumoniae comprised 5% to 6% of all bacterial strains (Figure 4). Pseudomonas and Aeromonas sp. are opportunistic bacteria that have the ability to grow under low nutrient concentrations 32 and can transfer through water and soil modes. 33 Nonetheless, A dhakensis is considered to be more lethal among other Aeromonas species. It exhibits cytotoxicity against human blood cell lines 34 and diarrhea in children and adults. 35 , 36 In 2011, WHO reported that certain slow-growing bacteria (opportunistic along with enteric pathogens) persist in the environment and are dangerous to elderlies, infants, and persons suffering from immunodeficiency and burns/wounds. These pathogens transfer to such persons through water, used for either drinking or bathing, leading to infections of skin, eye, ear, nose, and throat.
Phylogenetic relationship of partial 16S rRNA bacterial sequences detected in 6 different microenvironments of an office building, Delhi.


Relative abundance (%) of total coliforms during summer, monsoon, and post-monsoon/winter seasons in the drinking water of the office building, Delhi.
E coli is the main indicator organism for fecal contamination. 37 According to Rompre et al, 38 the presence of coliforms in water is correlated to its water quality. The surrounding environmental and water conditions are an important factor for survival of E coli which mostly survived for 4 to 12 weeks at moderate temperature. 39 Presence of E coli strains can cause enteric/diarrhogenic or extraintestinal (ExPEC) infections and sepsis/meningitis in humans. 40 Pathogenic E coli O157:H7 causes abdominal cramps, vomiting, bloody or non-bloody diarrhea, and blood disorders in humans. 41
Currently, Lelliottia belongs to the newly built genus, including 2 species, eg, L nimipressuralis and L amnigena, previously considered to belong to the genera Erwinia and Enterobacter. L amnigena is a multidrug-resistant bacterium reported to cause infections such as septicemia and endophthalmitis in heart transplant patients, 42 whereas L nimipressuralis causes wet-wood and wilt diseases in plants. 43 Kämpfer et al 44 observed and identified the presence of L. amnigena as a predominant species in drinking water reservoirs but till now there is no evidence of L nimipressuralis causing diseases in human beings via water.
Control measures
It is well said that “Cleanliness begins at home”; therefore, control measures were taken to cease the bacterial populace and diversity that were present in the drinking water samples of the office building. Lots of efforts were made to prevent the occurrence/reoccurrence or to reduce the level of risk to an acceptable level. The above findings provide a platform to hold some serious meetings with the concerned authorities to discuss about the current water quality status and necessity to take adequate measures prior to any breakthrough of waterborne diseases in and around the premises of the building. As a result, it was assured that either the level of disinfectant remaining in a water distribution system after the disinfectant has been dosed should be maintained or if not then small quantities of disinfectant should be fed (sometimes at intervals) into the water distribution system.
Considering the presence and amount of opportunistic pathogens in the drinking water proved that the disinfection procedure is not sufficient to prevent biofilm growth or kill other opportunistic pathogens after it reaches to the consumer end as we observed in the case of staff room dispenser and water cooler unit. Knowing the fact that the condition becomes worse in such cases where water ceases to flow and remains stagnant creating a conducive environment for microbiological growth, all overheads tanks (tanks 1 and 2) were repetitively cleaned twice in a month (January), ie, every 15 days, to see any change in the number and diversity of the bacterial community. Following the similar pattern, a bacterial assessment was performed in the month of January, just to see the immediate effect on the diversity and populace with simple measures. It was observed that no bacterial count was recorded in the water cooler, whereas the concentration decreases significantly soon after the second cleaning in the staff room dispenser to 1 CFU/100 mL (Figure 5). When the results were compared with other microenvironments such as the ladies and gents toilet tap, lab tap, and kitchen tap, a remarkable difference was noted, namely, 3, 1, and 7 CFU/100 mL, respectively.

Variation in total bacterial concentration with respect to microenvironments after the second cleaning.
Presence of P putida in the dispenser unit will certainly escalate biofilm growth and therefore becomes a serious concern regarding its possibility for complete elimination. However, alternative options like the use of such filters that are imbedded with iron-impregnated granular activated carbon (Fe-GAC) or charcoal-based GAC could cease the bacterial activities that help in enhancing the biofilm growth. Second, companies should promote well the use of ancient therapeutic antimicrobial agents such as copper and silver in the water storage vessel inside reverse osmosis (RO)/water coolers so that the water which remains stagnant in the vessel will take more retention time for elimination of these pathogens.
Conclusions
The effect of seasonal variation (summer, monsoon, and post-monsoon/winter seasons) on bacterial diversity and inhabitants (populations) in 6 different microenvironments of an office laboratory was studied for a period of 1 year. Analyses were performed using the membrane filtration unit. Results suggested that the presence of total coliform was maximum during the monsoon season up to 1100 CFU/100 mL as compared with summer (up to 1000 CFU/100 mL) and post-monsoon/winter (2-490 CFU/100 mL). Similar observations in thermotolerant (fecal) coliform were noticed in the monsoon season, ie, 10 to 100 CFU/100 mL, followed by summer (2-20 CFU/100 mL) and post-monsoon/winter (2-50 CFU/100 mL) seasons. One of the major issues which we found during the entire assessment studies was inconsistency in P putida concentrations. However, among the 7 different identified bacterial species, P putida was found to be the predominant strain varying from 38% to 77% in all 3 seasons. This was followed by L nimipressuralis (6%-21%), E coli (4%-18%), S typhimurium and A dhakensis (4%-10% each), and K pneumoniae (5%-6%). Despite the absence of other opportunistic bacteria, P putida was reported to be present as a single organism in water coolers and dispensers. This might be due to the persistent nature of P putida in low-nutrient environments and capable of colonizing by forming a rigid biofilm inside the water cooler/dispenser which makes a conducive environment for it.
To overcome these problems, mathematical modeling could be used for predicting pathogen survival and it can be helpful in implementing/evaluating the strategies for mitigating ambient waterbody pathogen levels, and also by promoting innovative, new, and deploying technologies for clean and safe water supply worldwide.
Footnotes
Acknowledgements
The authors would like to express their gratitude to their Director, CSIR-National Environmental Engineering Research, Institute, Nagpur, for allowing them to carry out this work at Delhi Zonal Center.
Funding:
The author(s) received no financial support for the research, authorship, and/or publication of this article.
Declaration of conflicting interests:
The author(s) declared no potential conflicts of interest with respect to the research, authorship, and/or publication of this article.
Author Contributions
All the authors have contributed equally starting from plan and excecution to data compliation, interpetations and manuscript writing.