
Abstract
Groundwater is the most reliable resource for consumptive uses worldwide, but it is vulnerable to anthropogenic pollution in this post-industrialization era. Pollution of the resource may result from anthropogenic activities; hence, analysing the effects of leachate on groundwater is imperative. This study assessed the spatial distribution of physicochemical parameters of groundwater in Roundhill landfill vicinity of South Africa and conducted their hydrogeochemical analysis. Water samples were collected from 3 boreholes in the landfill surroundings and analysed for selected physicochemical characteristics. Spatial distribution of these parameters showed dominant pollution by Mn2+, Fe2+, and
Introduction
Groundwater is the largest and most essential resource of potable water worldwide and more than 1.5 million people depend on it daily. 1 In sub-Saharan Africa including South Africa, the resource is deemed as the most reliable to meet the ever-increasing water demands. 2 However, groundwater’s vulnerability to contamination has become a growing concern. Groundwater pollution mainly results from the rise of urbanization and industrialization although it can be geogenic. The pollution varies temporally and spatially. These developments prompt the generation of solid waste, its indiscriminate dumping, and mismanagement in landfills and open dump yards. Landfilling is a common solid waste management approach worldwide although such facilities are pre-established pollution threats to both surface water and groundwater through leachate infiltration in capped and uncapped landfills. 3
A number of studies evaluating the effects of leachate on groundwater resources have been done and resultant findings have differed due to the site-specific nature of aquifers. One such study reported minimal impact although its contamination by bacteria was reported. 4 Another physicochemical parameter analysis of groundwater during post-monsoon and pre-monsoon seasons in 3 Indian landfill vicinities deemed the resource unsuitable for consumption. 5 In South Africa’s Mahikeng area, groundwater showed minimal pollution and assayed physicochemical parameters were within South African National Standards (SANS) 6 permissible limits with exception of turbidity and Escherichia coli. 1 Borehole drinking water in Mpumalanga and Northwest provinces of South Africa was contaminated with leachate and required pre-treatment before consumption. 7
Roundhill landfill in Eastern Cape, South Africa, reported operational challenges such as shortage of cover material leading to exposed waste, inadequately lined airspaces that alter the landfill’s slopes, illegal dumping, and waste picking. 8 These challenges enhance leachate generation and its unmanaged flow, which increases its risk of contamination to surrounding resources. According to Stroebel et al, 9 groundwater is the most reliable and accepted source of water in the area. As such, incidents of leachate overflow and seepage from the faulty collection system in the landfill could lead to groundwater pollution. 10 Buffalo city metropolitan municipality, where the landfill is situated, sought for specialist services to improve infrastructure and reduce potential pollution risk in the facility. 10 Although these corrective measures are in place, leachate characterization, functionality, and effects on the surrounding groundwater resources remain scantily understood and a possible pollution threat. In addition, spatial distribution of physicochemical parameters in the area is non-delineated. This study aimed at determining the spatial distribution of groundwater physicochemical characteristics and its hydro-geochemistry.
Materials and Methods
Study area and sampling
Roundhill landfill is found in Buffalo city metropolitan municipality of Eastern Cape, South Africa (latitude 32°53′13.66″S and longitude 27°37′26.20″E; Figure 1). The facility is located near a national road and was previously used as natural grassland. It borders active croplands and dairy farms in the northeast and southeast, respectively. It is a general large landfill, which receives more than 500 tonnes of waste daily and is found in an area vulnerable to leachate generation due to positive water balance. The landfill facility began operations in 2006 and serves Buffalo city municipality and the southeast coast parts of the province. 10 The site is located between Nahoon and Buffalo river catchments and its geology is characterized by dykes and dolerite sheets dating to Jurassic age as well as Beaufort sediment of the Karoo family. 9 Area groundwater flows to the southeast and northeast and is classified as a minor aquifer with low groundwater yields of 1 L/s in most boreholes and a deep depth of >40 m. The area has clayey soils. 9 To evaluate the effect of leachate on groundwater, samples were collected in 3 monitoring boreholes near the landfill facility (Figure 2). A handheld GARMIN GPS-60 receiver was used to locate the sampling points whose coordinates were georeferenced and documented as shown in Table 1. This GPS technology enhanced the precision of data obtained and integrated it into the geographical information system. Samples were collected in plastic containers, acidified with 1% (v/v) nitric acid, and stored at 4°C for analysis.
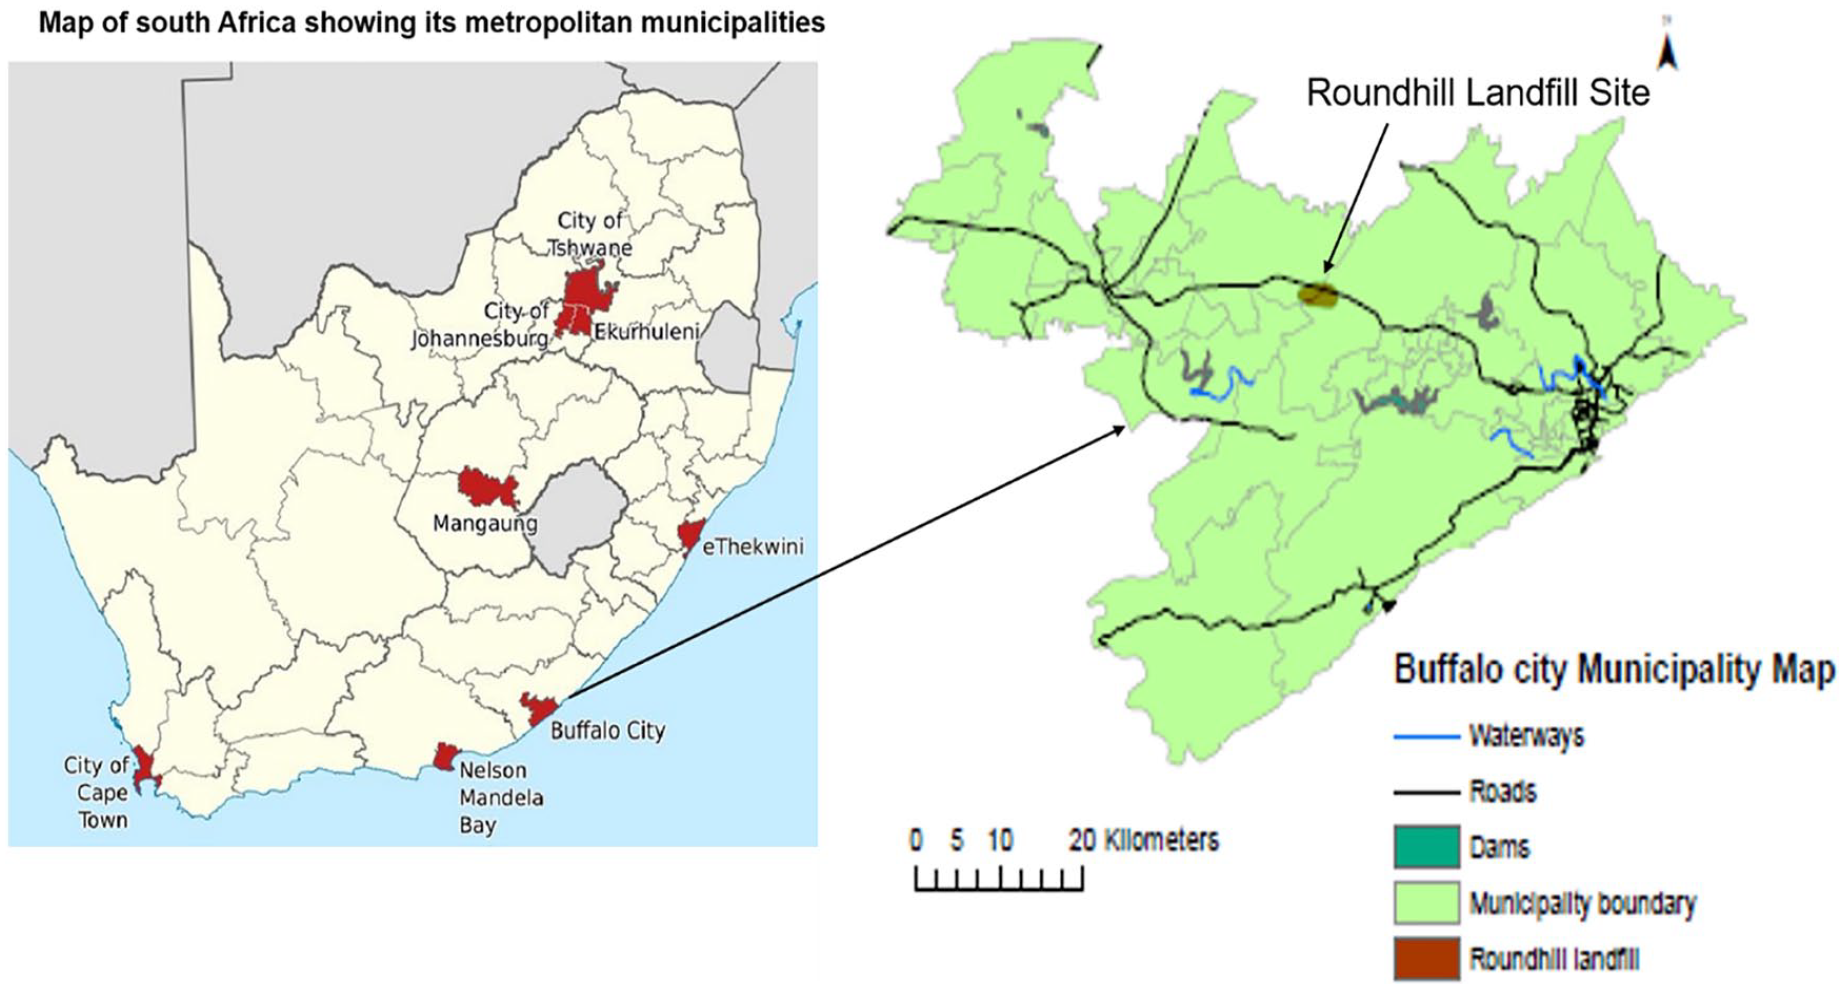
Study area and the location of Roundhill landfill.

Distribution of monitoring boreholes in the relation to the landfill proximity. BH1 indicates borehole 1; BH2, borehole 2; BH3, borehole 3.
Location of sampling sites.

Determination of physicochemical and microbial parameters in water
Physical parameters
Physical parameters considered in this study were colour, turbidity, and total suspended solids (TSS). Colour was determined using a handheld tristimulus colorimeter and resultant values were converted to a colour scale in the Platinum–Cobalt (Pt-Co) system. 11 Turbidity was determined using nephelometry documented using standard methods, 12 and readings were in nephelometric turbidity units (NTU). Total suspended solids were determined using gravimetric method, where 100 mL of sample was shaken and filtered through a pre-weighed dry filter paper. Collected suspended residue and filter paper were oven-dried at 105°C to constant mass then cooled. Total suspended solids were then determined using equation (1)

Chemical parameters
Various chemical parameters including pH, total dissolved solids (TDS), electric conductivity (EC), major cations (Ca2+, Mg2+, Na+, Fe2+, K+, and Mn2+), and anions (Cl−,
The microbiology of groundwater was assessed using 2 measures: total coliforms (TC) and E coli, which are faecal coliforms. The 2 parameters were determined using EPA method 1604. 15 In the method, 100 mL of sampled water was filtered through a cellulose ester membrane filter of 47 mm and 0.45 µm pore size that does not allow bacteria filtration. The filter was placed in MI agar in a plate and incubated for 24 hours at 35°C. Resultant colonies were inspected and blue and white colonies resulting due to ultraviolet light exposure were counted as TC. The blue colonies resulting from the breakdown of Indoxyl-β-D-glucuronide (IBDG) by β-glucuronidase enzyme in the media and fluorescent light were considered as E coli. 15
Hydrogeochemical analysis of groundwater
Acquired physicochemical data were graphically analysed using Piper, Durov, and Schoeller diagrams that were plotted using Aquachem v3.7 software. The Piper diagram modified by Handa 16 consists of 2 separate triangular representations of cations and anions and a diamond shape of combined ions that are used to explain hydrogeochemical faces of water samples. This tri-linear diagram depicts water chemical aspects definitively and have been used in many studies.17,18 A Durov 19 diagram was used to explain the chemical characteristics of groundwater by displaying dominant ions as percentage milli-equivalents in 2 ternary graphs representing ions and summing up to 100%.
This approach has been used in several hydrogeochemical analyses.17,18 Schoeller 20 diagram was used to assess variations in concentrations and relations of assayed parameters.
Spatial representation of physicochemical parameters
Spatial interpolation in this study was used to produce continuous information using the 3 distinct borehole locations. Inverse distance weighted (IDW) method which interpolates using known values of a specified area was used. In the method, values near the prediction location influenced interpolated values more than those far away; hence, more weight was assigned to the former and weight decrease was directly proportional to distance. 21 Geostatistical relationships of known borehole points used Arc-GIS 10.3 software to interpolate physicochemical parameters of groundwater in the study area and represent their distribution in maps.
Results and Discussion
Physical parameters
Physical parameters assayed in groundwater and their spatial distribution were as shown in Figure 3. The colour of water ranged from 15 to 51 Pt-Co units (Figure 3A). Areas around all boreholes were above the permissible requirements of ⩽15 Pt-Co units. High Pt-Co units physically indicate pollution.21,22 Turbidity levels ranged from 0 to 373 NTU and the highest levels were recorded in borehole 1 (BH 1; Figure 3B). Most parts of the study area had NTU levels >1, which was beyond SANS permissible limits and the results corresponded to unsightly appearance of groundwater, which could be due to the presence of suspended solids such as sediments, algae, coloured inorganic, and organic matter in the boreholes. 14 The levels of non-filterable residue of water, TSS ranged between 1 and 89 mg/L, and BH 1 reported elevated levels compared with the others (Figure 3C). High TSS levels probably corresponded to the presence of foreign materials including bacteria and inorganic matter. In Niger Delta wells, elevated TSS and turbidity levels were attributable to municipal solid waste leachate from area dumpsites. 14
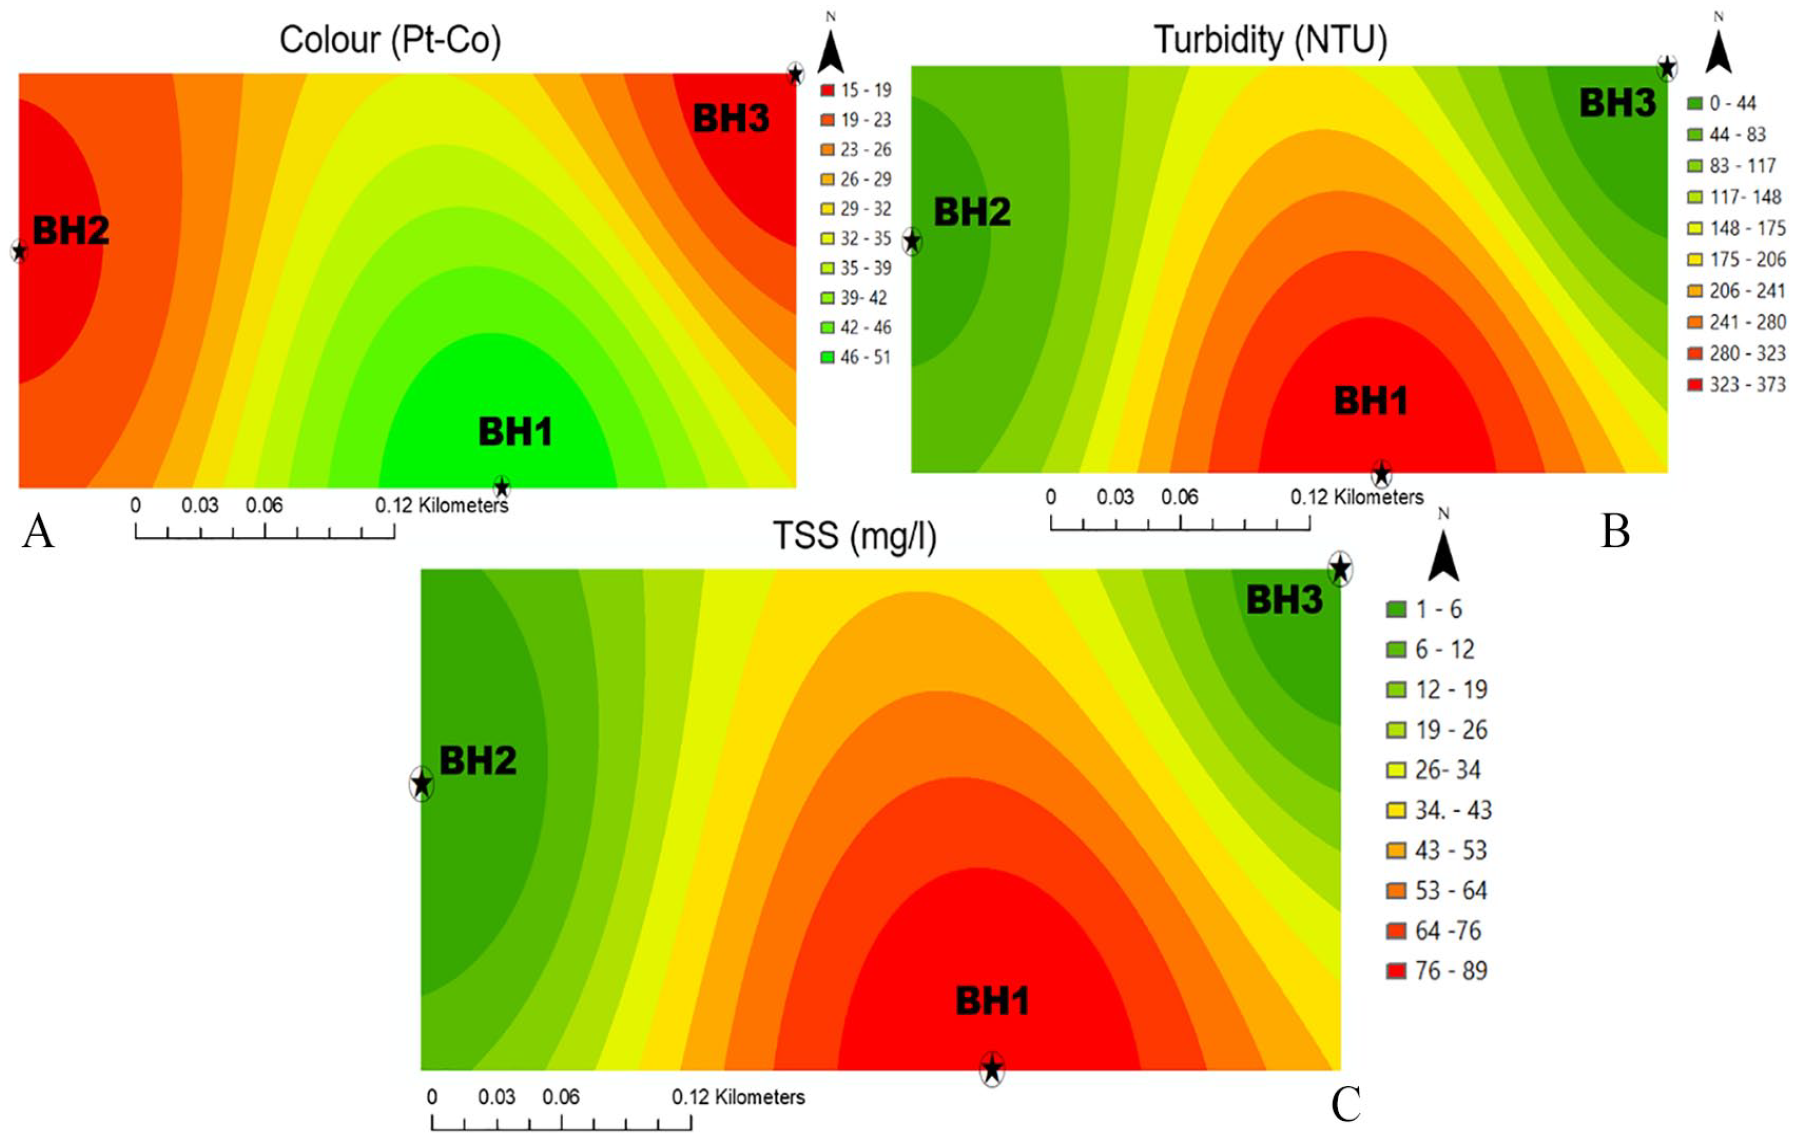
Physical parameters of groundwater representing (A) colour, (B) turbidity, and (C) TSS. BH1 indicates borehole 1; BH2, borehole 2; BH3, borehole 3; NTU, nephelometric turbidity units; Pt-Co, Platinum–Cobalt; TSS, total suspended solids.
Chemical Parameters
Chemical characteristics of groundwater in the study area and their spatial distribution was as shown in Figures 4 to 7. Figure 4 showed the distribution of pH, TDS, Ca2+, and Mg2+. pH levels in all the boreholes ranged between 7.4 and 7.69 reflecting neutral to slightly alkaline waters that were within SANS permissible limits of ⩾5 to ⩽9.7. Total dissolved solids levels were between 278 and 768 mg/L, and borehole 3 (BH 3) had the highest levels. At the 3 sampling points, values were within the ⩽1200 mg/L limit by SANS but inferred to saline water that contained anions and cations possibly from microorganisms and heavy metals in groundwater from leachate. A study in Thiruvananthapuram district of India reported high TDS levels in groundwater and attributed the trend to the water’s eutrophic nature due to major cations from waste dumping in the vicinity. 23 Unscientific disposal of solid wastes in Warri, Agbor, and Agbarho areas of Delta state, Nigeria, leading to leachate runoff was attributed to the high TDS levels in area groundwater. 14

Chemical parameters of groundwater in the study area representing (A) pH, (B) TDS, (C) Ca2+, and (D) Mg2+. BH1 indicates borehole 1; BH2, borehole 2; BH3, borehole 3; TDS, total dissolved solids.

Chemical parameters of groundwater representing (A) Na+, (B) NH4–, (C) Fe2+, and (D) Mn2+. BH1 indicates borehole 1; BH2, borehole 2; BH3, borehole 3.
Chemical parameters of groundwater in the study area representing (A) Cl−, (B)

Chemical parameters in sampled groundwater representing (A) Escherichia coli and (B) total coliforms. BH1 indicates borehole 1; BH2, borehole 2; BH3, borehole 3; CFU, colony forming units.
Calcium and magnesium levels (Figure 4C and D) were used to assess groundwater quality as they are associated with its hardness. Their levels ranged from 0 to 892 and 0 to 785 mg/L in respective order and BH 1 had the highest levels in both cases. Most of the study area levels were beyond the documented permissible levels of 75 mg/L for Ca2+ and 30 mg/L for Mg2+.
24
Elevated levels pointed to very hard groundwater possibly because of polyvalent metallic ions’ seepage from contaminated soils, solid waste, and sedimentary rocks of the vicinity. According to Barakat et al,
25
elevated levels of Ca2+ and Mg2+ in groundwater resulted from leaching of their Cl−,
Ammonium levels of groundwater ranged from 0.2 to 25 mg/L (Figure 5B) and BH 1 areas had the highest levels. Most of the region had levels >1.5 mg/L, which is the SANS permissible limit. Elevated levels possibly indicated the leaching of nitrogen-rich water from landfill leachate and the decay of organic matter in the vicinity. Elevated levels of
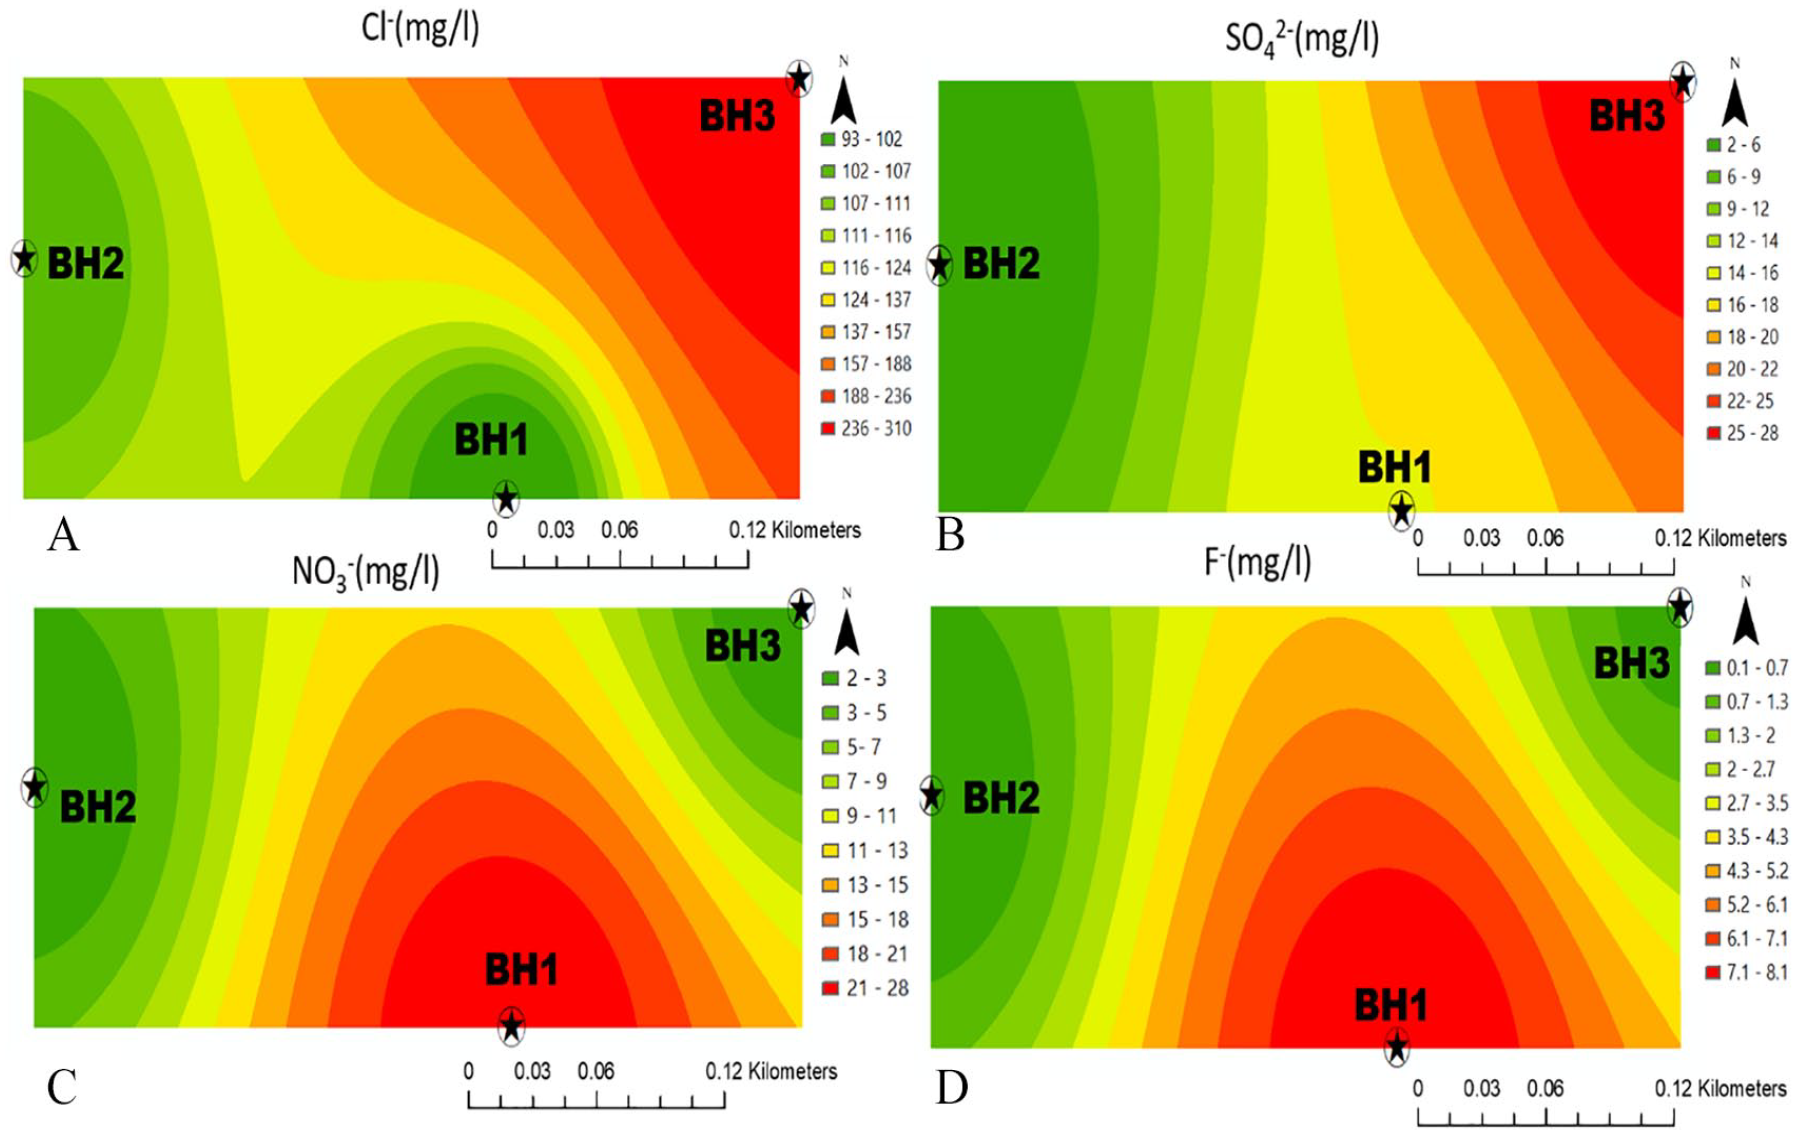
Figure 6 showed the spatial distribution of Cl−,
Nutrient composition of groundwater was assessed using
Results on the spatial distribution of faecal coliforms and total coliforms in the study area were as shown in Figure 7. All boreholes and the entire area had detectable E coli colony forming units (CFUs). This was above the 0 CFU/100 mL recommendations by SANS and points to the presence of disease-causing organisms in the groundwater. A study by Wanda et al, 7 in groundwater of Northwest province, South Africa, detected E coli and attributed it to the presence of pathogens that rendered it harmful for consumption. E coli could be an indication of sewage and leachate contamination in groundwater as established in 3 Polish landfill by Talalaj and Biedka. 29 Total coliforms were detected throughout the study area and their levels were beyond SANS <10 CFU/100 mL limit. This observation could be due to leachate contamination in groundwater and could indicate the presence of pathogens. In Pondicherry and Tamil Nadu states of India, 30 TC detected in groundwater was attributable to the entry of contaminated leachate from the vicinity and had disease-causing microorganisms.
Hydrochemical Faces of Groundwater
Piper and Durov diagrams were used to represent the hydro-chemical faces of sampled water as showed in Figure 8. As Handa 16 explained, various faces were identified in the boreholes as shown in Figure 8A. Borehole 1 had Mg-type of water contrary to borehole 2 (BH 2) and BH 3 that had sodium plus potassium type. Chloride type of water was dominant in 2 boreholes with exception of BH 1 that had bicarbonate water. A combination of both cations and anions classified waters from BH 1 as magnesium bicarbonate, BH 2 was sodium chloride and BH 3 was mixed. A study in Karnataka state of India established that groundwater of the area was dominated with Ca2+–Mg2+–HCO3– ions in a hydro-chemical analysis using this approach. 17 Different ions were localized in various sampling sites. A research by Sughosh et al 18 established that groundwater of Uttar Pradesh region of India had localized distribution of cations at various sampling sites using a Piper diagram. Sampled groundwater in BH 1 had high alkaline earth metals and was characterized by strong acids unlike BH 2 and BH 3 that had moderate amounts of these metals. These results agreed with a hydrogeochemical analysis of groundwater from SRLIS river basin (India), whereby alkaline earth metals were dominant. 17

Hydrogeochemistry of groundwater in the study area representing (A) Piper and (B) Durov diagram. BH1 indicates borehole 1; BH2, borehole 2; BH3, borehole 3.
Results of the Durov diagram (Figure 8B) showed localized distribution of cations just as in the Piper diagram. Borehole 1 showed simple dissolution and mixing of cations while BH 2 showed high dominance of Na+ and Cl−, hence the possibility of reverse ion exchange. A similar trend was reported using this approach in a hydro-chemical analysis of groundwater in India whereby some sampling sites exhibited high dominance of Na+ and Cl− ions while others had mixed ion dissolution where none of the ions were dominant. 17 The presence of anions Cl− as dominant anions localized in BH 2 to 3 could be associated with anthropogenic contamination. A similar trend was demonstrated using a Durov diagram in a hyrdrogeochemical evolution assessment of groundwater in India whereby Cl− dominated waters occurred. 18 The dominance of Na+ and Mg2+ in BH 2 to 3 and BH 1, respectively, compared with Ca2+ is an indicator of foreign pollution to groundwater. According to Hussien and Faiyad, 31 natural groundwater has high levels of Ca2+ but the dominance of Na+ and Mg2+ cations results from dissolution of polluted rocks and soils.
Unique aspects of each sampling sites were presented using the Schoeller diagram as shown in Figure 9. Borehole 1 showed high concentrations of all assessed parameters with exception of Cl− and

Schoeller presentation of chemical aspects of sampling sites. BH1 indicates borehole 1; BH2, borehole 2; BH3, borehole 3.
Conclusions
Spatial representation of physicochemical parameters of groundwater in Roundhill landfill vicinity and its hydrogeochemical analysis made several revelations regarding its nature. First, Fe2+, Mn2+, and
Footnotes
Acknowledgements
Gratitude is paid to the Global Consulting Laboratory services of East London for the help offered during groundwater sampling and analysis.
Funding:
The author(s) declared the following potential conflicts of interest with respect to the research, authorship, and/or publication of this article: The fieldwork and groundwater analysis was supported by the University of South Africa.
Declaration of conflicting interests:
The author(s) declared no potential conflicts of interest with respect to the research, authorship, and/or publication of this article.
Author Contributions
JN undertook the groundwater sampling, analysis and prepared the manuscript. EO supervised the sampling, analysis of groundwater and corrected the draft manuscript.