
Abstract
Context:
During the last decade, numerous in-patient Palliative Care Consultation Service (PCCS) units were established throughout Germany.
Objective:
To provide an epidemiological overview on a whole year cohort of palliative patients in terms of demography, complaints, and therapy on admission to PCCS and the impact of PCCS treatment, and identify differences and similarities in different palliative patient subgroups.
Methods:
Chi-square, analysis of variance (ANOVA), Kruskal-Wallis followed by Games-Howell analysis of HOspice and Palliative care Evaluation (HOPE 2013) data on 4 PCCS centers and in total 919 patients, with solid tumors (237), metastatic cancer (397), leukemia and lymphoma (99), neurological (109, mostly multiple sclerosis [MS]), and noncancer, nonneurological disease (NCNND, 77).
Results:
A mostly uniform block of 3 cancer subgroups in terms of demographics, admission complaints, and initial pharmacological treatment diverged from the neurologic/MS disease subgroup. The “intermediate,” NCNND subgroup coalesced with the cancer or the neurologic/MS subgroups in part of the demographics, complaint, and drug parameters. Tetraparesis, requirement for nursing, and help with daily living were more, and pain, dyspnea, weakness, appetite loss, and fatigue were less frequent in neurologic patients compared with the cancer subgroups. Neurologic patients also showed more common use of coanalgetics and antidepressives, less opiates and nonopiate analgetics, corticosteroids, and antiemetics and antacids. NCNND patients had a particularly high rate of disorientation (48%) and death during PCCS (39%). In the 3 cancer subgroups, dyspnea, weakness, appetite loss, and anxiolytic use were less frequent in solid tumor patients. Palliative Care Consultation Service treatment was associated with reduction in symptom severity independent of subgroup entity. All listed differences were significant at P < .05 level.
Conclusion:
Despite divergence in demographics, symptoms, and medication, the data underline general usefulness of PCCS care in all end-stage patients and not only the cancer subgroups. Nevertheless, the strong differences revealed in the current study also underscore the need for a carefully tuned, disease-specific therapeutic approach to these subgroups of palliative patients.
Introduction
In Germany, Palliative Care Consultation Service (PCCS) units are regularly called by cooperating hospital wards in case of patients in need of palliative care. At first visit of PCCS, demographic data, diagnosed disease, symptom intensity, and medication are documented in a case record form called Palliative Care Assessment (see Table 1). The document is available online (https://www.hope-clara.de/download/2017_HOPE_Basisbogen.pdf) by HOspice and Palliative care Evaluation (HOPE) since 1999 and used in Germany nationwide.1–4
Overview of core items in the Palliative Care Assessment form.

Items summarized in the table are assessed and graded by palliative care professionals on admission and near the end of treatment (discharge or death).
During the last decade, mobile, in-patient PCCS were established in many hospitals5–7 to provide a lower threshold, early palliative care for terminally ill patients.8,9 However, little has been reported on their year-to-year practice and impact. In the current study, we present data from 4 large PCCS centers taking part in HOPE in 2013 with recorded admission of 919 palliative care patients in 5 oncological and nontumor disease categories, focusing on admission symptoms, drug therapy, changes in complaint intensity from admission to discharge, and the impact of underlying disease.
Materials and Methods
Patients
Patients were referred to 1 of 4 involved PCCS across Germany if their attending physician deemed them to have 1 or more unresolved physical symptoms, special nursing needs, psychosocial concerns, end-of-life issues, or a more complex form of consultation requirement. The referred patients were asked to agree to anonymized data collection and its evaluation. The evaluation proposal received approval from the 4 involved PCCS and HOPE coordination board.
Data analysis and statistics
Palliative Care Consultation Service data, collected in 2013, were cleaned of inconsistent data, checked for coding mistakes, and entered into SPSS 22. Patients without diagnosis (9) or sex (3) were omitted.
Frequencies, means, and standard deviations as well as parametric column shares were calculated for the entire 2013 HOPE cohort and the 5 disease-specific palliative patient subgroups: solid tumors, metastatic cancer, leukemia and lymphoma, neurological disease, and patients with noncancer, nonneurological disease (NCNND). Appropriate significance tests (set at α = 0.05 level) were chosen for analysis, that is,
Two-tailed Pearson chi-square test and Bonferroni adjustment for multiple testing, to assess the frequency differences in subgroups in Table 2, and Figures 1 and 2;
Kruskal-Wallis test for numerical, nonfrequency data in Table 2 (e.g. age), followed by post hoc unequal number/unequal variance Games-Howell method;
Analysis of variance (ANOVA) for unequal number/unequal variance Games-Howell for changes in complaint intensity in Figure 3.
Demographic and disease-specific aspects of the entire patient set and the disease subgroups.
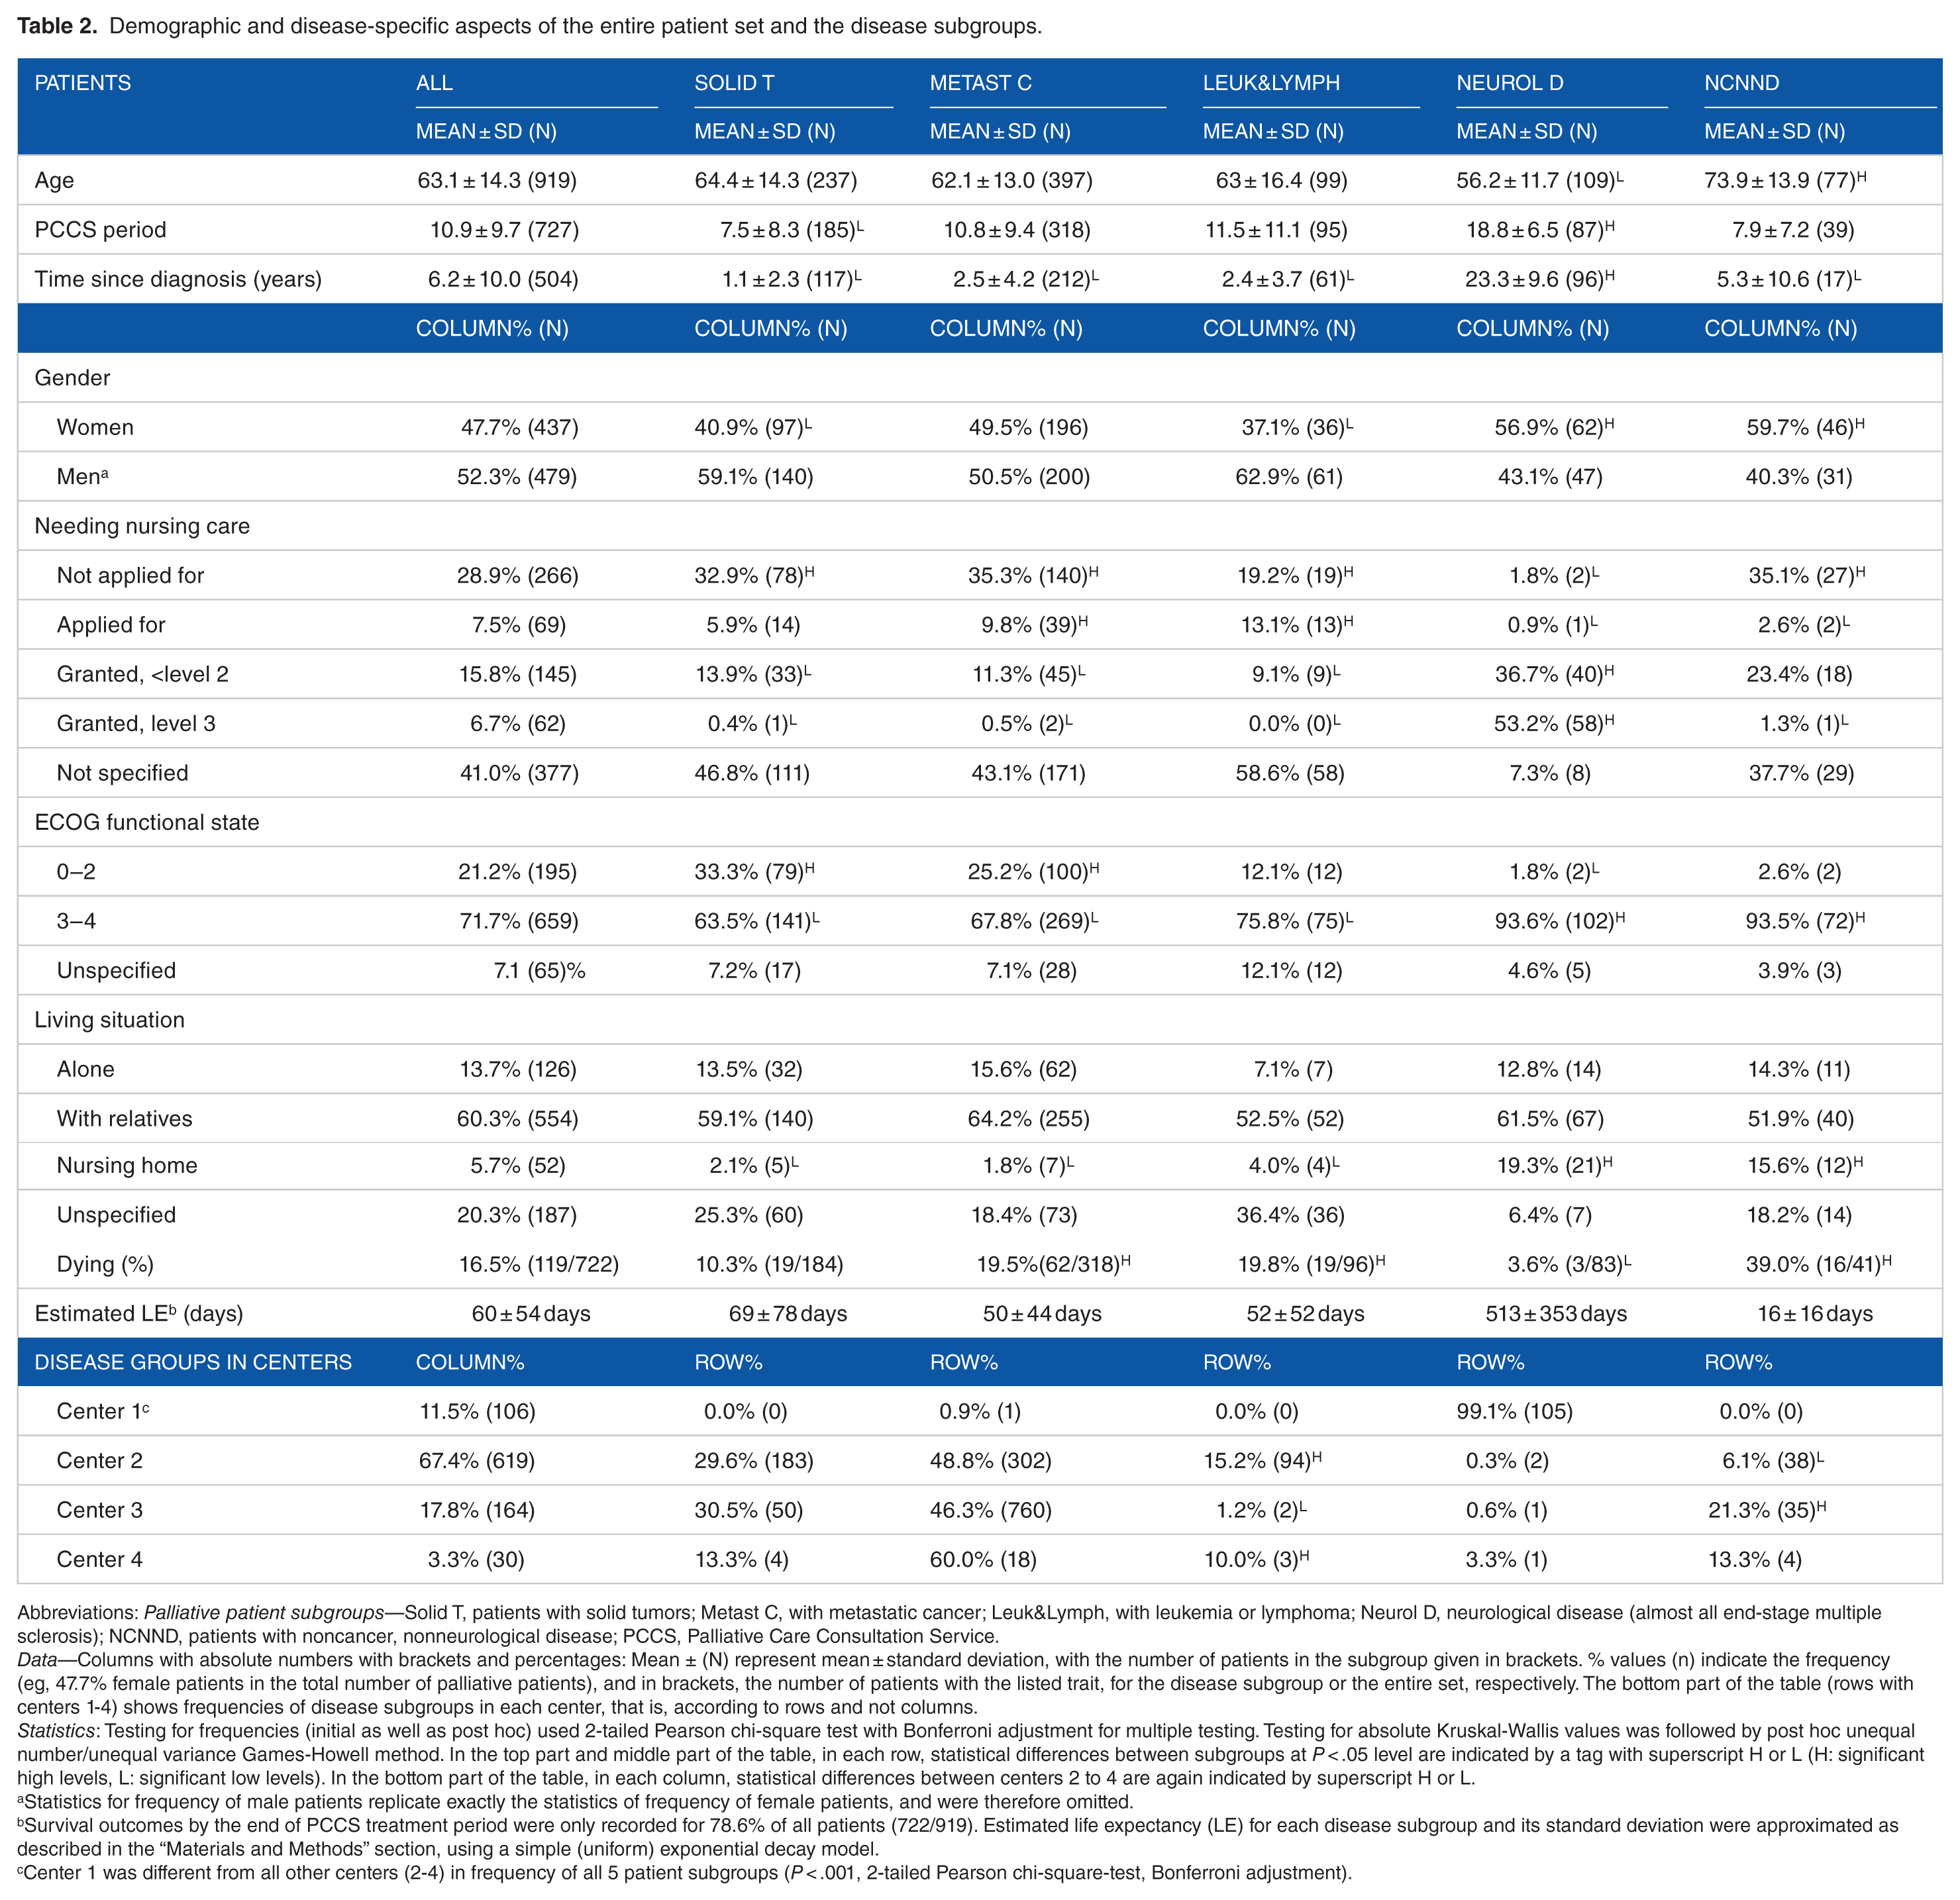
Abbreviations: Palliative patient subgroups—Solid T, patients with solid tumors; Metast C, with metastatic cancer; Leuk&Lymph, with leukemia or lymphoma; Neurol D, neurological disease (almost all end-stage multiple sclerosis); NCNND, patients with noncancer, nonneurological disease; PCCS, Palliative Care Consultation Service.
Data—Columns with absolute numbers with brackets and percentages: Mean ± (N) represent mean ± standard deviation, with the number of patients in the subgroup given in brackets. % values (n) indicate the frequency (eg, 47.7% female patients in the total number of palliative patients), and in brackets, the number of patients with the listed trait, for the disease subgroup or the entire set, respectively. The bottom part of the table (rows with centers 1-4) shows frequencies of disease subgroups in each center, that is, according to rows and not columns.
Statistics: Testing for frequencies (initial as well as post hoc) used 2-tailed Pearson chi-square test with Bonferroni adjustment for multiple testing. Testing for absolute Kruskal-Wallis values was followed by post hoc unequal number/unequal variance Games-Howell method. In the top part and middle part of the table, in each row, statistical differences between subgroups at P < .05 level are indicated by a tag with superscript H or L (H: significant high levels, L: significant low levels). In the bottom part of the table, in each column, statistical differences between centers 2 to 4 are again indicated by superscript H or L.
Statistics for frequency of male patients replicate exactly the statistics of frequency of female patients, and were therefore omitted.
Survival outcomes by the end of PCCS treatment period were only recorded for 78.6% of all patients (722/919). Estimated life expectancy (LE) for each disease subgroup and its standard deviation were approximated as described in the “Materials and Methods” section, using a simple (uniform) exponential decay model.
Center 1 was different from all other centers (2-4) in frequency of all 5 patient subgroups (P < .001, 2-tailed Pearson chi-square-test, Bonferroni adjustment).
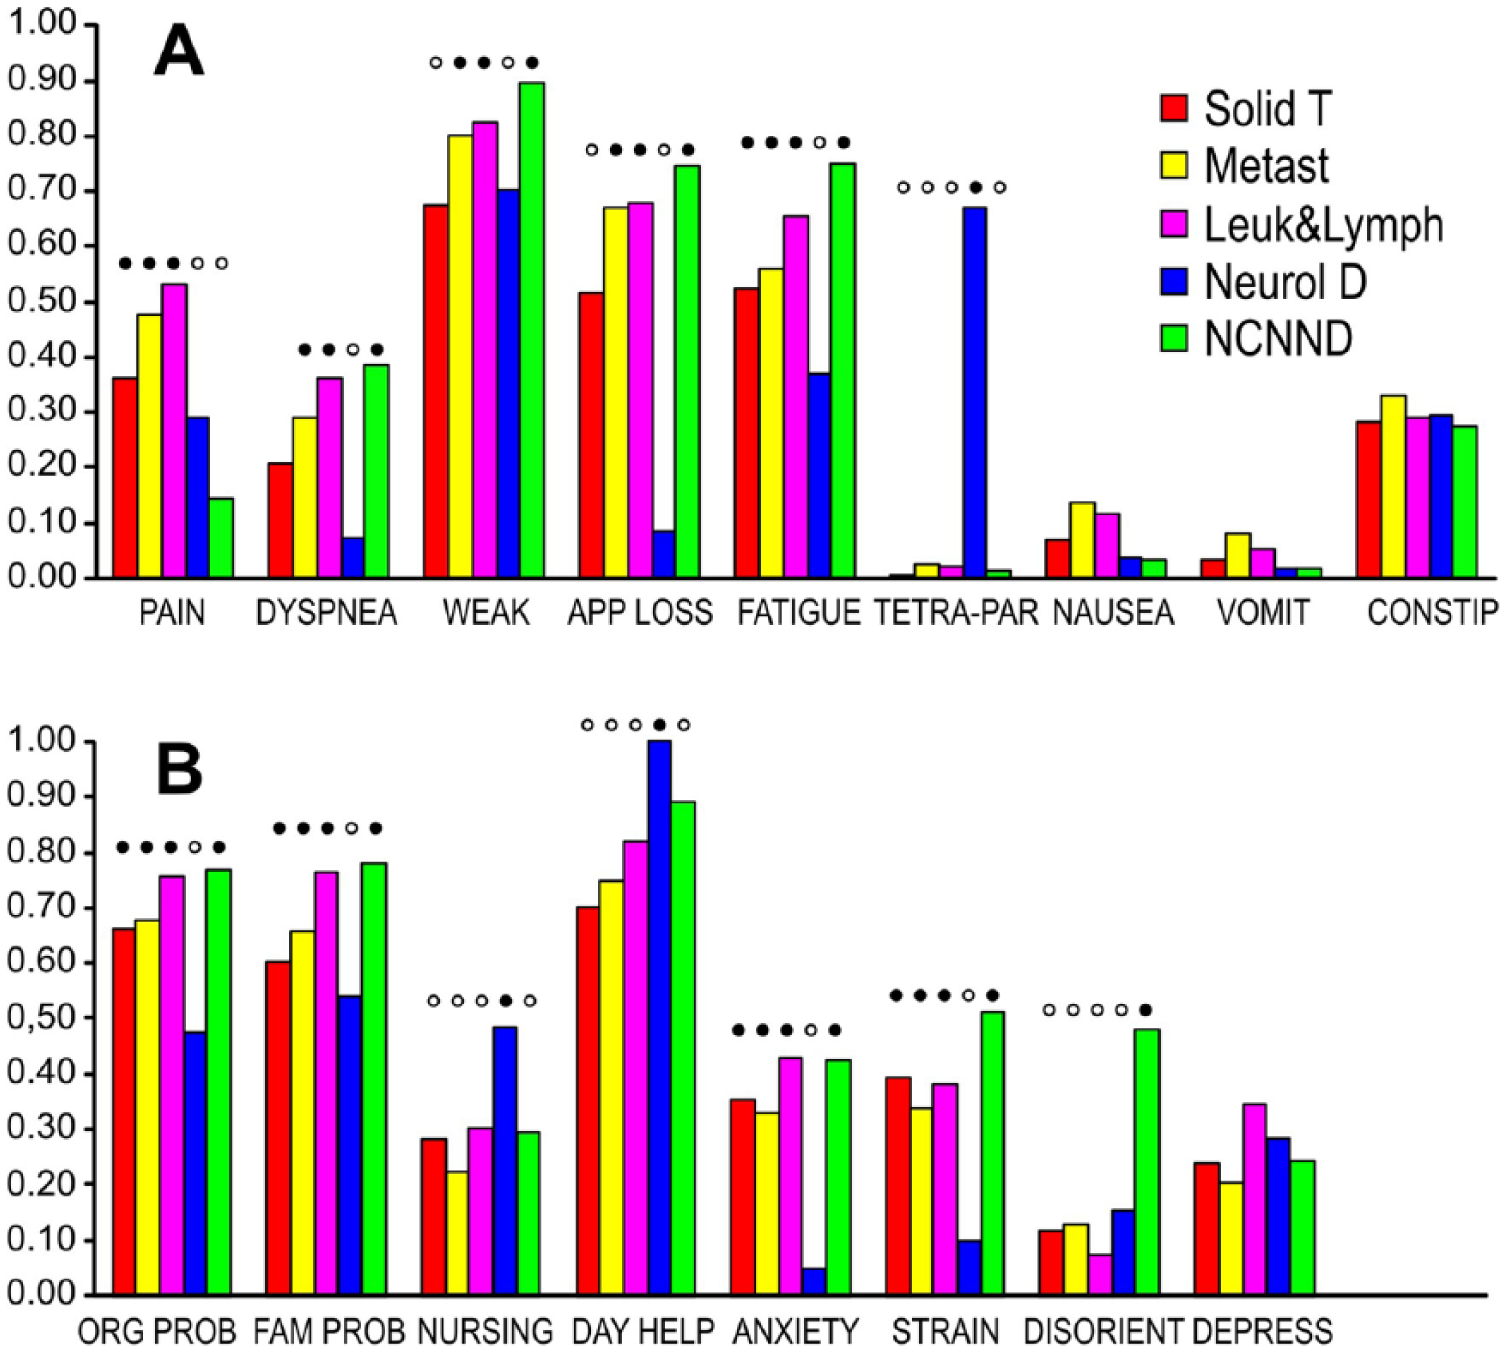
Frequency of patients showing specific physical complaints (A) and social and mental difficulties (B) of moderate to severe intensity per disease subgroup, as percentage of patients with this disease subgroup. Subgroup bars with filled circles (high values) showed significant difference versus bars with empty circles (P < .05, 2-tailed Pearson chi-square test with Bonferroni correction for multiple testing). The most common set of significant differences was between neurological disease subgroup and all other disease subgroups, observed with 8 of 17 complaint parameters. Patient subgroups—Solid T, patients with solid tumors; Metast C, with metastatic cancer; Leuk&Lymph, with leukemia or lymphoma; Neurol D, neurological disease (almost all end-stage multiple sclerosis); NCNND, patients with noncancer, nonneurological disease. Complaints—WEAK, weakness; APP LOSS, appetite loss; Tetra Par, tetraparesis; VOMIT, vomiting; CONSTIP, constipation; ORG PROB, organization problems; FAM PROB, problems from family overstrain; NURSING, nursing care; DAY HELP, need of help with daily living; DISORIENT, disorientation; DEPRESS, feeling of depression.

Frequency of drug therapy: (A) general and (B) neuro-pharmacology. As in Figure 1A and B, subgroup bars with filled circles showed significant difference versus those with empty circles (P < .05, 2-tailed Pearson chi-square test with Bonferroni correction for multiple testing). a-ACID indicates antacids/proton pump blockers; a-BIOT, antibiotics; a-DEPR, antidepressives; a-EMET, antiemetics; ANX/SED, anxiolytics and sedatives; CO-AN, coanalgetics; CORTC, glucocorticoids; CRD/a-HYP, cardioprotective and antihypertensive drug; DIUR, diuretics; LAX, laxatives; nOPI-AN, nonopiate analgetics; OPI2, grade 2 opiates; OPI3, grade 3 opiates.
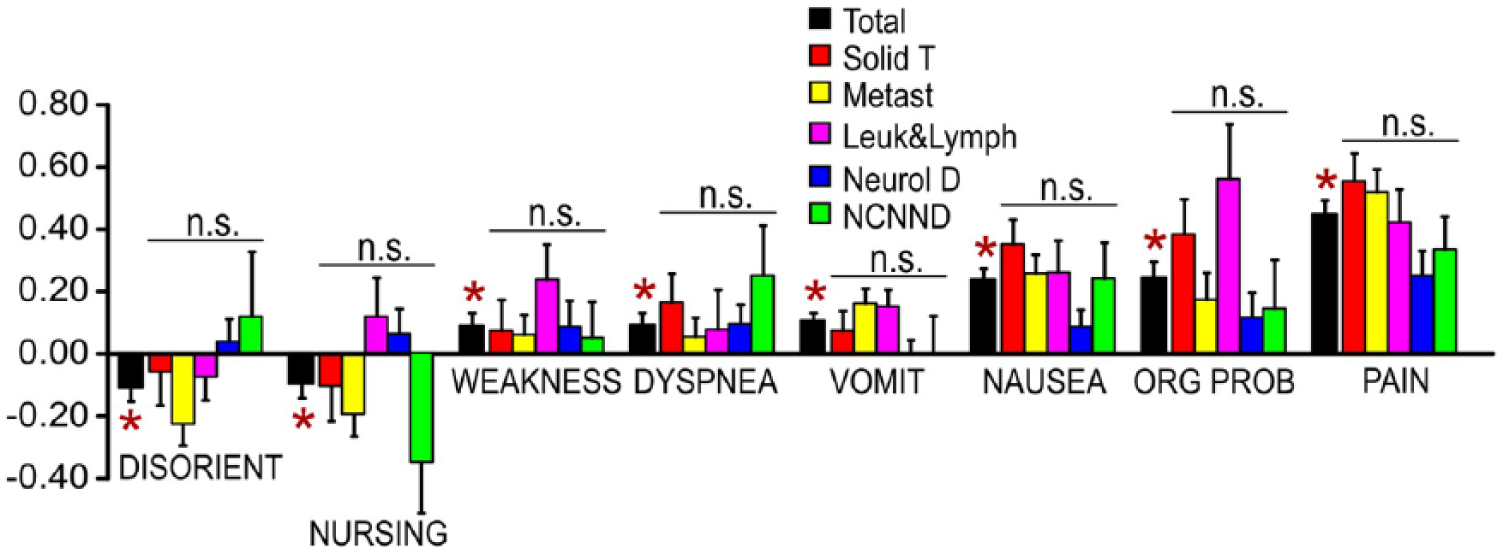
Parameters with significant change of overall complaint intensity (black bar) between initial and final appraisal for the entire patient set (mean ± standard error of the mean, n = 419). Changes are shown as initial minus final value, that is, improvement (reduction of complaint intensity) is represented as a positive bar and deterioration as a negative bar. Intensity changes for disease-specific patient subgroups are shown in the following 5 bars in each parameter column.
Estimated life expectancy (LE) for each disease subgroup in Table 2 was approximated using a simple (uniform) exponential decay model, that is, P(t ≥ T) = exp(–k × T), with P: survival probability, t: individual survival time, T: defined time interval, and k: extinction speed. Under this assumption,
Results
2013 HOPE data: demographics, disability, and care requirement according to disease
The current study reports on the 2013 cohort of patients at 4 centers providing PCCS in Germany that entered their data online in HOPE (Table 2). In total, 919 patients were analyzed and showed a comprehensive admission record according to the criteria described in the “Materials and Methods” section. The solid tumor subgroup consisted of 237 patients, mainly alimentary tract cancer. In total, 397 patients had metastatic cancer complaints, mainly of alimentary tract, lung, and female reproductive system, and leukemia or lymphoma was present in 99 patients; 109 patients in palliative care carried a neurological diagnosis, of these 105 had multiple sclerosis (MS) with an Expanded Disability Status Scale (EDSS) of ≥7.5; 10 77 patients belonged to the noncancer, nonneurological disease (NCNND) subgroup, suffering from circulatory and/or respiratory illness. The survival status of patients at the end of PCCS was recorded for 722 patients, 78.6% of the total set.
Some centers showed complete or almost complete specialized referral. For example, almost all neurological patients (105/109) received palliative care from Center 1 (P < .0001 in paired 2-tailed chi-square test of patient frequencies with Bonferroni adjustment for multiple testing against all other centers; all results of frequency distribution tests here and further below were 2-tailed and performed with Bonferroni adjustment). Likewise, almost all patients with leukemia and lymphoma received palliative care in the “high-frequency” centers 2 and 4 (P < .05 for frequency comparison of Center 2 or Center 4 vs Center 1 or Center 3). There was also a more than 3-fold higher frequency of NCNND patients in center 3 compared with center 2 (P < .05). However, the recorded frequencies for patients with solid tumors and for patients with metastatic cancer were not significantly different between centers 2 and 4.
In terms of demographics, the cohort was 63.1 ± 14.3 years old (mean ± SD, n = 919), with clearly younger patients in the neurological disease (56.2 ± 11.7 years, n = 109) than in the NCNND subgroup (73.9 ± 13.9, n = 73) at a P < .05 significance level using Kruskal-Wallis test, followed by post hoc analysis with Games-Howell. Both subgroups had a prevalence of female patients (56.9% for neurological and 59.7% for NCNND), compared with the solid tumor (40.9%) and leukemia and lymphoma (37.1%) subgroups, respectively (P < .05, chi-square).
Incoming patients were 6.2 ± 10 years after receiving their diagnosis, but this was just an average, with patients with neurological disease with a much longer, 23.3 ± 9.6 years interval between initial diagnosis and PCCS support (n = 96) than in all other 4 subgroups (P < .05, Kruskal-Wallis, Games-Howell post hoc). Significant differences were also observed in length of PCCS treatment period, with 18.8 ± 6.5 days (n = 87) for neurological patients compared with 7.5 ± 8.3 days (n = 185) for patients with solid tumors (P < .05, Kruskal-Wallis, Games-Howell post hoc), and for the death rate by the end of the PCCS treatment, with just 3.6% (3/83) for neurological patients versus 39% (16/41) for NCNND, 19.5% (62/318) for metastatic cancer, and 19.8% (19/96) for leukemia or lymphoma disease subgroups (P < .05, chi-square, as above). Based on the death rate and the length of PCCS stay and assuming simple exponential decay model (see “Materials and Methods” section), LE at admission was estimated to be around 2.5 weeks (16 ± 16 days) for the NCNND subgroup, around 2 months (69 ± 78, 50 ± 44, and 52 ± 52 days, respectively) for the 3 cancer subgroups, and around 1.5 years (513 ± 353 days) for the neurologic subgroup.
Neurological and NCNND patients revealed a significantly higher frequency (93.6% and 93.5%, respectively) of high level impairment in their functional state with ECOG levels 3 to 4, 11 compared with all 3 cancer patient subgroups (63.5%, 67.8%, and 75.8%, respectively, P < .05, chi-square). Similarly, the 2 noncancer subgroups showed significantly higher frequency of pre-PCCS institutionalization (nursing home) with 19.3% and 15.6%, respectively, compared with just 2% to 4% in the 3 cancer subgroups (P < .05). Patients in the neurological subgroup also had a higher rate of pre-PCCS granted need for nursing care of up to level 2 (36.7%) and for level 3 (53.2%), compared with the 3 cancer groups (P < .05). Interestingly, patients with metastatic cancer and with leukemia and lymphoma had a higher frequency of ongoing applications for nursing care status (9.8% and 13.1%, respectively), compared with neurological and NCNND patients (0.9% and 2.6%, P < .05).
Physical complaints and social/mental impairment
Figure 1 shows the frequency of patients with specific physical complaints (Figure 1A) and social and mental difficulties (Figure 1B) at or above level 2 (moderate/severe impairment) on admission to PCCS for each of the 5 disease subgroups. Analysis using 2-tailed Pearson chi-square test revealed significant inter-subgroup differences at the .05 level with Bonferroni adjustment for multiple testing for 13 out of 17 complaint parameters, that is, for all except for nausea, vomiting, and constipation (Figure 1A) and for feeling depressed (Figure 1B). In the most common pattern of subgroup divergence, that is, 8 out of the 13 parameters (fatigue, tetraparesis, organizational problems, problems with family care, nursing care requirement, need of help with daily living, anxiety, and strain), there was an almost binary split, that is, the subgroup with neurological disease differed in complaint frequency from all other 4 subgroups. Here, there was a more frequent complaint of tetraparesis and for nursing care in daily living, but rarer problems with fatigue, strain, anxiety, organization, and family care.
Additional 4 parameters showed a partial modification of this binary split pattern, with (a) dyspnea and loss of appetite, the solid tumor subgroup moving into an intermediate, nonsignificant position between the neurological subgroup, and patients with metastatic cancer or leukemia and lymphoma; (b) with weakness, solid tumor subgroup gaining significant difference to the other 2 cancer subgroups as well as losing difference to neurological patients; or (c) with pain, the NCNND subgroup also becoming significantly different from the 3 cancer subgroups.
Neurological patients were not always the principal significantly diverging subgroup. Thus, moderate to severe disorientation was significantly more frequent (by a factor of 2-3) in patients with NCNND, compared with the 4 other subgroups.
Pharmacological therapy
Figure 2A and B demonstrates significant differences in patient subgroups in all drug therapy categories on admission to PCCS, with exception of antibiotics (Figure 2A) and class 2 opiates (Figure 2B). Overall, there were 2 common, almost binary split patterns of subgroup divergence: (a) frequent application of glucocorticoids, antiemetics, and antacids in the 3 subgroups of cancer patients against their less common use in the 2 nontumor subgroups (Figure 2A, P < .05, chi-square) and (b) the differential, but not necessarily always more common use of neuro-pharmacological agents in the neurological disease subgroup (Figure 2B). Thus, cancer and NCNND patients were frequently treated with class 3 opiates and nonopiate analgetics, compared with their 3-fold to 6-fold lower use in neurological patients (P < .05). However, patients in the neurological disease subgroup displayed significantly more frequent use of coanalgetics and antidepressives, than in the other 4 subgroups (P < .05).
The use of laxatives was rare in NCNND patients compared with all 4 other groups (P < .05). Occasional significant differences between 1 or 2 subgroups were also observed for the cardiac/antihypertensives and diuretics (Figure 2A) and anxiolytics/sedatives (Figure 2B).
Change in complaint intensity after admission to PCCS
Second assessment of symptom load was recorded at the end of PCCS provision in 419 of initially 919 patients (45.9%). This second assessment was entered for 29.2% of patients with solid tumors (69/236), 47.9% with metastatic cancer (190/397), 55.6% with leukemia or lymphoma (55/99), 77.1% with neurological disease (84/109), and 27.3% with NCNND (21/93). Changes in intensity for each complaint were recorded as initial minus final score on a 4-point scale (0 = no complaint, 1 = slight, 2 = moderate, and 3 = severe), with positive values corresponding to improvement, that is, a reduction in complaint intensity (and, vice versa, negative values representing a deterioration).
Here, significant differences were not observed between the 5 individual disease subgroups using ANOVA testing at the .05 level with Bonferroni adjustment for multiple testing. However, unlike the most subthreshold differences among subgroups, there was a significant change in complaint intensity for the entire patient set (n = 419) for 8 out of 17 complaint parameters between admission and the second appraisal (P < .05, paired 2-tailed t test). As shown in Figure 3, 2 of these parameters with significant change, disorientation (mean ± standard error of the mean: –0.112 ± 0.041) and nursing requirement (–0.098 ± 0.045), revealed slight deterioration, and 6, weakness (+0.089 ± 0.041), dyspnea (+0.092 ± 0.039), vomiting (+0.103 ± 0.028), nausea (+0.236 ± 0.036), organizational problems (+0.242 ± 0.053), and pain (+0.446 ± 0.043), revealed significant improvement.
Discussion
The current overview of 2013 HOPE data in 919 palliative care patients across different tumor and nontumor disease conditions demonstrates not only substantial differences but also some common features at admission. Among the latter were uniformly low levels of antibiotic and class 2 opiate use, low complaint levels for nausea and vomiting, but also moderate to severe problems with constipation in about 30% of all patients and high complaint levels of feeling depressed. These uniform levels could be due to a characteristic feature of end-stage palliative patients across different disease entities highlighted in a series of studies.12–14 Still, some of it could also be a chance occurrence in frequency of a common medication side effect in some subgroups and an effect of disease itself in other subgroups.
The frequently high levels of feeling depressed are plausible consequences of suffering from an incurable, progressive illness, which requires psychological support. Similarly, class 2 are entry-level opiates, less likely used in palliative patients suffering from strong chronic pain. Low antibiotic use suggests that infection was not the main reason for being transferred to PCCS, across all 5 different disease entities observed in the study. However, the moderately high rates of constipation observed in Figure 1A could be due to a high rate of opiate class 3 usage in the 3 cancer and the NCNND subgroups (Figure 2B), as well as to the indirect effects of immobility in the nonopiate treated but tetraparetic, neurological patients (Figure 1A).
The current study did not observe significant subgroup differences in changing complaint intensity between admission and discharge. However, the second assessment was only completed in about 45% of all patients, which might reduce explanatory power. Second, records also differed in frequency from as high as 77% in the neurologic and just 27% in the NCNND subgroup. Nevertheless, in the overall set of 419 patients, almost half of the observed parameters revealed a significant change between admission and second visit/discharge. Two of these parameters: disorientation and nursing requirement showed slight deterioration, but the other 6 improvement (pain, nausea, vomiting, dyspnea, weakness, and organizational problems), with most prominent effect observed for pain. The fact that most of the detected changes were improvements in well-being (6 vs 2) would argue against the second PCCS visit—when it occurred—took place due to symptom deterioration. The apparent overall reduction in symptom severity is in line with the usefulness of care initiated and provided by PCCS across different subgroups of end-stage patients.15,16
At admission, the neurological subgroup showed the highest frequency of differences to all other subgroups. This specific difference pattern was observed for, in total, 14 parameters: 3 parameters listed in Table 2 (time since diagnosis, absence of application for nursing care, granted nursing care level 3), 8 in Figure 1, and 3 in Figure 2. By comparison, the second most common pattern—a predominant difference between the 3 cancer and the 2 nontumor subgroups—was just present in 6 (2 in Table 2, 1 in Figure 1, and 3 in Figure 2). Intermediate or incomplete patterns were also observed but overall less frequent. Two parameters (disorientation, laxative use) displayed a predominant difference between the NCNND subgroup and all other 4 subgroups. Finally, the 3 cancer subgroups appeared as an almost uniform block: significant differences between solid tumors versus metastatic cancer, leukemia, and lymphoma were only observed for weakness, loss of appetite, and the use of sedatives/anxiolytics (see Figures 1A and 2B). In these 3 parameters, the frequency of moderate to severe complaints was lower in the solid tumor subgroup, that is, primarily metastatic or systemic malignancy was associated with increased complaint severity, at least in some parameters.
Most of the differences with the neurological/MS subgroup could be due to its specific disease trajectory and the type of end-stage bringing the patient into contact with PCCS. One typical example is the “not applied for nursing care” category, observed at a very low rate in the neurological/MS patients. Although these patients were younger, they were in a poor functional state (93.6% had ECOG state 3 or 4), and their average disease duration was much longer than in all other 4 subgroups. This probably provided adequate time for a new application for nursing care to have been not just submitted but already granted.
All 4 other subgroups suffered from a higher level of anxiety, strain, problems with organizing care, and problems with family, which could all be caused by an underlying awareness of impending death and limited time left (see, for example, LE estimates in Table 2). However, although palliative MS patients were indeed end-stage, with an incurable condition, immobility due to tetraparesis, nursing problems, and high ECOG scores, they did not face impending death and also had more time to adapt to their condition. Together with their frequent use of antidepressives at admission (40% vs just 4%-15% in the other 4 subgroups), these features are in line with a more unstrained and tolerating attitude.
Although both neurologic and NCNND subgroups displayed less moderate/severe pain at admission compared with the tumor subgroups (Figure 1A, column 1), both subgroups frequently used pain medication at rates on par with those in cancer (Figure 2A, columns 1-5). Thus, rather than these 2 nontumor patient subgroups did not suffer from pain, this would suggest that their pain was more effectively brought under control. However, there was a strong divergence in the type of medication. Like cancer patients, patients in the NCNND subgroup showed high rates of use for class 3 opiates and the nonopiate analgetics. In contrast, neurologic/MS patients had rare exposure to opiates or nonopiate analgetics, but high rates of treatment with coanalgetic and antidepressive drugs which are known to provide good coverage in neuropathic pain.17–19
As shown in Figure 2A, all 3 subgroups of tumor patients had high rates of treatment with glucocorticoids, antiemetics, and antacids compared with the 2 nontumor subgroups. Although nausea and vomiting rates were low across all 5 subgroups, this could mean that these were generally low in the nontumor subgroups, while just effectively brought under pharmacological control in the tumor patients. Similarly, high level of glucocorticoid use with associated reduced inflammation and tissue swelling in the tumor patients could have helped to reduce their pain level, underlining the importance of assessing both current complaint intensity and medication addressing this complaint in maintaining or modifying palliative care. 20
The current study extends previous findings by Ostgathe et al 6 in 2011 on differences between palliative cancer and noncancer patients by (a) including an overview of drug and nondrug therapy and changes between admission and second assessment/discharge, (b) employing a whole year cohort instead of first 3-month data as a safety feature to exclude seasonal variation, and (c) using a finer subgroup structure via expanding the number of subgroups to locate the reason for divergence of complaint frequency. For example, in the 2011 study, patients from the noncancer subgroup (encompassing both 70% nonneurological and 30% neurological patients) were more frequently disoriented and also displayed higher rates of poor functional state (ECOG score 3 or 4), the latter also reported by Bostwick et al. 21 Cancer patients had more applications for nursing care applied for but not yet granted. Constipation rates were similar in the cancer and noncancer subgroups.
In the current study, moderate to severe disorientation was present in almost half (48.1%) of the NCNND subgroup, compared with the 3-fold lower levels among the neurological/MS patients, on par with that in tumor patients (Figure 1B, column 7). However, high ECOG scores (Table 2) reflecting poor functional state were a common feature in both nontumor groups—neurological (93.6%) and nonneurological (93.5%). Similarly, tumor patients with metastatic cancer and with leukemia and lymphoma had a higher frequency of ongoing applications for nursing care status (9.8% and 13.1%, respectively, in Table 2), suggesting a sudden deterioration in the functional status of these cancer patients (but not nontumor patients) prior to accessing the PCCS support. Constipation rates were also similar across all 5 tumor and nontumor subgroups (Figure 1A, column 8).
One key difference between the 2 studies seems to be the incidence of moderate to severe pain. In the earlier study, this complaint frequency was roughly on par in cancer (55.8%) and noncancer (49%) patients. 6 In the current study, this complaint severity was recorded for 36% (solid tumor), 48% (metastatic), and 53% (leukemia and lymphoma) cancer subgroup patients, respectively. However, it was only present in 29% of neurologic and just 14% of the NCNND patients (Figure 1A, column 1). Moreover, the pain symptom load also showed the clearest overall improvement between admission and second assessment during provision of PCCS to the entire patient set (Figure 3). It is possible that the significant reduction in nontumor pain in the more recent study was due to a more extensive use of the class 3 opiates in the NCNND patients (53.2%; Figure 2B, column 3). However, this would need to be addressed in a future longitudinal study exploring changes in complaint frequencies and pharmacological therapy in the different disease subgroups of palliative patients.
Footnotes
Acknowledgements
The authors would like to thank Ms Monika Halser for her help with literature research and Ms Annegret Wiechmann for her support of the palliative care work and valuable discussions in the preparation of this manuscript (both at MS Clinic, Berg).
Declaration of conflicting interests:
The author(s) declared no potential conflicts of interest with respect to the research, authorship, and/or publication of this article.
Funding:
The author(s) received no financial support for the research, authorship, and/or publication of this article.
Author Contributions
BB-R, GR, JK and GL conceptualised the study. BB-R, TM, AD and CS collected the data. BB-R, GR and GL performed data analysis and statistical evaluation, and wrote the manuscript. JK and IK obtained intramural funding and were involved in manuscript revision. All authors approved the final version form.