
Abstract
Background:
The scaffolding protein, caveolin-1 (Cav-1), participates in multiple cellular functions including promotion of sodium excretion from the kidney. Loss of expression of Cav-1 is associated with tumorigenesis of various types of cancer. We have shown the potential link between hypertension and breast cancer via abnormal function of the G protein–coupled receptor kinase type 4 (GRK4).
Objective:
The current studies tested the hypothesis that Cav-1 acts as a tumor-suppressive factor in breast cancer cells and enhances the sensitivity to the inhibitory effect of the type 1 dopaminergic receptor (D1R).
Methods:
Michigan Cancer Foundation (MCF) MCF-7 cells stably expressing a Cav-1/mCherry fusion protein or mCherry alone were used as models to examine the effect of Cav-1 on cell growth, apoptosis, and senescence. Cell proliferation was determined by cell counting, cell cycle analysis (flow cytometry), and BrdU incorporation. Apoptosis was determined using the Cell Death Detection ELISA kit from Roche Diagnosis. Senescence was determined using the senescence associated beta galactosidase (SA-β-gal) assay. Reactive oxygen species (ROS) was measured using 2′,7′-dichlorodihydrofluorescein diacetate. Western blot analysis was used to measure activation of signaling pathway molecules. All statistical analyses were conducted with Microsoft Excel.
Results:
Overexpression of Cav-1 in MCF-7 cells reduced cellular growth rate. Both inhibition of proliferation and induction of cell death are contributing factors. Multiple signaling pathways were activated in Cav-1-expressing MCF-7 cells. Activation of Akt was prominent. In MCF-7-expressing Cav-1 (MCF-7 Cav-1) cells, the levels of phosphorylated Akt at S473 and T308 were increased 28- and 8.7-fold, respectively. Instead of protecting cells from apoptosis, extremely high levels of activated Akt resulted in increased levels of ROS which led to apoptosis and senescence. The tumor-suppressive effect plus downregulation of GRK4 makes Cav-1-expressing MCF-7 cells significantly more sensitive to the inhibitory effect of the D1R agonist, SKF38393.
Conclusion:
Caveolin-1 acts as a tumor-suppressing factor via extreme activation of Akt and down regulation of survival factors such as GRK4, survivin, and cyclin D1.
Introduction
Hypertension and breast cancer are 2 common diseases in women worldwide. Of all adult women, 1 in 3 have hypertension and 1 in 8 will develop breast cancer during their lifetime. Prevalence of both diseases increases with age. In fact, after menopause, hypertension prevalence increases to 75%. Moreover, about 50% of breast cancer patients are in this postmenopausal age group. A recent meta-analysis of 30 studies with 11 643 cases of breast cancer has shown a statistically significant association between hypertension and increased breast cancer relative risk (RR) (RR: 1.15; 95% confidence interval [CI]: 1.08-1.22). 1 The fact that breast cancer incidence is 13% to 15% higher in hypertensive women after adjustment of known common risk factors2,3 indicates an intrinsic linkage between these 2 pathological conditions.
The kidney is a key blood pressure regulatory organ that maintains electrolyte and water homeostasis. About 75% of sodium excretion is regulated in the proximal tubule. 4 Regulation of sodium excretion from renal proximal tubules is mediated by a G protein–coupled receptor (GPCR), the type 1 dopaminergic receptor (D1R), and a corresponding GRK4.4-6 Our previous studies have demonstrated that sustained activation of GRK4 causes uncoupling of D1R from its downstream effector, adenylyl cyclase, and terminates its function leading to a reduction in sodium excretion from the kidney and hypertension. We also found that Cav-1, a scaffolding protein, acts as an inhibitor of GRK4 to maintain cellular response to the D1R ligand in kidney proximal tubule cells. 7
Several lines of evidence have suggested that the D1R and GRK4 system also play a role in breast cancer development and progression. Type 1 dopaminergic receptor is expressed in breast cancer tissues and cell lines and specific D1R agonists exhibited antitumor effect both in vitro and in breast cancer animal models. 8 G protein–coupled receptor kinase type 4 expression and activity are associated with increased risk of the progression of breast cancer because of its proliferation-promoting function.9-11 Given the negative regulatory effect of Cav-1 on GRK4 activity, we hypothesize that overexpression of Cav-1 would reduce the tumor-promoting effect of GRK4 and potentiate the growth inhibitory effect of a D1R agonist on breast cancer cells. The current studies tested our hypothesis by overexpressing Cav-1 in MCF-7 cells that contain both D1R and GRK4.
Materials and Methods
Construction of caveolin-1 expression vector
A set of long oligos of multiple cloning site was synthesized and added in pEGFP-N1 to make the TA cloning vector (TA). mCherry (C) was polymerase chain reaction (PCR) cloned into this system with an N-terminal mCherry fusion (TACC). Then we polymerase chain reaction (PCR) subcloned Cav-1 with the primers below to make Cav-1 that has an N-terminal mCherry tag. Caveolin-1 primers for subcloning were as follows: aaaa tct aga atgtctgggggcaaatac and aaaa gaa ttc tatttctttctgcaagttgatg. The resultant vector was sequenced and confirmed having correct Cav-1α.
Cell lines and tissue culture
MCF-7 cells were originally obtained from the American Type Culture Collection (ATCC). Cell authentication was performed by Laragen in 2019. The short tandem Repeat (STR) alleles of the cell line used in this study match the data in the ATCC database. MCF-7 cells were stably transfected with vectors containing either the mCherry fluorescent protein, or the mCherry and Cav-1 fusion protein. The cell lines were then diluted to single cells and cultured. Colonies uniformly expressing mCherry were picked and subcultured. The cells were maintained in improved Minimal Essentail Media (IMEM) (Corning Life Sciences, Tewksbury, MA) with 5% fetal bovine serum and G418 antibiotic (600 µg/mL) at 37°C in an incubator with humidified 5% CO2 and 95% air. G418 (Thermo Fisher) was used at the maximum nonlethal dosage to select cells containing the transfected plasmid.
Growth assays
For growth rate determination, cells were plated in 35-mm dishes at the density of 30 000 cells per dish in their culture media. Starting from day 2, 2 dishes of each line were taken out each day and nuclei were released according to the protocol described previously and counted using a Coulter counter. 12 The culture medium was refreshed every other day.
To determine the effect of SKF38393 (a specific D1R agonist) on cell growth and to compare the sensitivity MCF-7 cells with or without Cav-1 to this compound, cells were plated at a concentration of 30 000 cells per well in 6-well plates. Two days later, the cells were treated with the dopamine type 1 receptor (D1R) agonist from Smith Kline French drug number 38393 (SKF38393) at various concentrations for 5 days with medium change on day 3. Cell number was counted using a Coulter counter. 12
Cell proliferation assay
Proliferation assays were carried out using 5-bromo-2′-deoxy-uridine (BrdU) Labeling and Detection Kit I (Roche Diagnostics, Indianapolis, IN), following the manufacturer’s instructions. Briefly, cells were plated into 6-well plates on sterile coverslips at the density of 2 × 10⁵ cells per well. Two days after seeding, BrdU was added to the culture medium at the concentration of 10 µM and incubated for 30 minutes, followed by incubation with anti-BrdU antibody and secondary fluorescent antibody. The coverslips were mounted to glass slides using VECTASHIELD Antifade Mounting Medium with 4’,6-diamidino-2-phenylindole (DAPI) (Vector Laboratories, Burlingame, CA). Images of the cells were acquired using the Olympus IX81 microscope and Metamorph software. BrdU-positive cells were quantified by manual counting using ImageJ software. In total, 3 to 5 fields (20× objective) of each cell type were counted.
Assay for apoptosis
Apoptosis was measured using the Cell Death Detection ELISA kit (Roche Diagnostics, Indianapolis, IN) following the manufacturer’s instructions. Briefly, cells were plated into 12-well plates at the density of 80 000 cells per well. Two days later, cell lysates were prepared by incubation of the cell monolayer with 0.5 mL lysis buffer at room temperature for 30 minutes followed by centrifugation at 210 g for 10 minutes at 4°C. In total, 20 µL of cell lysate were used for the ELISA assay. A parallel set of plates with identical treatment was prepared for cell counting. The result was expressed as absorbance at 405 nm normalized by cell number.
Senescence-associated β-gal assay
The cells were plated in 12-well plates. Three days later, the cells were fixed in 4% paraformaldehyde for 5 minutes at room temperature. The cells were washed 3 times with PBS and 1 mL SA-β-gal staining solution, 0.1 M citric acid/sodium phosphate buffer (pH: 6.0) containing potassium ferricyanide, 5 mM; potassium ferrocyanide, 5 mM; NaCl, 150 mM; MgCl2, 2 mM; and X-gal, 10 mg/mL, was added to each well. The plate was sealed with parafilm and put in a zipper bag. The sealed plate was incubated in a CO2 incubator for 16 hours. The staining solution was replaced by phosphate buffered saline (PBS) and images captured with Nikon invert microscope. Senescent cells that had taken up green stain were counted. The percentage of senescent cells was calculated and expressed as an average of at least 10 fields for each cell type.
Measurement of reactive oxygen species
The cells were plated in 96-well plate at the density of 20 000 per well. Two days later, the cells were treated with vehicle (PBS), N-acetyl cysteine (NAC, 5 mM), or hydrogen peroxide (500 µM) for 2 hours and then loaded with 2′,7′-dichlorodihydrofluorescein diacetate (DCFDA, 10 µM final concentration) in serum-free medium. Measurement started on PHERAstar FS, BMG plate reader (Raleigh, NC, USA) at 37°C by scanning the wells every 10 seconds for 30 minutes. The medium with DCFDA was removed, and the cells were incubated with Hoechst 33324 (2 µg/mL) at room temperature for 15 minutes. Fluorescent intensity of Hoechst 33324 was measured on plate reader and used for normalization of ROS levels.
Immunoblotting (western blot)
Total cell lysates were prepared using radioimmunoprecipitation assay (RIPA) lysis buffer (50 mM Tris-HCl, pH: 8.0, with 150 mM sodium chloride, 1.0% NP-40, 0.5% sodium deoxycholate, and 0.1% sodium dodecyl sulfate, sodium vanadate, 10 mM PMSF, proteinase inhibitors). Uniform amounts of protein, as measured through the Bradford protein assay, were prepared using Laemmli loading buffer, resolved in 4% to 20% or 10% sodium dodecyl sulphate (SDS)-polyacrylamide gels, and transferred onto a nitrocellulose membrane (Bio-Rad). The membrane was incubated at room temperature with Odyssey Blocking buffer (LI-COR Biotechnology, Lincoln, NE) and sequentially probed with the respective primary antibody and its corresponding secondary antibody with near-infrared fluorescein (LI-COR Biotechnology, Lincoln, NE). Protein bands were detected with the ChemiDoc imager (Bio-Rad, Hercules, CA). Primary antibodies used were Cav-1 (D46G3), phospho-Akt (S473, T308), total Akt, phopho- and total extracellular signal-regulated kinase (ERK), Jun N-terminal kinase; also known as stress-activated protein kinase, SAPK, (JNK), p38 mitogen-activated protein kinase (MAPK), p70S6K, adenosine monophosphate activated protein kinase (AMPK), Fas ligand (FasL), Puma, survivin (Cell Signaling Technology, Danvers, MA), GRK4 (D-11), cyclin D1, Noxa, and β-actin (Santa Cruz Biotechnology).
Immunofluorescence and confocal microscopy
MCF-7 cells were grown on coverslips to 50% confluence, then rinsed with PBS, and fixed with 4% paraformaldehyde/0.2% Triton X-100 for 5 minutes. Cells were then immunostained for Cav-1 using rabbit polyclonal antibody (Cell Signaling Technology) at a 1:100 dilution overnight at 4°C before probing with secondary antibody conjugated with Alexa Fluor 488 (Thermo Fisher). Coverslips were mounted on microscope slides and detected for fluorescence under a confocal microscope.
Flow cytometry
Approximately 1 million cells of MCF-7, MCF-7 Cav-1, and MCF-7-expressing mCherry (MCF-7 mCherry) were collected in PBS and pelleted by centrifugation at 300 g for 6 minutes. Cells were then re-suspended in fresh PBS to achieve a single-cell suspension. The cell suspension was transferred in 70% ethanol and fixed for 2 hours and stored at 4°C. To stain, fixed cells were re-pelleted for 5 minutes at 300 g, washed with PBS, and re-suspended in FxCycle Violet Stain (Thermo Fisher). The cell solution was incubated at room temperature (20°C) for 30 minutes and brought to the UVA Flow Cytometry Core to be sorted into different phases of the cell cycle.
Statistical analysis
The data are expressed as mean ± SD. Comparisons between 2 groups were made by the Student t test. P < .05 was considered significant. All statistical analyses were conducted with Microsoft Excel.
Results
Expression of caveolin-1 in MCF-7 cells
MCF-7 cells were transduced with retroviral vectors containing either Cav-1 gene fused to mCherry or mCherry alone. After G418 selection, expression of Cav-1 and mCherry was examined.
Western blots showed strong bands of Cav-1 and mCherry fusion protein at the molecular weight between 50 and 75 kD in the lysates from the Cav-1-expressing line but not those from wild-type (WT) MCF-7 or MCF-7 mCherry. Because of low expression level, the endogenous Cav-1 (21-24 kD) was undetectable in all 3 cell lines (Figure 1A). A separate blot with WT MCF-7 cell only was included in Figure 1A to confirm the specificity of the Cav-1 antibody used.
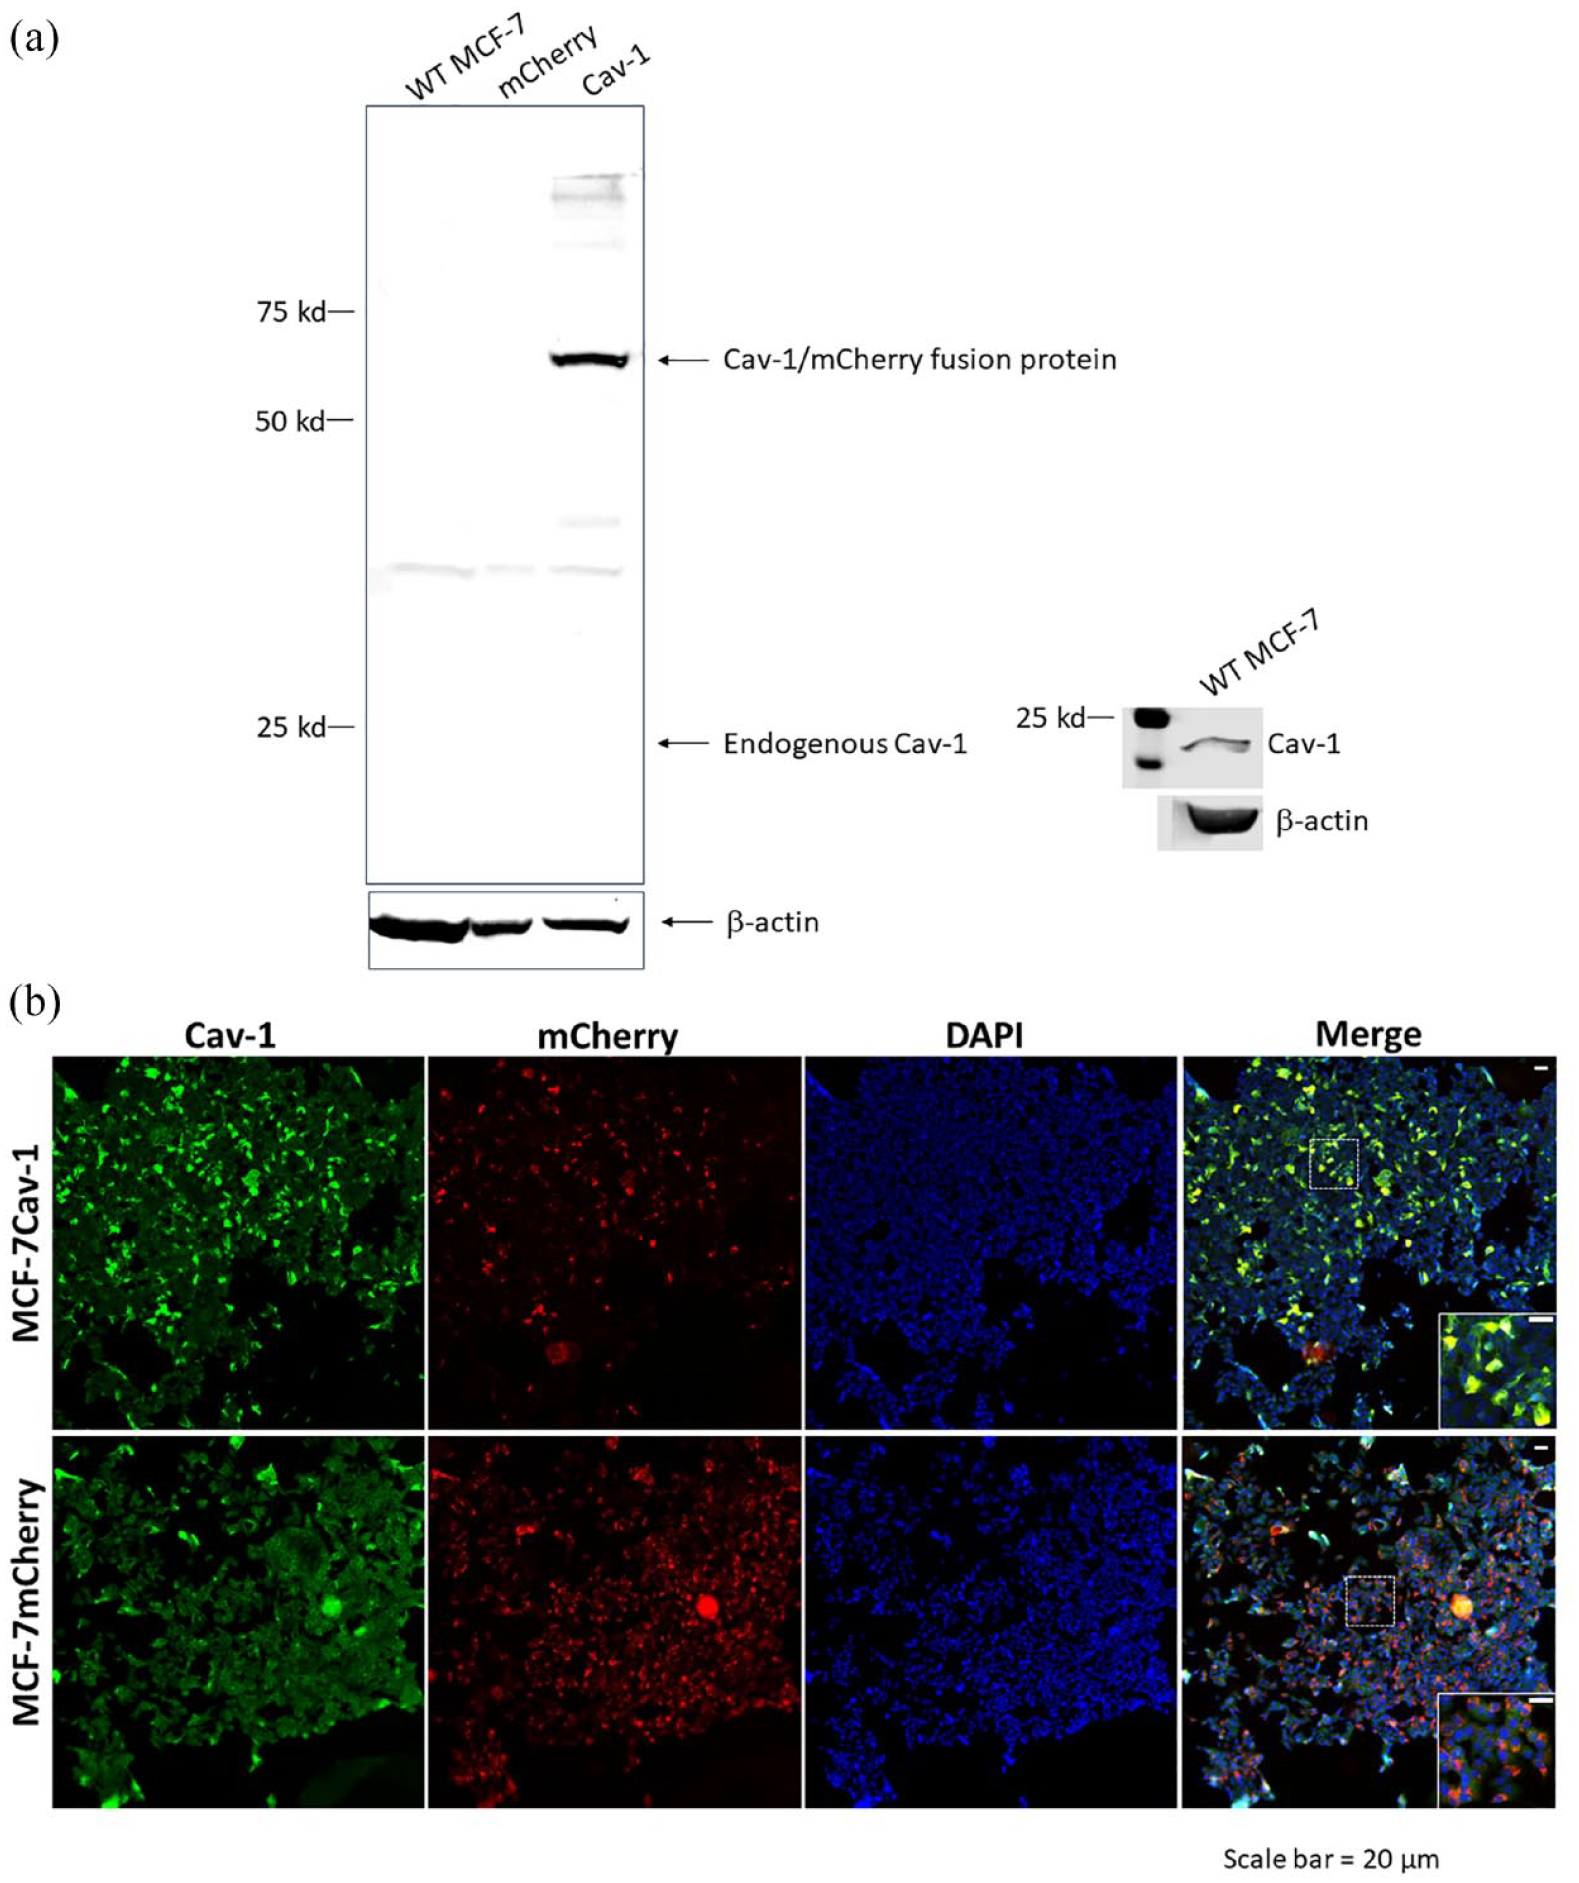
(A) Western blot of Cav-1 in WT MCF-7, MCF-7 mCherry, and MCF-7 Cav-1 cells. The amount of 50 µg total protein was loaded to each well of the gel. In MCF-7 Cav-1 cells, Cav-1 bands migrated with apparent molecular weight between 50 and 75 kD as a fusion protein with mCherry. Endogenous Cav-1 (24 and 21 kD) levels were too low to be detected in all 3 cell lines and (B) immunofluorescent staining of Cav-1.
Cav-1 expression was further validated by immunofluorescent staining using specific anti-Cav-1 antibody. In the MCF-7 mCherry cells, low levels of endogenous Cav-1 were detected. In MCF-7 Cav-1 cells, Cav-1 expression was significantly increased and the Cav-1 was co-localized with mCherry (Figure 1B). Notably, Cav-1 expression levels varied largely. Less than 20% cells were expressing high levels of Cav-1. To ensure consistent outcomes, clones of MCF-7 cells expressing high levels of Cav-1 were selected by limited dilution, pooled, and used within 8 passages in the following experiments.
Caveolin-1 expression reduced growth rate
In total, 30 000 cells were plated to 35-mm dishes. Starting from day 2 of plating, 2 wells of each cell line were counted daily for a row of 6 days. Growth of MCF-7 Cav-1 and MCF-7 mCherry cell lines were compared. As shown in Figure 2A, MCF-7 Cav-1 cells grew slower than MCF-7 mCherry cells. By day 6, the number of MCF-7 mCherry cells increased 21.3-fold and 13.3-fold for MCF-7 Cav-1 cells. The growth rate of MCF-7 mCherry cells was comparable to that of WT MCF-7 cells 9 suggesting that expression of mCherry vector did not alter their characteristics.

Growth of MCF-7 Cav-1 and MCF-7 mCherry cells: (A) Growth rate. Cell number was counted each day at same time for 7 days. Cell number is expressed as a percentage of the number on day 1. Each data point is an average of duplicate counts ± SD. The experiment was repeated twice with similar results. Shown here is a representative result; (B) cell cycle analysis. The percentage of the cells in S phase in MCF-7 Cav-1 (6.35%) is much lower than that in WT MCF-7 (14.95%) and MCF-7 mCherry cells (16.23%); and (C) cell proliferation determined by BrdU-labeling assay. BrdU-positive (green) cell and total cell number (blue) were counted, and the percentage of BrdU-positive cells was calculated. In MCF-7 Cav-1 cells, BrdU-positive cells in Cav-1-expressing cells (green and red, arrows) were also counted in addition to total BrdU positivity.
Flow cytometry analysis demonstrated that less MCF-7 Cav-1 cells (6.35%) were in S phase of the cell cycle compared with MCF-7 mCherry (16.23%) or WT MCF-7 (14.95%) (Figure 2B). Reduction in proliferation in MCF-7 Cav-1 cells was further confirmed by the BrdU-labeling assay. In MCF-7 mCherry cells, 32.72% were BrdU-positive cells. Considering inconsistent expression of Cav-1 in MCF-7 Cav-1 cells, BrdU-positive cells were counted in all cells and in Cav-1-expressing cells. It was found that the percentage of BrdU-labeled cells in all Cav-1-expressing and nonexpressing cells was slightly lower than MCF-7 mCherry cells (not statistically significant). If counting Cav-1-expressing cells, only 7.9% of this subpopulation were BrdU-positive (Figure 2C). These data clearly demonstrated that overexpression of Cav-1 suppressed cell proliferation.
Caveolin-1 expression increases apoptosis and senescence
We have noticed morphological changes in MCF-7 Cav-1 cells during tissue culture such as enlargement and vacuolization (Figure S1). These morphological changes indicated that in addition to growth inhibition, Cav-1 expression might make the cells more vulnerable to stress stimuli.
Apoptosis was first assessed by an ELISA assay. The cells were cultured in IMEM with the pH indicator, phenol red and supplemented with 5% FBS. Under this culture condition, MCF-7 cells showed very low levels of apoptosis. 13 As shown in Figure 3A, the basal level of apoptosis was 4-fold higher in MCF-7 Cav-1 cells compared with MCF-7 mCherry cells (P < .0001). The levels of apoptosis of MCF-7 mCherry cells were similar to that of WT MCF-7 cells. 13
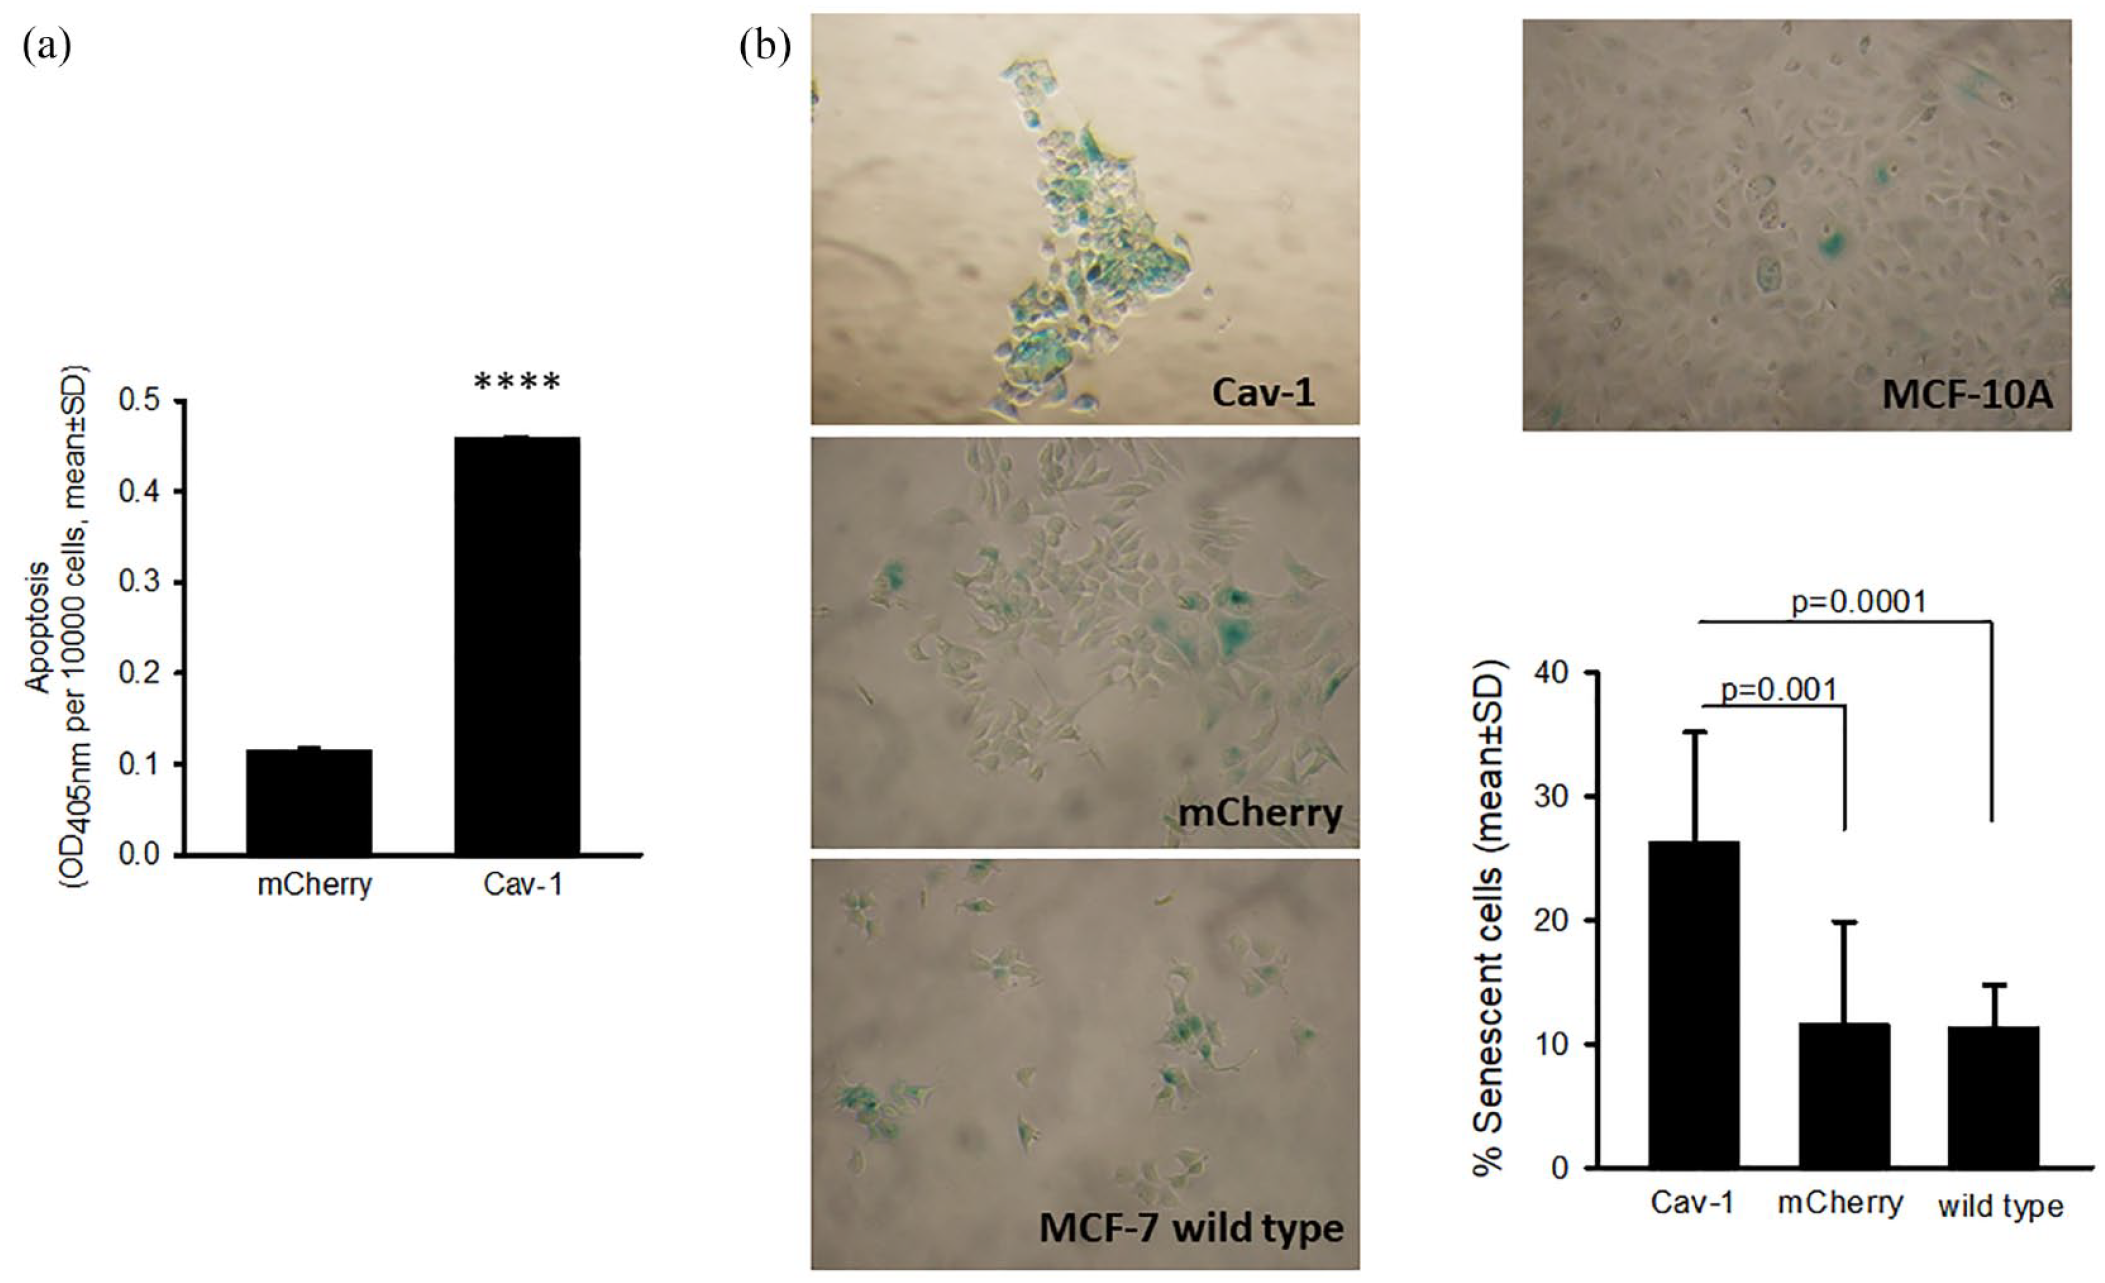
Caveolin-1 expression promoted apoptosis and senescence: (A) Cav-1 expression enhanced apoptosis. Apoptosis was expressed by absorbance at OD405 nm per 10 000 cells (mean ± SD, n = 4) (****P < .001), and (B) Cav-1 expression increased the number of senescent cells. Senescent cells (green) were counted, and the percentage of senescent cells was calculated as an average of 19 to 40 fields per each cell type. MCF-10A cells served as a negative control (0.76% senescent cells).
We then did a SA-β-gal assay and found that there was an increased percentage of senescent cells in MCF-7 Cav-1 cells (21.98%) when compared with MCF-7 mCherry (11.95%) or WT MCF-7 cells (15.02%). The differences were statistically significant (P < .001) (Figure 3B). These data indicated that increases in apoptosis and senescence also contribute to reduced growth rate of MCF-7 Cav-1 cells.
Exploration of signaling pathways in MCF-7-expressing Cav-1 cells
To determine the common cause of apoptosis and senescence, we first assessed the levels of ROS in the cells with or without Cav-1 expression. The basal ROS levels in MCF-7 Cav-1 cells were significantly higher than those in WT MCF-7 and MCF-7 mCherry cells (Figure 4A). Pretreatment with NAC slowed down ROS production (Figure S2). Hydrogen peroxide, a positive control, increased ROS levels (Figure S2). It was interesting to find that the levels of ROS with H2O2 treatment were higher in MCF-7 Cav-1 than in WT or MCF-7 mCherry cells, indicating impaired endogenous antioxidant mechanisms in these cells (data not shown).

Signaling pathways related to cell death and survival: (A) Cav-1 expression increased ROS. Reactive oxygen species levels were calculated using fluorescent intensity at 30 minutes normalized by Hoechst fluorescent intensity; (B) Akt, JNK, and p38 were highly activated in MCF-7 Cav-1 cells as shown by western blot analysis of increased levels of phosphorylated kinases; (C) adenosine monophosphate activated protein kinase was activated in MCF-7 Cav-1 cells; (D) pro-apoptotic factors FasL, Noxa, and Puma were increased in MCF-7 Cav-1 cells; and (E) cyclin D1 and survivin were downregulated in MCF-7 Cav-1 cells. The western analyses have been repeated several times with the cell lysates collected at different passages and the cells with different Cav-1-expressing levels. The data shown here were representative results reflecting the biological consequence of Cav-1 expression.
Caveolin-1 has been reported to be involved in several signaling pathways regulating cell proliferation and apoptosis. Next, we examined activation of 3 proliferation and survival-related signaling pathways, ERK1/2 MAPK, PI3K/Akt, and mTOR. All 3 signaling pathways were activated in MCF-7 Cav-1 cells (Figures S3 and 4B). Among them, Akt activation was the strongest (Figure 4B). Compared with MCF-7 mCherry cells, phosphorylation at S473 and T308 in MCF-7 Cav-1 cells were 28-fold and 8.7-fold higher, respectively. Inhibition of PI3K by LY294002 (10 µM, 4 hours) nearly completely abolished phosphorylation of Akt at both sites (data not shown). Hyperactivation of Akt could be one mechanism for enhanced ROS levels in MCF-7 Cav-1 cells because extremely high activation of Akt downregulates ROS-clearing enzymes. 14
Activation of JNK and p38 is usually triggered by a physiological stress response and results in apoptosis. As expected, phosphorylated JNK and p38 were at least 2-fold higher in MCF-7 Cav-1 cells than MCF-7 mCherry cells (Figure 4B). Cav-1 expression also increased the activation of adenosine monophosphate activated protein kinase (AMPK) (Figure 4C). AMPK is an energy sensor, and its activation leads to shutdown of energy-consuming processes. Another function of activated AMPK is to upregulate pro-apoptotic factors and facilitate apoptosis. 15 This is via phosphorylation of the transcription factor, FoxO3, and promotion of its nuclear localization. 15 Indeed, we found that more MCF-7 Cav-1 cells had nuclear FoxO3 than MCF-7 mCherry and WT MCF-7 cells (Figure S4). Accordingly, FasL, a FoxO3-regulated molecule, was upregulated in MCF-7 Cav-1 cells. Expression of Puma and Noxa, 2 pro-apoptotic factors, was also increased in MCF-7 Cav-1 cells likely via stress-stimulated p53 pathway (Figure 4D).
Caveolin-1 is a highly versatile molecule that regulates signaling processes both at the transcriptional and post-transcriptional level. Caveolin-1 participates in formation of a multiprotein complex such as E-cadherin/β-catenin. This helps sequester β-catenin to the membrane thereby precluding β-catenin/Tcf-Lef-dependent transcription of genes such as survivin and cyclin D1.16,17 As expected, we observed dramatic reduction in survivin and cyclin D1 in MCF-7 Cav-1 cells (Figure 4E). Survivin is an apoptosis inhibitor. Thus, loss of survivin is one mechanism for pro-apoptotic effect of Cav-1 overexpression. Cyclin D1 is a key cell cycle regulatory protein required for the cell to progress from G1 to S phase. Caveolin-1 expression reduced the level of cyclin D1 protein, which could explain why less MCF-7 Cav-1 cells were present in the S phase of the cell cycle in our flow cytometry assays.
Caveolin-1 expression and sensitivity to the type 1 dopaminergic receptor agonist SKF38393
Our previous studies have shown that Cav-1 expression facilitated sodium excretion from proximal tubule cells of the kidney by inhibition of GRK4 activity. 7 We hypothesize that Cav-1 expression in breast cancer cells would alter their responsiveness to agonists of D1R which have been reported to exert growth inhibition in breast cancer cells. To test this hypothesis, we conducted growth assays in MCF-7 mCherry and MCF-7 Cav-1 cells in the presence of different concentrations of the D1R agonist SKF38393. We found that SKF38393 inhibited growth of MCF-7 Cav-1 cells in a dose-dependent fashion. However, the inhibitory effect of SKF38393 occurred only at 2 higher concentrations in MCF-7 mCherry (Figure 5A). These data indicate that expression of Cav-1 makes MCF-7 cells more sensitive to SKF38393. To further explore the potential mechanisms involved, we examined whether the levels of GRK4 were altered in MCF-7 Cav-1 cells. As shown in Figure 5B, basal GRK4 levels in MCF-7 Cav-1 cells were lower than in MCF-7 mCherry cells.

Caveolin-1 expression increases the sensitivity of MCF-7 cell to growth inhibitory effect of specific D1R receptor agonist SKF38393: (A) Dose-response curves of SKF38393 on cell growth. Number of cells was expressed as percentage of the vehicle control. Each point was the average of 3 experiments. *P < .05, **P < .005, and ***P < .001 compared with MCF-7 mCherry at the same concentration by Student t test, and (B) downregulation of GRK4 in Cav-1-expressing MCF-7 cells. MCF-7-expressing Cav-1 clones were selected by limited dilution. Clones with relatively high expression of Cav-1 were collected, and subsequent cell lysates were prepared for western blot analysis of GRK4.
Discussion
Caveolin-1 plays multiple roles in cells including regulation of signal transduction, gene expression, and protein turnover.16,18 Our previous studies have demonstrated a role of Cav-1 in inhibition of GRK4 activity and enhancement of sodium excretion. 7 G protein–coupled receptor kinase type 4 is not only negatively regulating sodium excretion in the kidney but also stimulating proliferation of breast cancer cells. 11 Therefore, GRK4 is considered an intrinsic linkage between hypertension and breast cancer. 19
Caveolin-1 expression is reduced in several human tumors including breast cancer, and re-expression of Cav-1 inhibits tumor cell growth.20,21 While controversy exists, Cav-1 is generally considered a tumor suppressor in breast cancer cells both in vitro and in vivo. 22 We found in the current studies that MCF-7 Cav-1 cells exhibited slower growth rate compared with MCF-7 mCherry cells, providing additional support of the tumor-suppressive role of Cav-1. We further demonstrated that this effect is the sum of inhibition of proliferation and promotion of apoptosis and senescence.
Mechanistic exploration has revealed several significant changes in Cav-1-expressing cells. First is the reduction in the levels of cyclin D1 and survivin. These 2 factors are regulated by β-catenin-mediated transcription and inhibited by Cav-1 via preventing nuclear localization of β-catenin.16,17 Cyclin D1 is a key factor required for the cell to progress from G1 to S phase of the cell cycle, and survivin acts as an apoptosis inhibitor. Downregulation of these 2 factors by Cav-1 expression makes MCF-7 Cav-1 cells grow slower and causes more cells to undergo apoptosis.
Another surprising finding is that Cav-1 expression induces extremely high levels of Akt activation. Akt has long been regarded as a sole cell survival factor associated with tumorigenesis and resistance to cancer therapy. However, a report by Shack et al expressed the contrary. They found that overexpression of Cav-1 in HEK293 and Hela cells caused hyperactivation of Akt. Instead of promoting survival, the cells expressing Cav-1 became more sensitive to arsenite and hydrogen peroxide-induced cell death. 23 The results of this study indicate that in contrast to well-established tumorigenic properties, Akt activation does not always appear to be advantageous for cellular proliferation. Studies by Nogueira et al 14 showed that strong Akt activation increases oxidative stress that renders cells susceptible to ROS-triggered cell death. Our studies with MCF-7 cells provided additional evidence that Cav-1 expression causes high activation of Akt, which leads to increased apoptosis and senescence in these cells. We also observed higher basal levels of ROS in MCF-Cav-1 cells. Our results suggest that increased oxidative stress due to strong activation of Akt attributes to enhanced apoptosis and senescence. It should be mentioned that senescence is an irreversible process. Senescent cells are permanently out of the cell cycle and eventually die. Therefore, senescence together with apoptosis and cell cycle arrest play a role in Cav-1-mediated tumor suppression.
As a result of enhanced ROS levels in Cav-1-expressing cells, JNK and p38 MAPK were dramatically activated. These 2 members of the MAPK family are triggered by stress stimuli and associated with apoptotic cell death. 24 In addition, there are more factors activated by Cav-1 expression contributing to apoptosis including AMPK, FasL, Noxa, and Puma. These pro-apoptotic factors were upregulated either through the AMPK/FoxO3 pathway (FasL) or p53-mediated expression, such as Puma 25 and Noxa. 26
Type 1 dopaminergic receptor is expressed in breast cancer cells, and activation of these receptors by specific agonists leads to inhibition of cancer cell growth. 8 We found that MCF-7 Cav-1 cells exhibited increased sensitivity to the inhibitory effect of D1R agonist, SKF38393. Enhanced sensitivity might result from reduction in GRK4 levels, as GRK4 negatively regulates D1R function. Reduced GRK4 would prolong SKF38393-stimulated D1R activity. In addition, GRK4 acts as an independent factor to promote proliferation of breast cancer cells. 11 Lower GRK4 levels in MCF-7 Cav-1 cells slow down growth rate, which may provide an additive effect along with SKF38393. The mechanism by which Cav-1 downregulates GRK4 remains to be determined. The inhibitory effect of Cav-1 on GRK4 has been demonstrated in proximal tubule cells 7 and was confirmed in breast cancer cells in this study.
It is recognized that there are some limitations of this study. Breast cancer can be divided into several subtypes. Each type of breast cancer has different characteristics and expresses different levels of Cav-1. The results from this study are only applicable to hormone-dependent breast cancer. It has been reported that Cav-1 expression may exhibit bi-phasic changes during progress of the disease. Re-expression of Cav-1 at late stage of cancer usually is associated with metastasis. 17 Increased metastasis might partially result from cancer stem cells. While the experiments in the current studies were not designed to explore the effect of Cav-1 on cancer stem cells, a recent study has demonstrated that Cav-1 expression in MCF-7 and M.D. Anderson Metastasis Breast cancer cells (MDA-MB-231) reduced stem cell number and function. 27 It is not clear whether loss of Cav-1 in hypertensive breast cancer patients occurs in general or is restricted to cancer tissue only. Further studies are required to answer this question.
Conclusions
In summary, overexpression of Cav-1 in MCF-7 breast cancer cells inhibits cell proliferation and induces apoptosis and senescence. These tumor-suppressive effects of Cav-1 are mediated by multiple signaling pathways. To our knowledge, this study is the first report on downregulation of GRK4 in breast cancer cells by Cav-1 expression (Figure 6). It is known that Cav-1 expression is lost in most of the breast cancers, which could be one reason why GRK4 is upregulated in breast cancer cells.10,11 Since abnormal GRK4 activity impairs sodium excretion function of the kidney, loss of Cav-1 could be a risk factor for salt-sensitive hypertension and breast cancer.
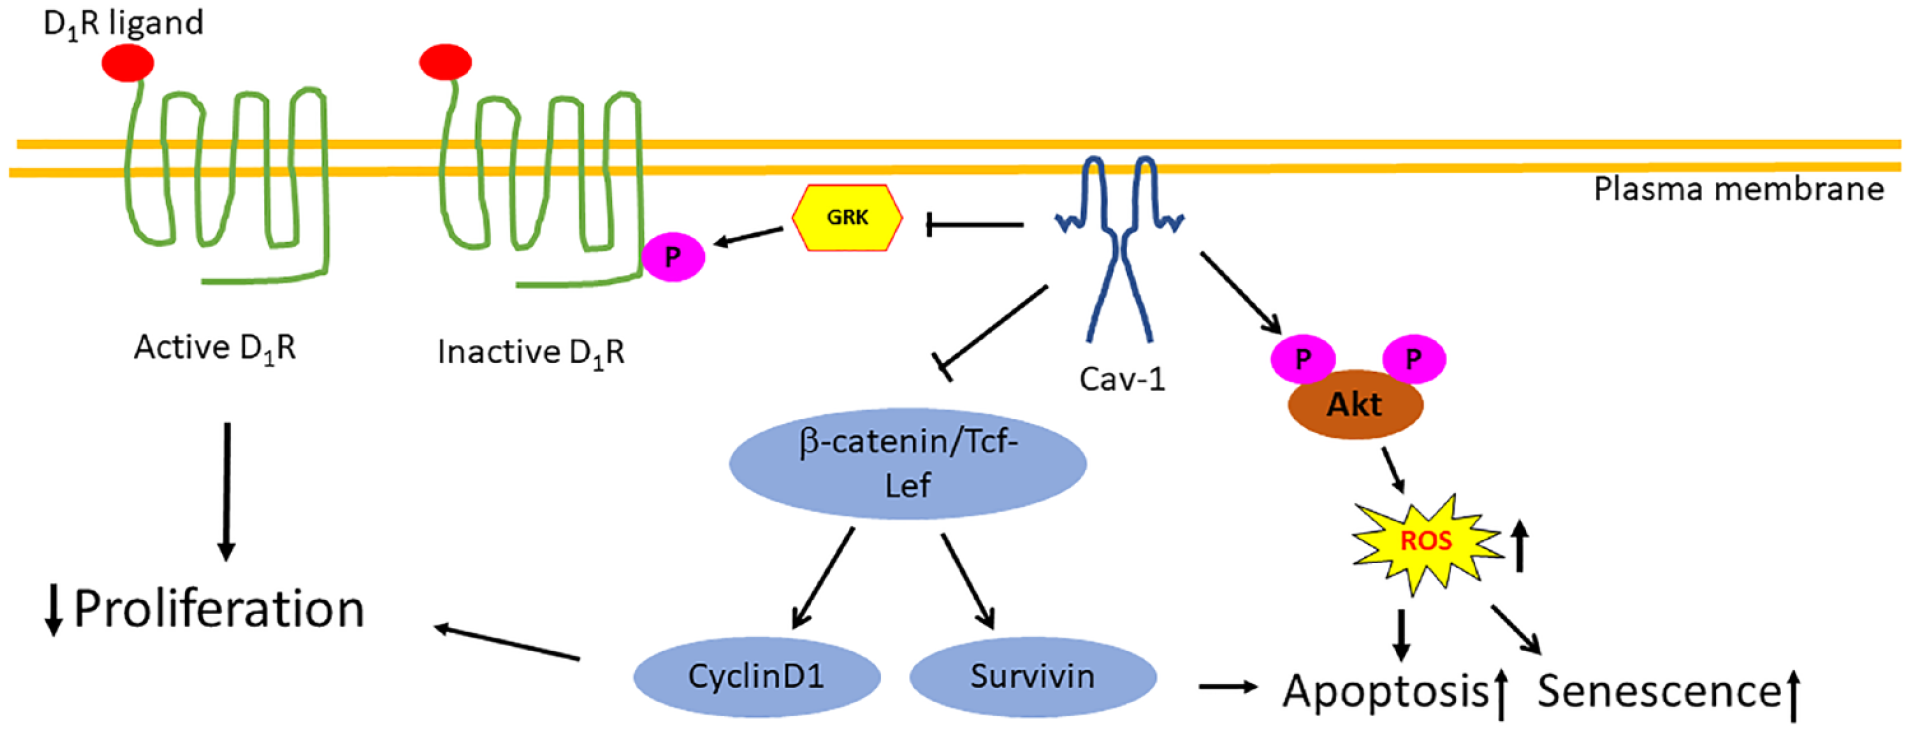
Schematic summary of the antitumor functions of Cav-1 in breast cancer cells. Caveolin-1 expression results in extremely high activation of Akt via phosphorylation at S473 and T308 which causes enhancement in the level of ROS. Reactive oxygen species induces apoptosis and senescence. Downregulation of cyclin D1 and antiapoptotic factor survivin is another mechanism of reducing proliferation and induction of apoptosis. G protein–coupled receptor kinase type 4 is the kinase that phosphorylates D1R and terminates its function. Caveolin-1 downregulates GRK4 expression which makes D1R at the active status. Activation of D1R inhibits cell proliferation.
Supplemental Material
sj-tif-1-bcb-10.1177_11782234241226802 – Supplemental material for Caveolin-1, a Determinant of the Fate of MCF-7 Breast Cancer Cells
Supplemental material, sj-tif-1-bcb-10.1177_11782234241226802 for Caveolin-1, a Determinant of the Fate of MCF-7 Breast Cancer Cells by Tina Chai, Wei Yue, Peng Xu, John Gildea and Robin Felder in Breast Cancer: Basic and Clinical Research
Supplemental Material
sj-tif-2-bcb-10.1177_11782234241226802 – Supplemental material for Caveolin-1, a Determinant of the Fate of MCF-7 Breast Cancer Cells
Supplemental material, sj-tif-2-bcb-10.1177_11782234241226802 for Caveolin-1, a Determinant of the Fate of MCF-7 Breast Cancer Cells by Tina Chai, Wei Yue, Peng Xu, John Gildea and Robin Felder in Breast Cancer: Basic and Clinical Research
Supplemental Material
sj-tif-3-bcb-10.1177_11782234241226802 – Supplemental material for Caveolin-1, a Determinant of the Fate of MCF-7 Breast Cancer Cells
Supplemental material, sj-tif-3-bcb-10.1177_11782234241226802 for Caveolin-1, a Determinant of the Fate of MCF-7 Breast Cancer Cells by Tina Chai, Wei Yue, Peng Xu, John Gildea and Robin Felder in Breast Cancer: Basic and Clinical Research
Supplemental Material
sj-tif-4-bcb-10.1177_11782234241226802 – Supplemental material for Caveolin-1, a Determinant of the Fate of MCF-7 Breast Cancer Cells
Supplemental material, sj-tif-4-bcb-10.1177_11782234241226802 for Caveolin-1, a Determinant of the Fate of MCF-7 Breast Cancer Cells by Tina Chai, Wei Yue, Peng Xu, John Gildea and Robin Felder in Breast Cancer: Basic and Clinical Research
Footnotes
Acknowledgements
Not applicable.
Declaration
Supplemental material
Supplemental material for this article is available online.
References
Supplementary Material
Please find the following supplemental material available below.
For Open Access articles published under a Creative Commons License, all supplemental material carries the same license as the article it is associated with.
For non-Open Access articles published, all supplemental material carries a non-exclusive license, and permission requests for re-use of supplemental material or any part of supplemental material shall be sent directly to the copyright owner as specified in the copyright notice associated with the article.