
Abstract
Early diagnosis of sepsis and septic shock has been unambiguously linked to lower mortality and better patient outcomes. Despite this, there is a strong unmet need for a reliable clinical tool that can be used for large-scale automated screening to identify high-risk patients. We addressed the following questions: Can a novel algorithm to identify patients at high risk of septic shock 24 hours before diagnosis be discovered using available clinical data? What are performance characteristics of this predictive algorithm? Can current metrics for evaluation of sepsis be improved using novel algorithm? Publicly available data from the intensive care unit setting was used to build septic shock and control patient cohorts. Using Bayesian networks, causal relationships between diagnosis groups, procedure groups, laboratory results, and demographic data were inferred. Predictive model for septic shock 24 hours prior to digital diagnosis was built based on inferred causal networks. Sepsis risk scores were augmented by de novo inferred model and performance was evaluated. A novel predictive model to identify high-risk patients 24 hours ahead of time, with area under curve of 0.81, negative predictive value of 0.87, and a positive predictive value as high as 0.65 was built. The specificity of quick sequential organ failure assessment, systemic inflammatory response syndrome, and modified early warning score was improved when augmented with the novel model, whereas no improvements were made to the sequential organ failure assessment score. We used a data-driven, expert knowledge agnostic method to build a screening algorithm for early detection of septic shock. The model demonstrates strong performance in the data set used and provides a basis for expanding this work toward building an algorithm that is used to screen patients based on electronic medical record data in real time.
Keywords
Introduction
Sepsis is a serious condition that arises when the body’s response to infection causes injury to its own tissues and organs and is a great cause of concern among hospitalized patients. 1 In sepsis, a systemic inflammatory response syndrome (SIRS) is caused by the infection. Sepsis can progress into severe sepsis accompanied by remote organ dysfunction. Septic shock is the most severe form of sepsis that involves presence of arterial hypotension and is associated with significantly worse outcomes. 2 The incidence rate of sepsis was found to be around 6% in 2014 with about 15% of those patients dying as well as 6.2% of those being admitted to hospice care. 3 In addition to the high incidence of sepsis in hospitals, high mortality rates, it is among the most expensive illnesses to treat in the United States. It costs a median of around US$32 421 per patient for the entire hospital stay as well as US$27 461 for the intensive care unit (ICU) costs. 4
As of now, there is no gold standard for diagnosis and prediction of sepsis and septic shock. Currently, septic shock is predominantly diagnosed based on a combination of lab tests and clinical features such as fever, low blood pressure, and difficulty breathing, although some sepsis alert systems exist.5-8 Early diagnosis of this condition is complicated by nonspecific clinical signs and symptoms and the fact that not all infections lead to sepsis and to progression into septic shock. 1 The current standard of care for septic shock includes administration of antibiotics, antifungal drugs, regulating blood volume, and ensuring sufficient tissue perfusion. Surgical source control is a measure that is used less often and is recommended at the earliest possible time to obtain the best outcome. 9 Early detection of sepsis and early administration of antibiotic treatment have been known to be the strongest modulators of outcomes in patients with sepsis. 10 Although highly desirable, early diagnosis is also more challenging to accomplish in a clinical setting as discussed earlier. Given the nonspecific nature of early symptoms, it is impractical to closely monitor all patients in the ICU. A screening algorithm that identifies patients at high risk of septic shock would enable both higher rates of early diagnosis of septic shock and better utilization of often scarce clinical resources. Such an algorithm would limit close monitoring to a much smaller patient population, making it both practicable and invaluable in the ICU setting.
Many prior efforts have been made by other research groups to develop algorithms to predict sepsis using electronic medical record data from MIMIC or other patient databases11-17; commercial early warning systems are also available. 18 It remains challenging to benchmark and compare performance of different methods due to variation in methods used to identify patient cohorts from electronic medical record data and in clinical definitions of sepsis. The research presented in this article was performed with the objective of using data-driven methods that are unbiased by expert knowledge to identify a predictive algorithm for predicting progression into septic shock.
The aim of this work is to use publicly available ICU data to develop a screening algorithm for early detection of septic shock. The algorithm built in this work identifies high-risk patients 24 hours prior to a digital diagnosis of septic shock. A diagnosis that was made by applying certain criterion to electronic medical record data is referred to as a “digital diagnosis” within the scope of this article. A data-driven approach to developing the risk stratification algorithm was adopted through use of advanced machine learning and artificial intelligence–based techniques. Data-driven approaches are unbiased by current knowledge and provide an alternative to expert knowledge-based, hypothesis-driven approaches. An anonymized clinical database containing electronic medical of close to 50 000 patients in the ICU setting from the Beth Israel Deaconess Medical Center was used for this analysis.19,20 Performance characteristics of the novel risk stratification algorithm are described in this article. We also attempted to augment currently used sepsis scores with the newly identified risk factors and aim to improve performance of the scoring systems.
Methods
Data
The MIMIC-III Clinical Database19,20 contains health records on ICU admissions from 2001 to 2012 at the Beth Israel Deaconess Medical Center. This data set is publicly available 21 and contains a wide range of medical data including laboratory test results, vital signs, diagnosis, and procedure codes. The data were imported from CareVue clinical information system 22 for admissions between 2001 and 2008 and MetaVision (provided by iMDSoft) between 2008 and 2012. The local copy of the database was hosted on a Hadoop 23 cluster and was queried using Hive. 24 R language 25 was used for the data processing and statistical analysis.
Criterion for identification of patients who have progressed into sepsis shock
A working definition for digital diagnosis of septic shock is described in this section. The definition provided here is used as the “gold standard” for (1) building a novel predictive algorithm for septic shock, (2) evaluating performance of a novel predictive algorithm for septic shock, and (3) evaluating performance of widely used scoring systems for sepsis. The criterion for identifying patients in septic shock from electronic medical record data was based on an earlier work by Kadri et al 26 The algorithm proposed by Kadri at al was adopted to enable use with the MIMIC-III database.
Figure 1 describes the timelines and the clinical criterion used to identify progression to septic shock in a patient during their stay in the ICU. A patient is considered to have gone into septic shock on day 0 if the following conditions are met: (1) Relevant vasopressor use occurs on day 0 and day 1. Vasopressor drugs that were considered are norepinephrine, epinephrine, vasopressin, dopamine, and phenylephrine. Vasopressors were identified from the input events and chart events tables in the MIMIC-III database. (2) Relevant blood culture orders were made from day −2 to day 2 relative to the onset of septic shock. Blood culture orders were identified from the microbiology events table from the database. (3) Administration of a new antibiotic or antifungal from day 0 to day 3 is considered relevant to identification of onset of septic shock. Similarly, parenteral administration of antibiotic between day −2 and day 2 is also considered relevant. Drug administration was identified from the input events table based on National Drug Codes (NDCs). National Drug Codes from the MIMIC-III database were mapped to the complete NDC directory as listed by the Food and Drug Administration. 27 The drug class categories as defined in the NDC directory were used to identify 2704 antibacterial and 560 antifungal drugs. Based on route of administration information from the NDC directory, 1252 antibacterial and 226 antifungal drugs were identified to characterize parenteral administration of antimicrobials. Details corresponding to identification of various features listed here are available in the supplementary material.
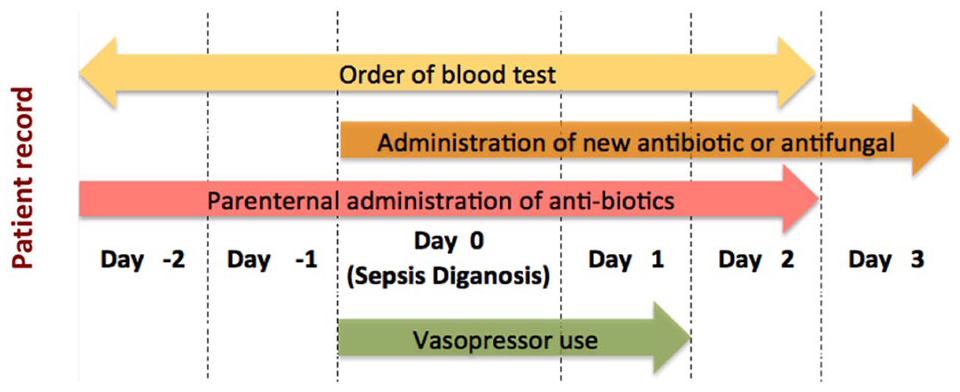
Occurrence of septic shock in each patient is identified based on 2 conditions: (1) Presence of an indicator of shock (vasopressor use) and (2) at least one indicator of presumed infection: blood culture test, administration of antibiotics or antifungals. Day 0 is considered to be the day of onset of septic shock. Timelines for identification of conditions are indicated in the figure.
Patient cohort selection
A cohort of “septic shock patients” or cases was built by applying the algorithm for digital diagnosis of septic shock as described previously. A control cohort was identified by randomly sampling from all admissions in the database not including patients who have been identified as progressing into septic shock. No matching at the individual patient level was performed—a simple random sampling approach was taken. For each patient in the control cohort, a time point during their ICU stay was chosen for notional diagnosis of septic shock. The time points for notional diagnosis of septic shock in control patient population was chosen as follows: (1) the number of hours of hospital stay prior to diagnosis of septic shock was identified for each patient in the septic shock cohort and (2) time point of notional septic shock for each patient in the control cohort was sampled from the time points calculated from the septic shock cohort.
For each patient in the control cohort, a time point for notional diagnosis of sepsis was chosen as described above. A time point for notional diagnosis of septic shock was chosen to temporally align patients from the septic shock and control cohorts. Patients in the control cohort do not have a diagnosis of septic shock at the time of notional septic shock, however, relevant lab and diagnosis code data for the control cohort patients was determined based on the time of notional septic shock.
Data processing for construction of Bayesian networks
For patients in the septic shock and control cohort, data relevant to lab events, specifically the lab test item ID and the results from manual interpretation, were extracted from the MIMIC-III database for all visits. The extracted lab data were inherently discrete with the following levels: normal, abnormal, delta (a large or sudden change of a lab result from the previous test result), and missing data. If a lab measurement was not made for the time window under consideration, the lab measurement was interpreted as “not measured.” The International Classification of Diseases, Ninth Revision (ICD-9) diagnosis and procedure codes for both cohorts were extracted from the MIMIC-III database. The large number of ICD-9 codes were reduced using the Clinical Classification Software 28 (CCS) algorithms from the Agency for Healthcare Research and Quality. The CCS data set allows for group similar diagnostic and procedure codes to increase the density of the data and improve interpretability of the codes.
A data set representing snapshots of the medical record of the patients 24 hours prior to the diagnosis of septic shock was created. For lab data, to increase the completeness of the patient profiles, all lab result data between 24 and 30 hours prior to diagnosis of septic shock was considered. For diagnosis and procedure codes, if the code was observed any time prior to 24 hours preceding septic shock diagnosis, it was assigned as “present.” If the diagnosis or procedure code was not observed any time prior to the time point, it was assigned as “absent.”
Model building using bAIcis
An integrated data set containing lab data, diagnosis, procedure, and observation of septic shock was created containing all patients in both the septic shock and control. A Bayesian network containing inferred cause-and-effect relationships between variables in the data set was built using bAIcis. The method has been described in previous studies.29,30 Demographic information was considered to be fixed information regarding the patients. Therefore, in the causal network, no other variables were permitted to drive changes in the demographic characteristics of the patients. Due to temporal nature of the septic shock diagnosis in relation to other data elements, the diagnosis of septic shock was not permitted to causally drive changes in other variables in the data set. An ensemble of 500 causal networks were built and the results were summarized as a single representative network. The edges (edges link variables/nodes in network) were weighted based on the frequency of observation in the ensemble of networks. The summarized causal network was then filtered to retain only interactions that were observed with a frequency of 0.4 or greater. A subnetwork was selected from the summarized network to include risk factors that drive progression into septic shock. A regression model was built using factors from the subnetwork around the outcome of septic shock. Multiple thresholds were selected to obtain the most desirable model performance in a clinical application. Factors included in the regression model were manually selected from the subnetwork based on their power to predict septic shock.
Calculation of other sepsis scores
Sequential organ failure assessment (SOFA), quick SOFA (qSOFA), modified early warning score (MEWS), and SIRS were calculated. Based on the scores calculated, patients were classified as “high risk of septic shock,” “low risk of septic shock,” or “NA” (score could not be calculated). The SOFA scores 31 were calculated based on published guidelines using data from MIMIC-III. Data from the chart events, lab events, medication, and diagnosis tables were used. Relevant item IDs corresponding to clinical measure of interest such as coagulation were identified though text searches and manual matching. Six categories (Glasgow Coma Scale [GCS], liver function, coagulation, renal function, respiratory function, and cardiovascular function) were evaluated and the total SOFA score was calculated. Changes in SOFA score could not be estimated from the data due to lack of resolution in the data set. Alternatively, a threshold of 4 was chosen to assign patients to the “high risk of septic shock” group. If all measures were unavailable or could not be calculated from the data and the SOFA score was less than the threshold, the SOFA score was set to “NA” to indicate it could not be calculated. For all remaining patients, an assignment of “low risk of septic shock” was made. The qSOFA score was calculated by accounting for mental status, respiratory rate, and blood pressure as described by Seymour et al. 32 If the qSOFA score was 2 or higher, an assignment of “high risk of septic shock” was made. If the qSOFA score was 1 with all 3 measures available in the data set, an assignment of “low risk of septic shock” was made. For the remaining patients, qSOFA-based assignment of septic shock was set to “NA.”
The SIRS score was calculated based on 4 criteria: body temperature, heart rate, respiratory rate, and white blood cell counts. 33 Patients whose scores added up to 2 or greater were considered positive for SIRS (“high risk of septic shock”) while other patients where the score was calculated were negative for SIRS (“low risk of septic shock”). The Modified Early Warning Score (MEWS) 34 was calculated based on the patients systolic blood pressure, heart rate, respiratory rate, temperature, and Alert, Voice, Pain, and Unresponsive (AVPU) scores. The AVPU 35 scores which are an approximation of the GCS scores were not directly available in the MIMIC-III database and hence were not estimated. The GCS scores were used in place of AVPU scores based on work by Kyriacos et al. 36 The GCS scores were available in the MIMIC-III database. A MEWS score of 2 or greater was used for an assignment of “high risk of septic shock,” whereas a combination of availability of all data and score of less than 2 was used for assignment of “low risk of septic shock.” All other patients were assigned to “NA” category based on MEWS scores.
Risk factor selection for predictive model
All first- and second-degree neighbors of septic shock diagnosis from the cause-and-effect networks were considered for final model selection. For each Bayesian network, stepwise forward selection was performed to identify neighbors that were most predictive of septic shock. Based on manual analysis of the selected factors, lab results that were most predictive of sepsis were identified. Threshold for the general linear model for predicting septic shock was selected to maximize sensitivity and specificity. All variables considered were discrete variables as described earlier in the “Methods” section. A de novo predictive model was built based on lab values that were identified through this method. The possible discrete values for the lab values were “not measured,” “normal,” and “abnormal.” A decision tree was built manually to enhance the interpretation of the regression model.
Results and Discussion
Patient cohorts and novel predictive model for septic shock
A total of 872 septic shock patients and 8293 control patients were identified from the MIMIC-III database. Septic shock patients were identified using the algorithm for digital diagnosis as described in the “Methods” section. The control cohort only contains patients who did not have a digital diagnosis of septic shock during their stay at the ICU. Details of the patient populations are shown in Tables 1 and 2. As shown in Table 2, the patient cohorts have differences in the demographic characteristics. For example, there is a difference in age distribution of patients in the 2 cohorts. It is already known that patient age increases the risk of sepsis. 37 In line with this expectation, from Table 2, we can see that the control population tends to be younger. Diagnosis of septic shock is associated with significantly higher mortality rates while in the ICU (relative risk of death in septic shock patients = 2.09) as has been documented in previous studies.2,38
Patient cohort for sepsis was identified based on definition as described in Figure 1.
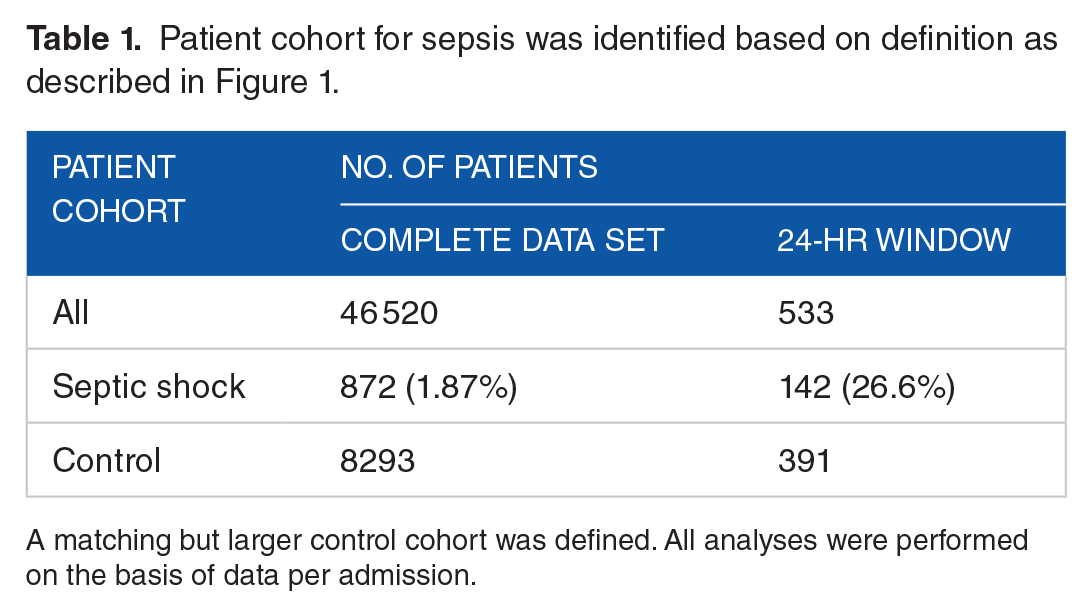
A matching but larger control cohort was defined. All analyses were performed on the basis of data per admission.
A χ2 test was performed to compare the patient characteristics between the control and septic shock populations.

Abbreviation: ICU, intensive care unit.
The null hypothesis that both control and sepsis populations are similar was rejected for all 4 characteristics (P < .01). Septic shock patients tend to be older, have a higher proportion of men, and have higher death rates during ICU stay.
For 533 patients (391 control cohort patients and 142 septic shock cohort patients), data were available at least 24 to 30 hours prior to diagnosis of septic shock. Other patients did not contain any data earlier than 24 hours prior to diagnosis of septic shock. This cohort of 533 patients (24-hour cohort) was used to infer Bayesian cause-and-effect networks. The data set consisted of interpretations of 48 lab tests, 126 ICD-9 diagnosis code groups, 4 procedure code groups, patient sex, patient age, death during ICU stay, and digital diagnosis status of septic shock. In the 24-hour cohort, a large proportion of the patients that died during the ICU stay had a digital diagnosis of septic shock (43%) comparable with published accounts of causes of ICU mortality.39,40
Figure 2 shows the complete cause-and-effect network and some sample subnetworks. The network after filtering out low-frequency edges consisted of 181 nodes connected by 353 edges. When 2 data features are connected by an edge in the network, it should be interpreted as the upstream feature (demographics, diagnosis, procedure, or lab result) probabilistically leading to the downstream feature (new diagnosis, procedure being performed, or specific lab test status) in a patient. For example, from the inset in Figure 2, it can be inferred that patient age trends with high chances of diagnosis of “coronary atherosclerosis and other heart disease.” This inference is in line with the knowledge that the risk of atherosclerosis and heart disease goes up with age. As a second example from the inset panel, “disorders of lipid metabolism” (which includes codes for high cholesterol levels) is linked to “coronary atherosclerosis and heart disease” as expected. A subnetwork around septic shock is shown in Figure 2 (right panel). Several diagnosis code groups and lab tests are linked to septic shock.
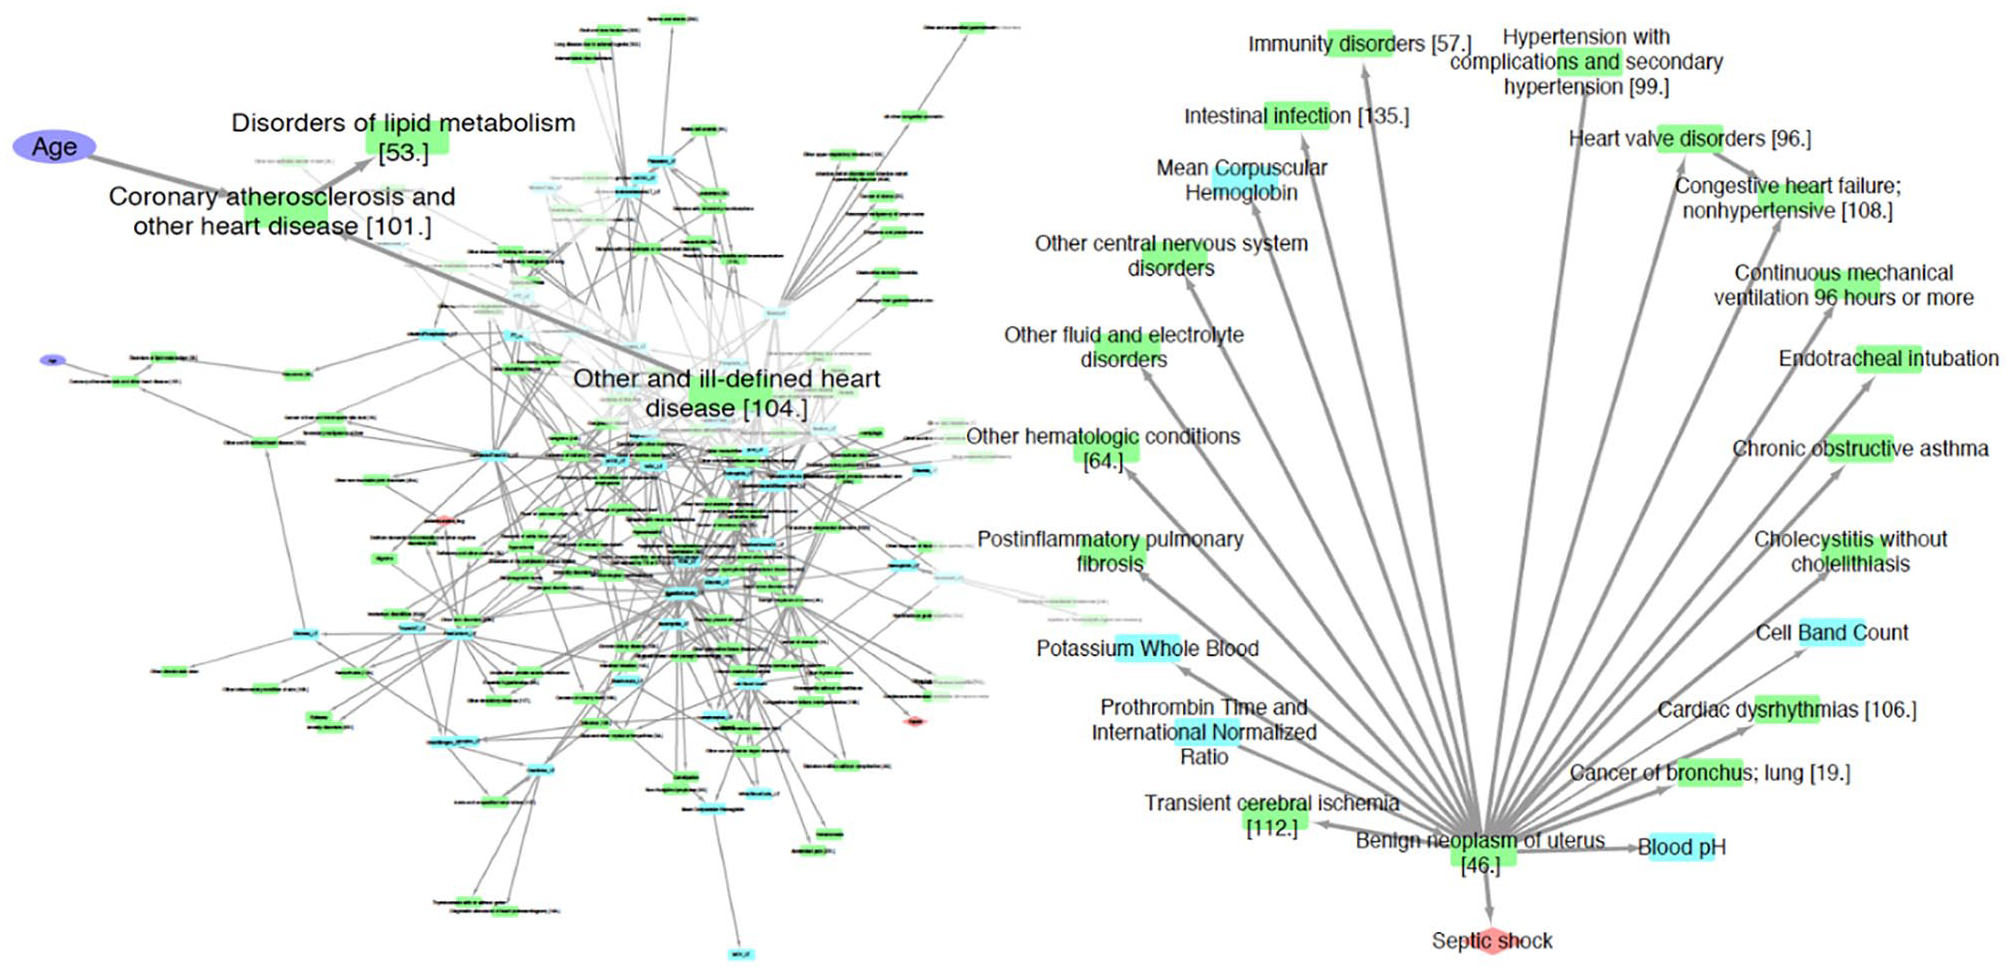
The left panel shows the complete summary network from bAIcis. A zoomed-in view of a portion of the complete network including age has been superimposed on the complete network. The right panel shows the first- and second-degree neighbors of septic shock. Key for nodes in network: purple ellipse—patient demographics, orange diamond—outcomes (death during intensive care unit stay, septic shock), green rectangle—diagnosis and procedure codes, blue rectangle—lab tests.
The final regression model that was selected from the selected subnetwork (from Figure 2) is shown in Figure 3. Figure 3 also shows details of the predictive model that was built and its performance characteristics. The model attempts to classify patients in high- or low-risk categories for sepsis based on the status of several lab tests. The lab tests in the predictive model (hemoglobin levels, blood pH, and whole blood potassium levels) were assigned values of not measured and measured (normal or abnormal). A tree representation of the regression model is also shown in Figure 3 to enable easy interpretation of the model.

(A) This panel shows the details of the regression model for predicting patients’ risk of progressing into septic shock 24 hours prior to diagnosis of septic shock. (B) Two different model cutoffs were selected for assessing model performance. (C) Receiver operating characteristic curve for model. Orange dashed line—0.15 cutoff, green dashed line—0.23 cutoff. The AUC curve was built by interpolating between points measured in the data set as predictive data was discrete. (D) This panel shows a decision tree that represents the regression model used to identify patients at high risk of sepsis. Two different thresholds were selected to allow for different false-negative and true-positive rates. The thresholds are 0.23(*) and 0.15(+). Predictions are made to classify patients as “high” risk and “low” risk. For each prediction, the following information is presented: (number predicted/actual numbers based on assessed septic shock risk). AUC indicates area under the curve; NPV, negative predictive value; PPV, positive predictive value.
Comparison With current tools for evaluation for septic shock
We attempted to improve current scoring systems such as SOFA by building regression models. The “enhanced” models were defined as follows: “Progression to septic shock” − Scoring method (One of SOFA, qSOFA, SIRS, MEWS) + “lab values from de-novo predictive model.” The “score-only” models only used one of SOFA, qSOFA, SIRS, or MEWS. Performance of the “score-only” models and the “enhanced” models on the MIMIC-III database is shown in Table 3. Only patients for whom both the score calculation was possible and lab data were available for 24-hour time point were included in this analysis. Cohorts for each score were created separately based on data availability. It was observed that while the SOFA score was more complex due to the large number of clinical measures needed, the data were more readily available (279 patients in cohort). Cohorts for other scores were smaller due to larger degree of missingness of relevant data.
Performance of “score-only” and “enhanced” models.

Abbreviations: MEWS, modified early warning score; qSOFA, quick sequential organ failure assessment; SIRS, systemic inflammatory response syndrome; SOFA, sequential organ failure assessment.
Youden index was used for threshold selection in the “score-only” models. Threshold for the “enhanced” models were calculated by fixing either sensitivity or specificity to that of corresponding “score-only” models. The values in italics were optimal threshold using Youden’s index.
Discussion
While several definitions of sepsis (sepsis 1, sepsis 2, and sepsis 3) are in use, they define different patient populations with differing clinical trajectories. Sepsis 1 and sepsis 2 have been shown in several studies to have poor sensitivity and hence have lower mortality rates41-43 when compared with sepsis 3. While, in theory, any definition of sepsis can be used in the development of predictive algorithm, the intended end point of this work was to develop a screening algorithm for septic shock. Sepsis 3 was chosen as a basis of this work due to greater specificity and higher mortality rates in this population depending on patient’s responsiveness to fluids, need for vasopressor use, and lactate levels. Using training data with higher specificity is likely to result in an algorithm with better clinical utility as a screening tool for sepsis—identify a small, high-risk patient subpopulation.
It has been shown in several studies that even small delays in diagnosis of sepsis can lead to significant impacts on outcomes44-46 in the form of high mortality rates. Therefore, we attempted to build an algorithm to predict patients at risk of progression into septic shock 24 hours ahead of time. Data corresponding to patient status between 24 and 30 hours prior to diagnosis of septic shock were used to create predictive model for septic shock. Many prior attempts have been made to develop such algorithms and early warning has ranged from 4 to 24 hours prior to diagnosis of sepsis.11-17 Effective comparison of various algorithms, though, possible will involve major efforts and are outside of the scope of the work presented here. Complexity in comparing algorithms arises from multiple causes—variations in definitions of sepsis, reproducibility of methods, differences in evaluation of model performance, and data sets used.
One potential clinical application of a screening tool for septic shock is that it is used to identify a small subset of patients at very high risk. It should be feasible to closely monitor these patients or potentially start early intervention prior to confirmed diagnosis of septic shock. These high-risk patients can be provided antimicrobial treatments and fluids as they are known to be the most effective therapies for septic shock.47-49 Early administration of antibiotics and fluids has been shown to provide most benefit measured through mortality rates.50-53 Use of antimicrobial treatments and fluid resuscitation is relatively benign, whereas the outcomes can be lethal if treatment is delayed. Given that earlier detection of sepsis is known to result in better outcomes, therefore, use of algorithm can facilitate better allocation of resources to identify patients with sepsis early in the course of the disease. Despite the small number of patients who develop septic shock, this algorithm has moderately high positive predictive value and high negative predictive value as shown in Figure 3. Additional work is necessary to validate the algorithm using a larger or more diverse patient population.
A few different scoring metrics have been created for clinical use to track sepsis in patients in ICU. One of the most well-known scores to assess sepsis is the sepsis-related organ failure assessment (SOFA) score. It was introduced in 1996 by Vincent et al. 54 A variant of the SOFA score, qSOFA, is primarily used for mortality prediction but not to clinical track sepsis. Modified early warning score has been used as a tool for screening for sepsis and to identify patients at risk of clinical deterioration. 55 Systemic inflammatory response syndrome33,56 scores are also used to assess patient sepsis status.
From these results shown in Table 3, we observe that while calculation of qSOFA is based only on a few measures and therefore is easy to estimate in the clinic, the model performance in risk stratification of patients is weak as has been observed in several earlier studies.57-59 Only about half the patients at high or low risk of developing septic shock are classified correctly. The qSOFA has been observed to be a better predictor of in-hospital mortality but poorly predictive of severe sepsis. 60 Based on results of this analysis, we concur with earlier studies that qSOFA score is a poor predictor of severe sepsis or septic shock. The performance of qSOFA could be improved by adding variables from the de novo sepsis prediction algorithm. The SOFA score while having good model performance in correctly classifying risk is based on many more variables and hence is more difficult to calculate in the clinical setting. Based on the implementation of SIRS and MEWS scores, they are observed to have strong performance in identifying patients who are at low risk of septic shock but do not identify a large majority of patients at high risk of septic shock. Some previous work has shown that SIRS and SOFA scores have low sensitivity 59 validating our observations. The SOFA score could not be significantly improved by augmenting with the de novo model, whereas the specificity could be improved in the augmented models for SIRS and MEWS.
Conclusions
In this article, we present an algorithm for screening patients at high risk of septic shock and a number of novel risk factors for sepsis that were discovered using data-driven approaches and advanced statistical analysis techniques. The screening tool built as part of this work should be further developed for clinical use where it will be used to screen for patients in need of close monitoring due to their increased risk of developing septic shock. This algorithm was developed on data from one hospital system. Therefore, additional work needs to be done to validate and refine the risk stratification model presented here on a larger multicenter data set.
The novel risk factors are laboratory measurements and are accessible in the hospital setting. The incorporation of the new data into the currently used sepsis prediction models provides a modest improvement of the prediction accuracy. However, even a slight improvement in patient selection could potentially have an enormous financial impact and save patient lives.
Supplemental Material
supplementary_file_1_xyz20388116aa5c5 – Supplemental material for A Data-Driven Approach to Predicting Septic Shock in the Intensive Care Unit
Supplemental material, supplementary_file_1_xyz20388116aa5c5 for A Data-Driven Approach to Predicting Septic Shock in the Intensive Care Unit by Christopher R Yee, Niven R Narain, Viatcheslav R Akmaev and Vijetha Vemulapalli in Biomedical Informatics Insights
Footnotes
Funding:
The author(s) disclosed receipt of the following financial support for the research, authorship, and/or publication of this article: This work was funded by Berg LLC.
Declaration of conflicting interests:
The author(s) declared the following potential conflicts of interest with respect to the research, authorship, and/or publication of this article: The authors are employees of Berg LLC. N.R.N. is also a director and shareholder of Berg LLC.
Author Contributions
CRY and VV performed the analysis. NRN, VRA, VV conceived the idea of this study and VV wrote the manuscript. NRN, VRA and VV worked in the final approval of the version to be published.
Supplemental Material
Supplemental material for this article is available online.
References
Supplementary Material
Please find the following supplemental material available below.
For Open Access articles published under a Creative Commons License, all supplemental material carries the same license as the article it is associated with.
For non-Open Access articles published, all supplemental material carries a non-exclusive license, and permission requests for re-use of supplemental material or any part of supplemental material shall be sent directly to the copyright owner as specified in the copyright notice associated with the article.