
Abstract
Background:
Public health concerns over the addictive potential of electronic cigarettes (e-cigs) have heightened in recent years. Brain function during e-cig use could provide an objective measure of the addictive potential of new vaping products to facilitate research; however, there are limited methods for delivering e-cig aerosols during functional magnetic resonance imaging (fMRI). The current study describes the development and feasibility testing of a prototype to deliver up to four different e-cig aerosols during fMRI.
Methods:
Standardized methods were used to test the devices’ air flow variability, nicotine yield, and free radical production. MRI scans were run with and without the device present to assess its safety and effects on MRI data quality. Five daily smokers were recruited to assess plasma nicotine absorption from e-liquids containing nicotine concentrations of 8, 11, 16, 24, and 36 mg/ml. Feedback was collected from participants through a semi-structured interview and computerized questionnaire to assess comfort and subjective experiences of inhaling aerosol from the device.
Results:
Nicotine yield captured from the aerosol produced by the device was highly correlated with the nicotine concentration of the e-liquids used (R2 = 0.965). Nicotine yield was reduced by a mean of 48% and free radical production by 17% after traveling through the device. The e-liquid containing the highest nicotine concentration tested (36 mg/ml) resulted in the highest plasma nicotine boost (6.6 ng/ml). Overall, participants reported that the device was comfortable to use and inhaling the e-cig aerosols was tolerable. The device was determined to be safe for use during fMRI and had insignificant effects on scan quality.
Conclusions:
With the current project, we were able to design a working prototype that safely and effectively delivers e-cig aerosols during fMRI. The device has the potential to be used to assess brain activation during e-cig use and to compare brain reactivity to varying flavors, nicotine concentrations, and other e-cig characteristics.
Introduction
Public health concerns over the addictive potential of electronic cigarettes (e-cigs) have heightened in recent years, especially amid anecdotal reports of youth never tobacco users becoming addicted to these devices. 1 Nicotine is the primary addictive substance in e-cigs, and its delivery varies widely with different types available. For example, some studies have reported that first generation “cig-a-like” devices that resemble the size and shape of a cigarette can deliver about 12 times less nicotine than a combustible cigarette; more advanced devices that come with larger tanks and batteries can deliver about half the nicotine of a combustible cigarettes; and some “podmod” devices, like the popular JUUL brand, can deliver nicotine levels similar to those from a combustible cigarette.2-4 Many e-cig designs are small which allows users to vape in more places where cigarettes cannot be smoked and to “stealth vape” where it is restricted. 5 The combination of potentially high levels of nicotine and increased frequency of use places e-cig users at high risk for nicotine addiction.
Empirical support for the addictiveness of e-cigs is still limited, in part by the changing characteristics of these products and a lack of validated methods for measuring e-cig dependence. Several self-report measures were developed specifically to assess dependence on e-cigs based on use behaviors and perceived self-control over use, including, the Penn State Electronic Cigarette Dependence Index 6 (PSECDI) and the E-cigarette Dependence Scale 7 (EDS). In one study, approximately 75% of e-cig users who transitioned from smoking reported their dependence on e-cigs was weaker than their former dependence on cigarettes. 8 In addition, two comparisons of e-cig users and smokers found lower self-reported dependence among e-cig users.6,9 The low levels of dependence on the early e-cig products may not apply to those with higher nicotine outputs, such as JUUL. Another study found similar self-perceived dependence among JUUL and other e-cig users with a single self-report item in the International Tobacco Control Policy Evaluation Project; however, JUUL users were two times more likely to have made an e-cig quit attempt than other e-cig users. 10 Despite the relatively low levels of self-reported dependence, e-cig users reported unsuccessful quit attempts. 10 Self-report measures may be missing important aspects of addiction to e-cigs which could be captured by objective measures. In addition, an objective measure may help us to better understand how e-cig characteristics influence their addictive potential.
Addiction is widely considered a biobehavioral disease that is driven by changes in brain function that lead to compulsive drug use. 11 Functional magnetic resonance imaging (fMRI) is one method that measures blood-oxygen level-dependent (BOLD) activity in the brain during drug use. fMRI has been used to identify the acute and long-term neural impacts of drugs of abuse on the brain, including nicotine. 12 In addition to nicotine, smoking is paired with sensory and behavioral aspects that enhance the rewarding effects of cigarettes and contribute to addiction.13,14 We know that e-cig characteristics, especially flavorants, are major contributors to e-cig initiation and are suspected to be involved in the development of e-cig addiction, although empirical support is still limited.15,16 Brain function during e-cig use and in response to e-cig characteristics could provide an objective measure of the addictive potential of new vaping products as they emerge on the market. In addition, brain reactivity during e-cig use can potentially be used to measure levels of e-cig addiction among current users.
Research measuring brain function during e-cig use is currently limited by concerns about safety and data quality while conducting fMRI with an e-cig present. The ferromagnetic e-cig parts may be a safety concern during scanning and these parts and potential movement during use could affect MRI data quality. Wall and colleagues found that five e-cig devices that were common at the time of the study did not pose safety concerns or negatively impact data quality during fMRI, suggesting that these barriers can be overcome by using smaller, first generation devices. 17 Despite this novel finding, no other studies known to our group have used e-cigs to measure brain function during fMRI. While the use of one e-cig device during fMRI is a leap forward in this area, studies aiming to compare and contrast different features of aerosols or various conditions, such as flavors or nicotine levels, are best conducted with the use of a controlled aerosol delivery system that delivers aerosols generated from different e-cigs during the same scanning session.
Studies assessing the effects of e-cig conditioning to flavor and nicotine currently use e-cig images and smells to elicit cues. 15 There is recent support that smelling aerosols results in similar hedonic ratings as vaping them and elicits brain activity15,18; however, aerosol smells may not elicit brain activity robust enough to find effects of e-cig conditioning. 15 For example, one study assessed the effect of various e-cig flavors paired with sweetener and nicotine additives on nucleus accumbens reactivity to e-cig images and smells. 15 There was an effect of e-cig images on brain reactivity, but no effect of smell. 15 While e-cig cues provide important information about the brain’s response to e-cigs, inhaling aerosols directly can provide a measure of brain activation that is more relevant for our understanding of real world use.
For these reasons, our team developed a prototype that works in combination with a computerized olfactometer to deliver up to four e-cig aerosols during fMRI. Here we report on the device design and materials used to build the device, which are common materials that can be purchased readily online or in hardware stores. While computerized aerosol delivery devices have been developed for preclinical animal research, 19 we designed and tested the current prototype to safely deliver aerosols to humans in the magnetic resonance environment. Our ultimate goal is to systematically compare brain reactivity to aerosols of various constituents, flavors, and nicotine concentrations. Therefore, we measured the devices reliability, effect on MRI scan quality, as well as its efficiency and safety in delivering nicotine for human intake.
Methods
The MRI electronic aerosol delivery system (MEADS)
Our design and development team consisted of investigators with expertise in addiction neuroscience, tobacco biomarkers, food science, human olfaction, magnetic resonance, and electrical engineering. The current design was based on equipment designed by author ZB to deliver e-cig aerosols to animals in laboratory exposure studies. We combined this equipment with a computerized air compressor (aka. olfactometer) being used by our team to deliver odors for fMRI research on human olfaction.
The MEADS design is illustrated in Figure 1 and detailed by numbers corresponding to the following description and materials listed in Table 1. After several iterations, the final device includes four plastic chambers made from Uline clear plastic tubes with vinyl end caps. Tubing is connected via plastic push-to-connect adapters on the vinyl end caps with one end having an input and output tube and the other only an input tube. The end with only input tubing is connected to a fluorinated ethylene propylene (FEP) Teflon tube that is attached to a computerized olfactometer that controls the timing and flow of air to each chamber. The output tubing on the other end consists of 1.22 m (4′) of vinyl tubing connected to a 2.37L (2.5 QT) plastic container. The plastic container is designed to be similar to an asthma inhaler spacer that collects the aerosol prior to inhalation. The spacer has air inlet holes with a check valve in the side and a tube with a fitted mouthpiece for the participant to inhale the aerosol. Commercially available, breath-actuated, variable voltage e-cigs are connected to the input tubing inside each chamber via the e-cig mouthpiece (9). The e-cig cartomizers are pre-filled with the desired e-liquid.

Image of MRI Electronic Aerosol Delivery System (MEADS). Numbered annotations correspond to the parts listed in Table 1.
Device materials and manufacturer or distributor details.
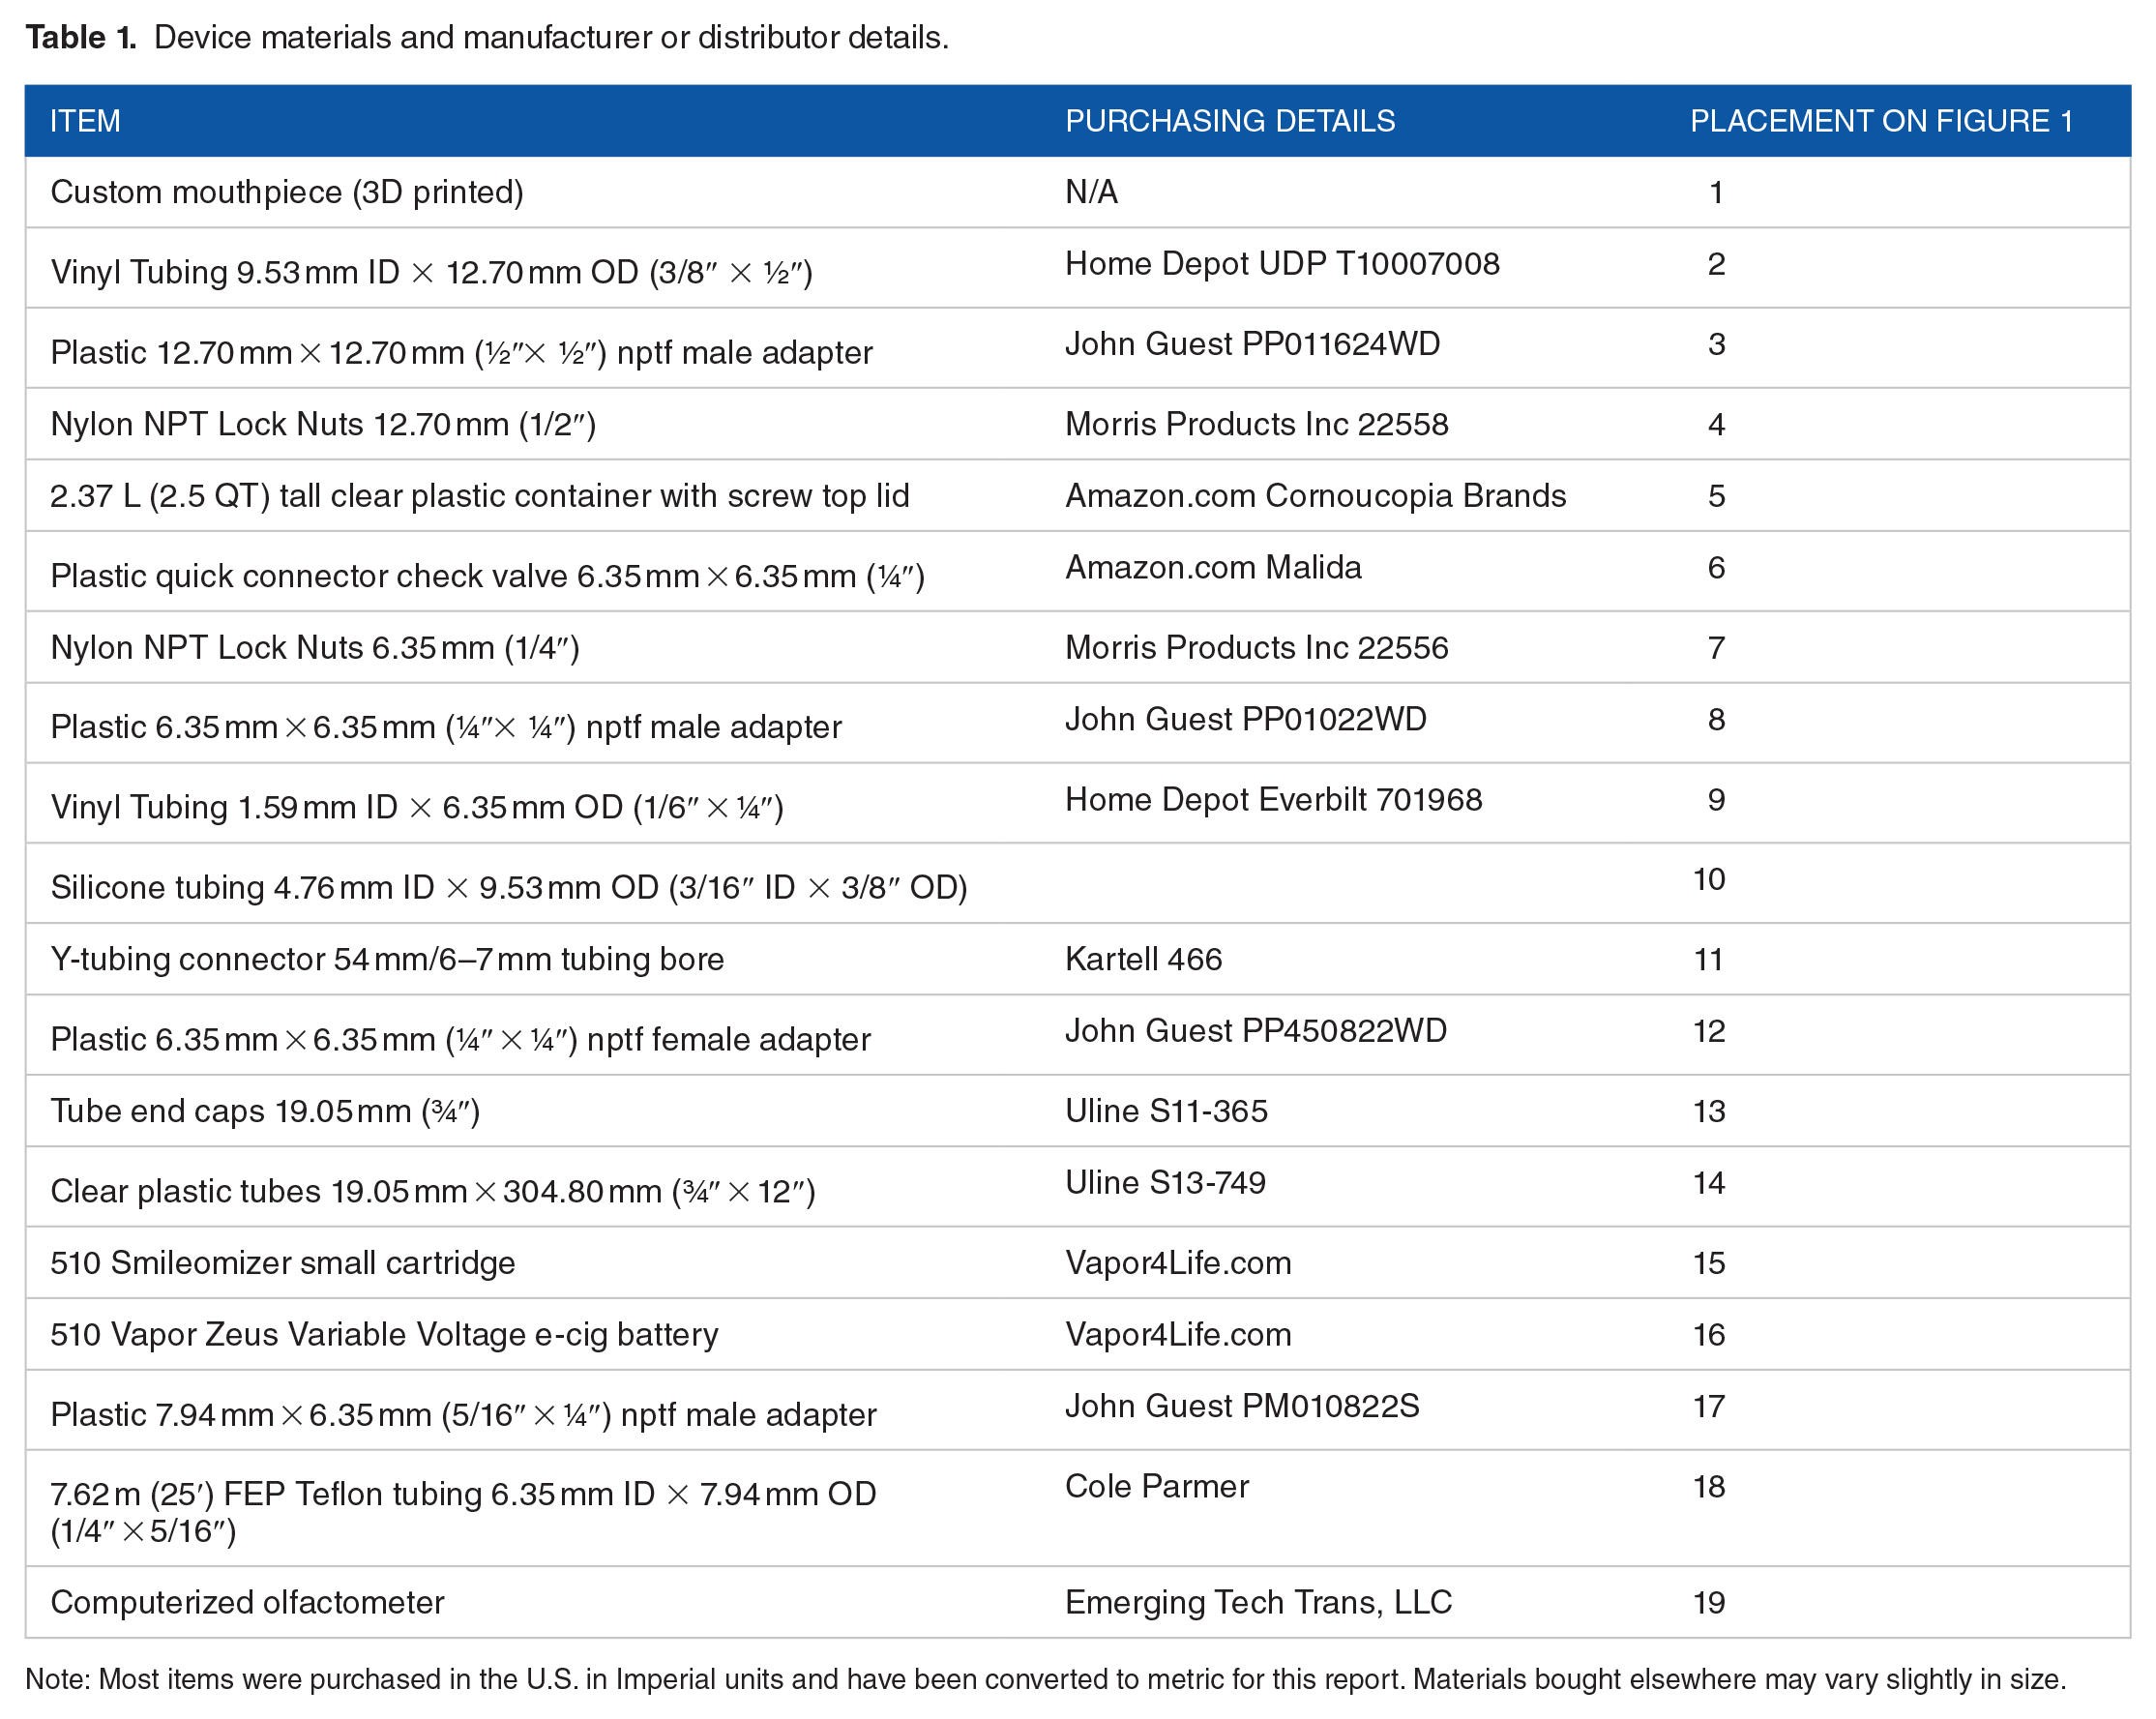
Note: Most items were purchased in the U.S. in Imperial units and have been converted to metric for this report. Materials bought elsewhere may vary slightly in size.
For use during MRI, the olfactometer is set up outside of the scanner room while the olfactometer FEP Teflon tubing is fed into the scanner room through a waveguide in the wall. The e-cig chambers are secured at the participant’s feet on the end of the scanner bed. The spacer is placed at the participant’s chest or side for inhalation. The tubing and mouthpiece can be secured to the front of the head coil or held by the participant if desired.
Electronic cigarette and e-liquids
A small 510 thread Vapor Zeus Variable Voltage e-cig DC battery was used inside each chamber. This e-cig battery is breath-actuated and ranges from 3.2 to 4.8 V. Any automatic breath-actuated electronic cigarette can be used in the device. We used the 510 Smileomizer small cartridges that hold 3-3.5 mL of e-liquid.
Liquids were mixed in-house from a stock solution of 100 mg/ml nicotine in propylene glycol (PG), propylene glycol (PG), vegetable glycerin (VG), and strawberry and vanilla PG-based flavorants. All liquids were purchased from NicVape.com. The final e-liquid mixtures used for testing contained 70% PG and 30% VG. This ratio was chosen to minimize the amount of vapor generated, which increases with VG content. The flavored liquids contained 10% vanilla and 5% strawberry flavorants. The liquids contained 36, 24, 16, 11, or 8 mg of nicotine.
Aerosol delivery parameters
Aerosol from all tested e-liquids was collected during eight 10-second delivery periods with the olfactometer flow meter set to 4 L/min resulting in individual delivery volumes of 333 ml. Each delivery was followed by a 30 seconds rest period. The battery was set to 3.2 volts. During testing, three chambers held batteries and the fourth chamber was left without a battery inside to serve as an air “flush” when needed. Fresh air was flushed at 4 L/min through the empty chamber during one-minute intervals in between aerosols during testing with human participants.
Air flow variability
Air flow was measured through each chamber and down the 1.22 m (4′) tubing eight times with the olfactometer flow set at 4 L/min. The same e-cig and e-liquid cartridge was used in each chamber for testing to avoid effects of e-cig variability.
Total nicotine capture
Total nicotine from aerosols of varying nicotine concentrations (0, 8, 11, 16, 24, & 36 mg) were trapped on Cambridge filter pads (CFP, Performance Systematix Inc., Grand Rapids, MI, USA) for nicotine determination in the aerosol delivered directly from the e-cigs and at the downstream end of the 1.22 m (4′) tubing. The 0 mg sample was collected last to assess any nicotine carryover effects from previous samples. No flavorants were added to the e-liquids for nicotine capture. Nicotine capture was completed at an early testing phase with 10 puffs per protocol and the e-cig batteries set at 3.7 V instead of 3.2 V. We decided to reduce to 3.2 V for the remainder of the testing to reduce the risk of burning the cartridge wicks during the 10 seconds aerosol deliveries, which are at the maximum time allowed by the battery before automatic shut-off.
Nicotine was extracted from the CFP by using 20 ml methanol and hepatadecane as an internal standard as outlined in ISO 10315:2013. Nicotine was analyzed by GC-FID using an HP 5890 gas chromatograph with separation on an Agilent CP Wax 52 CB column (30 m × 0.25 mm × 0.25 µm) using helium as the carrier gas with a flow rate of 1.2 mL/min. Temperatures for the injector and detector were heated at 10 degree/min and held at 240°C and 280°C respectively. The initial column temperature was held at 100°C for one minute and then heated to 240°C for 10 minutes before returning to initial conditions.
Free radical capture
We measured free radicals in the aerosols produced directly from the e-cigs and in the aerosol after it traveled down the 1.22 m (4′) tubing of the MEADS device. The methods to generate, capture, and quantify free radicals in e-cig aerosols has been described previously.20,21 In brief, an upstream flow meter (4 L/min) was connected to a relay switch on a 12 VDC solenoid valve (RioRand; Amazon.com) which was connected to the e-cig chamber downstream. An impinger for trapping radicals was connected to the 1.22 m (4′) of tubing from the e-cig chamber.
For capture, e-cig aerosols were passed through a 25 mL impinger containing 6 mL of 0.05 M phenyl-N-tert-butylnitrone (PBN) in hexane. After evaporating the hexane, the remaining residue was reconstituted in 500 µL of tert-benzene. Next, 200 µL of the reconstituted solution was filled into high purity quartz EPR tubes and deoxygenated using a freeze-pump-thaw technique with a Schlenk line.22,23 The samples were blanketed with gaseous argon after three freeze-pump-thaw argon cycles.
For quantification, the spectra derived from PBN radical adducts was measured using a Bruker eScan R spectrometer (Bruker-Biospin, Billerica, MA) operating in X-band and carried out at room temperature (22 ± 1°C). The following EPR parameters were used: microwave frequency of 9.7 GHz; modulation frequency of 86.0 kHz; microwave power of 2.89 mW; scan range was 60G; modulation amplitude of 1.15 G; sweep time of 20.48 seconds; time constant of 20.48 ms; and conversion time of 10.49 ms. Matlab was used for spin quantification of the radical signals. A double integral was produced by processing each spectrum automatically. Point-based-spline baseline correction was applied to the first integral (absorption data) before calculating the second integral. With known concentrations of a stable radical standard, TEMPO, we obtained conversion factors from double integral values to spin concentrations. 24
Plasma nicotine absorption
We recruited five adult smokers from the community to complete a laboratory visit during which each participant inhaled aerosol from e-liquid containing one nicotine concentration. Participants were screened for preliminary eligibility before being scheduled for an in-person visit where they provided informed consent and were assessed for eligibility again. Inclusion criteria included: smoking ⩾5 cigarettes per day, ⩾1 year of daily smoking, ability to read and write in English and understand study procedures. Participants were excluded if they were currently attempting to quit smoking, had a significant or uncontrolled medical condition (eg, COPD, kidney failure), allergic to PG or VG, or smell dysfunction based on the standardized Burghart Sniffin’ Sticks smell threshold test (MediSense, Winschoten, Netherlands). If eligible, participants completed the aerosol delivery protocol followed by a computerized survey and semi-structured interview administered by the research technician to gather feedback on their comfort and subjective experiences of using the MEADS device. During the interview they rated their perceptions of the nicotine they received (ie, level, pleasantness, satisfaction) on a scale from 0 (none/not at all) to 10 (a lot/extremely). All procedures were approved by the Penn State College of Medicine Institutional Review Board.
During the aerosol delivery protocol, participants were asked to breathe normally while they inhaled an aerosol containing a strawberry-vanilla flavor with nicotine (Block 1), nicotine without flavor (Block 2), and strawberry-vanilla flavor without nicotine (Block 3) during three separate blocks in a fixed order with fresh air flushes lasting 60 seconds between blocks. Separate chambers were used for each aerosol. Participants were equipped with a belt on their chest to track respiration rate and provided seven blood samples during the protocol. During each 10 seconds delivery, the spacer container filled with aerosol; therefore, participants were inhaling aerosol during the entire block as opposed to taking individuals “puffs”. Participants were asked to abstain from smoking 14 hours prior to the visit, which was confirmed by an exhaled breath carbon monoxide reading <12 ppm with a Bedfont microTM Smokerlyzer® (coVita, LLC, Santa Barbara, CA). One participant who was a heavy smoker was allowed to complete the visit with an exhaled CO reading of 14 ppm. Prior to beginning the aerosol delivery paradigm, a trained phlebotomist inserted an intraveneous catheter into the participant’s arm for blood collection. Blood samples of approximately 10 ml each were collected at baseline, directly after each block, and at three 5-minute intervals after the blocks were completed (seven total blood draws). The nicotine concentration of the e-liquid was 8, 11, 16, 24, or 36 mg. Each participant only received one designated nicotine concentration. This nicotine concentration was the same for the flavored and unflavored e-liquid. Participants, but not the researchers, were blind to their assigned nicotine concentration.
Serum was isolated from each blood sample by centrifugation and frozen at −80°C. Liquid chromatography mass spectrometry was used to determine serum levels of nicotine as described previously. 2 Nicotine was measured using a Phenomenex Synergi Polar RP column, 4.6 × 150 mm. The initial solvent composition of 90% solvent A/10% solvent B was held for 0.1 minute. Solvent A was 5 mM ammonium acetate with 0.1% acetic acid added. Solvent B was 5 mM ammonium acetate in methanol with 0.1% acetic acid added. A gradient was then run to 70% solvent B in 12 minutes. Nicotine eluted at approximately 5.3 minutes. The column was washed with 95% solvent B for 10 minutes before equilibrating at initial conditions. Nicotine was quantified using positive ion electrospray, monitoring the transition from m/e 163 to 130. The transition for the internal standard (d4 nicotine) was m/e 167 to 134. The temperature was 550°C and the ionspray voltage was 1800 V. The limit of quantitation was 200 pg/ml.
Magnetic resonance quality and safety
Several MRI scans were acquired to characterize the effect of the device on image quality. All data was acquired on a Siemens 3T Prisma system (Siemens Healthineers, Erlangen, Germany) from a healthy volunteer. A Siemens 64 channel head-neck coil was used for signal reception. Three sequences were acquired: 1) 2D dual-echo gradient echo sequence (GRE) with repetition time (TR) = 1000 ms, echo time (TE) = 4.2/7.5 ms, number of slices = 28, resolution = 2 × 2 × 4 mm3, for calculation of thermal signal-to-noise-ratio (SNR) and off-resonance field maps; 2) 2D B1+ mapping sequence 25 with TR = 16 s, TE = 2.2 ms, number of slices = 28, resolution = 2 × 2 × 4 mm3 for calculation of flip angle maps; and 3) 2D echo-planar imaging (EPI) sequence with TR = 1600 ms, TE = 30 ms, number of slices = 28, resolution = 3 × 3 × 4 mm3, parallel undersampling factor = 2, number of time-points = 160, for calculation of thermal SNR and temporal SNR (tSNR). All sequences were acquired with and without the MEADS device present for comparison. Subsequently, GRE & EPI thermal SNR maps were reconstructed with the SNR Units Method. 26 Off-resonance fields maps were calculated by taking the phase difference of the first and second echo images of the GRE sequence, followed by division by the difference in echo time. Flip angle maps were calculated by taking the inverse cosine of the ratio of the saturated and non-saturated images, following the methodology outlined in Chung et al. 25 EPI tSNR was calculated by taking the mean of the signal time-course at each voxel divided by the standard deviation. Prior to calculation of EPI tSNR, realignment was applied to each image series in SPM12.
Prior to data analysis, the whole brain was manually segmented from surrounding tissue with the ITK-SNAP 27 package. Segmentation was performed separately for each acquired sequence. Histograms over the segmented brain mask were produced for the five physical quantities measured: (1) static field off-resonance, (2) flip angle, (3) GRE SNR, (4) EPI SNR, and (5) EPI tSNR. The voxel count in each histogram bin was normalized by the total number of voxels in the respective brain mask.
Results
Air flow variability
Air flow rate from the olfactometer was 4 L/min. Average flow across all chambers was 2.77 L/min (SD = 0.13) and ranged from 2.5 to 3.0 L/min. Two chambers had consistent flow rates of 2.75 L/min for all tests. One chamber ranged from 2.5 to 2.75 and another ranged from 2.9 to 3.0. Thus, the highest range across tests in any one chamber was 0.25 L/min.
Total nicotine and free radical capture
There were strong correlations in a dose-response linear pattern between the nicotine concentration in the e-liquid and the nicotine amount captured from the aerosol when it was delivered directly from the e-cig (R2 = 0.988) and after the 1.22 m (4′) tubing (where the tubes typically connect into the spacer) (R2 = 0.965). Figure 2 displays the values of nicotine in the e-liquid and corresponding nicotine values determined by capture. Nicotine captured directly from the e-cig yielded the following nicotine concentrations per puff: 600 μg/puff (36 mg e-liquid); 410 μg/puff (24 mg), 290 μg/puff (16 mg), 240 μg/puff (11 mg); 180 /puff (8 mg). Nicotine captured after the tubing yielded the following nicotine concentrations per puff: 351 μg/puff (36 mg e-liquid); 202 μg/puff (24 mg), 187 μg/puff (16 mg), 129 μg/puff (11 mg); 62 μg/puff (8 mg). There were trace amounts of nicotine found on the filter for both collections using the 0mg/ml nicotine concentration e-liquid, suggesting nicotine carryover between the samples was minimal. The following was the percentage of nicotine yield reduction after traveling down the 1.22 m (4′) tubing: 42% (36 mg); 51% (24 mg), 36% (16 mg), 46% (11 mg); 66% (8 mg). This resulted in a mean 48% reduction in nicotine from the MEADS device compared to the e-cig directly.
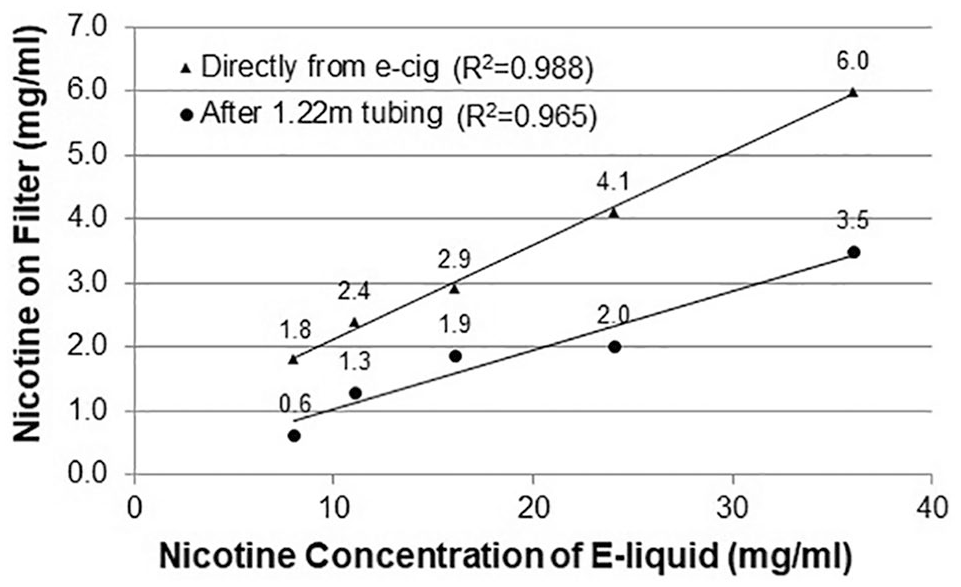
Quantified nicotine captured via Cambridge filter after being delivered directly from e-cig and down 1.22 m (4′) of tubing (y-axis) displayed by nicotine concentration in e-liquid (x-axis). Linear trendlines and correlations are displayed for each. Aerosol nicotine concentration (x-axis) was determined by the proportion of the 100 mg/ml nicotine stock solution mixed in the e-liquid.
The mean free radical output of the aerosol was 685.64 pmol (SD = 26.72) directly from the e-cig and 566.09 pmol (SD = 22.64) after the 1.22 m (4′) tubing. This resulted in 85.70 pmol/puff (SD = 3.34) directly from the e-cig and 70.8 pmol/puff (SD = 2.8) when produced by the MEADS device. This was a 17% reduction in free radicals from the MEADS device compared to the e-cig directly.
Plasma nicotine absorption
We measured plasma nicotine over seven blood draws for participants who received one of the following nicotine levels in their aerosols (8, 11, 16, 24, or 36 mg/ml). The sample was 60% female (n = 3), 100% white, 52 years old on average (SD = 4.53), with an average BMI of 31.29 (SD = 8.17). Participants smoked 21 cigarettes per day on average and had smoked a mean of 32.60 years (SD = 10.06). Four participants reported that they typically inhale their cigarettes moderately deeply and one reported typically inhaling very deeply. The total time from baseline to final blood draw lasted an average of 49 minutes and ranged from 44 to 60 minutes. The average time between blood draw 1 and 2 was 14.8 minutes (SD = 4.1); blood draw 2 and 3 was 9.2 minutes (SD = 1.8); blood draw 3 and 4 was 9.6 minutes (SD = 2.3); blood draw 4 and 5 was 5.4 minutes (SD = 0.5); blood draw 5 and 6 was 5.0 minutes (SD = 0.0); and blood draw 6 and 7 was 5.0 minutes (SD = 0.0). Participants took a mean of 124 (SD = 18.1) inhalations during the first and second aerosol delivery blocks that contained nicotine (range = 108 to 150).
Overall, plasma nicotine levels increased with increasing nicotine concentration in the aerosol. The 24 mg/ml concentration resulted in a higher peak plasma nicotine value (9.4 ng/ml) than the 36 mg/ml concentration (8.5 ng/ml). The 36 mg/ml concentration had the highest nicotine boost, calculated as baseline nicotine value subtracted from peak nicotine value. Of note, the participant who received the 24 mg/ml nicotine had a higher baseline nicotine value than the participant who received the 36 mg/ml nicotine (3.4 versus 1.9 ng/ml). Plasma nicotine levels for each blood draw are displayed in Figure 3 and nicotine boost is displayed in Figure 4. Plasma nicotine levels are displayed by the amount of nicotine captured in the aerosol during quantification for a more accurate representation of inhaled nicotine compared to the nicotine concentration in the e-liquid.

Plasma nicotine values (y-axis) for five human participants each delivered aerosol with a different nicotine concentration over seven blood draws lasting 49 minutes on average. Aerosol containing nicotine was delivered between the 1st and 3rd blood draws. The x-axis displays each nicotine concentration captured on the filter after 1.22 m of tubing.

Plasma nicotine boost (y-axis), calculated as baseline blood draw value subtracted from peak nicotine value over seven blood draws, for each nicotine concentration captured on the filter after 1.22 m of tubing (x-axis) delivered to five separate participants. The linear trendline and correlation is displayed in the figure.
Participants’ perceptions of the nicotine level in the aerosol, and their subjective ratings of the pleasantness and satisfaction from the perceived level of nicotine are displayed in Figure 5. The participant who received the 36 mg/ml e-liquid reported the highest ratings of satisfaction and pleasantness from the perceived nicotine level. Two participants reported that their throat burned from the e-liquids that contained nicotine. Overall, participants reported that the device was comfortable to use. Two participants reported discomfort from holding the tube and mouthpiece in their mouth and suggested that using something to secure the mouthpiece in place would have been preferable.

Participants’ subjective perceptions of the nicotine level in the aerosol and pleasantness and satisfaction from the perceived amount of nicotine. The scale ranged from 0 (none/not at all) to 10 (a lot/extremely). This information was collected during a semi-structured interview about the MEADS device after the blood collection protocol was complete.
Magnetic resonance quality and safety
EPI & GRE sequences were run with and without the MEADS device present to assess for effects on image quality. We observed a negligible effect on the mean, standard deviation, and histogram distribution of GRE Thermal SNR, EPI Thermal SNR, and off-resonance (ΔB0) with the device present. Small shifts in the mean of the flip angle distribution (–1.5 degrees) and EPI tSNR (+5.71 A.U.) occurred with the device present. A visual inspection of the raw images with the device present was unable to find any discernable effect on image quality. Figure 6 displays the histograms calculated from the image quality scans and Figure 7 displays representative slices for each sequence.

Histograms with and without the MEADS device are overlapped in the plot of each respective physical quantity. The vertical axis gives the normalized bin count in percentage. The floating bar denotes the mean (center mark) and ± 1 standard deviation (left and right marks) of each respective histogram.

Visual display of images acquired with GRE and EPI sequences run with and without the MEADS device present. All slices are displayed at corresponding z-coordinates for comparison and suggest negligible effects on the MRI signal.
Discussion
With the current project, we were able to design and build a working prototype that safely and effectively delivers e-cig aerosols during fMRI. We were able to establish that the device delivers nicotine effectively for human nicotine absorption. As expected, the nicotine concentration is being diluted by about half as it travels through the 1.22 m (4′) of tubing. Given the tendency of nicotine to adhere to surfaces, it is likely that a substantial amount of nicotine has been lost to the walls of the tubing prior to reaching the filter. There were trace amounts of nicotine captured from the aerosols produced from the 0 mg/ml e-liquid, suggesting low levels of contamination in the tubing. In the current feasibility study we used relatively low levels of nicotine to limit adverse nicotine effects for participants. E-liquids with higher nicotine concentrations can be used in the device to increase the level of nicotine exposure to human subjects. The most efficient way to improve nicotine delivery is to reduce the length of tubing between the e-cig chambers and spacer. Now that we have confirmed that the e-cigs do not pose a safety risk during MRI, the e-cig chambers could be placed closer to the participant’s head to reduce the length of the tubing. Using Teflon tubing instead of vinyl tubing would also help to prevent nicotine from adhering to the tube walls and could potentially increase nicotine output into the spacer. In addition, Teflon tubing may reduce the need to wash the tubing between every experiment, with the exception of the tubing that connects directly to the mouthpiece, which should be washed thoroughly after every use with human subjects. The drawback to Teflon tubing is that it is less flexible than vinyl tubing and will make the device less compact for travel. As expected, free radical production in aerosol from the device was similar to levels found among other e-cigs and decreased by almost 20% after traveling through the device. 20
With the current air flow, we were able to consistently deliver aerosols during a vaping protocol with intermittent 10 seconds delivery periods that allowed for cumulative aerosol capture in a spacer. The flow rate differed between chambers by 0.25 L/min. With a 10 second aerosol delivery period, this could result in a 0.04 L difference in the aerosol delivered to the participant for each period and a 0.33 L difference across eight delivery periods. This could result in higher nicotine intake or other differences in brain activation or health effects. Such variability is not ideal for highly controlled research and could be improved by using a design with air tight seals. We found it useful to have clear plastic e-cig chambers where we could see the e-cig LED to confirm that it was activating for the full 10 seconds. Custom-built e-cig chambers made from clear durable plastic with end caps that thread on to create air tight seals would be ideal to reduce air loss and variability. Built-in tubing connectors on each end would also reduce air leakage as opposed to attaching separate push-to-connect fittings as we did in the current design. The e-cig chambers themselves do not contact any e-cig aerosol since it is pushed directly into the tubing. Therefore, unlike the tubing, the chamber material does not need to be resistant to odor or nicotine adhesion. Another potential source of variability in air flow is variability in the amount of air that can travel through the e-cigs themselves. We did notice a sharp increase in flow pressure in some of the e-cigs as the battery reached it’s time limit (10 seconds). This may be an area for future investigation for those wishing to conduct highly controlled aerosol delivery studies with the MEADS. The e-cig device used inside each chamber may come with its own variables and challenges for controlled research.
The device was found to be safe for use during MRI and did not impact scan image quality. While there are lithium batteries and small ferromagnetic parts inside the e-cigs, the remainder of the device is designed from plastic that does not attract to the bore or heat up during scanning. As a safety precaution, we secured the device to the bottom of the scanner bed near the participant’s feet using the inline strap that comes standard on most scanner beds. With the device so far from the participant’s head, we did not expect to observe any signal interference, which was confirmed by our testing. The difference between the two tSNR maps was low and mostly due to interscan variability, and not the device itself.
Limitations, such as air flow variability, in the current design can likely be addressed through modifications in materials or potentially using different e-cigs in the chambers. It is important to note that participants were not asked to “puff” on the aerosols like they would when using an e-cig in a real world setting. Instead, participants were asked to breathe naturally throughout the delivery protocol. This was done for our initial tests to avoid wide variation in the depth of inhalations across participants. Future tests should assess nicotine absorption during “puffing” as well, which will likely result in higher levels of nicotine absorption and may not require the use of e-liquids at higher nicotine concentrations.
In summary, we developed and tested a prototype of an aerosol delivery device to be used during fMRI. The design as described is sufficient to deliver aerosols during scanning in quantities that can mimic the real world experience of e-cig inhalation. Human participants were able to tolerate the aerosol and absorbed nicotine into the bloodstream. The device has the potential to be used to assess BOLD activation during e-cig use and to compare brain reactivity to varying flavors and nicotine concentrations. Using materials that reduce airflow would allow the device to be improved for more controlled research contrasting fine gradients of flavor, nicotine, or other aerosol constituents.
Footnotes
Funding:
The author(s) disclosed receipt of the following financial support for the research, authorship, and/or publication of this article: This project was supported by the Penn State CTSI Grant (UL-TR000127 & UL1-TR002014) from the National Center for Advancing Translational Sciences, National Institutes of Health and the Penn State University Highmark Gift Fund. ALH is supported by a National Institute on Drug Abuse career development award (K23-DA045081). This project was facilitated by the Penn State College of Medicine MRI Core Facility and is funded in part under a grant with the Pennsylvania Department of Health using Tobacco CURE Funds. The Department of Health specifically disclaims responsibility for any analysis, interpretations or conclusions. The content is solely the responsibility of the authors and does not necessarily represent the official views of the NIH.
Declaration of conflicting interest:
The authors declare that there is no conflict of interest.
Authors Contribution
All authors made substantial contributions to the conception and design, data collection or analysis, and interpretation of data. ALH, ZB, RG, CTS, and NT drafted the manuscript. All authors were involved in critical revisions for intellectual content. All authors approved of the final version for publication.