
Abstract
The DyGAF model, which stands for Dynamic Gene Attention Focus, is specifically designed and tailored to address the challenges in biomarker detection, progression reporting of pathogen infection, and disease diagnostics. The DyGAF model introduced a novel dual-model attention-based mechanism within neural networks, combined with machine learning algorithms to enhance the process of biomarker identification. The model transcended traditional diagnostic approaches by meticulously analyzing gene expression data. DyGAF not only identified but also ranked genes based on their significance, revealing a comprehensive list of the top genes essential for disease detection and prognosis. In addition, KEGG pathways, Wiki Pathways, and Gene Ontology–based analyses provided a multileveled evaluation of the genes’ roles. In our analyses, we tailored COVID-19 gene expression profile from nasopharyngeal swabs that offer a more nuanced view of the intricate interplay between the host and the virus. The genes ranked by the DyGAF model were compared against those selected by differential expression analysis and random forest feature selection methods for further validation of our model. DyGAF demonstrated its prowess in identifying important biomarkers that could enrich gene ontologies and pathways crucial for elucidating the pathogenesis of COVID-19. Furthermore, DyGAF was also employed for diagnosing COVID-19 patients by classifying gene-expression profiles with an accuracy of 94.23%. Benchmarking against other conventional models revealed DyGAF’s superior performance, highlighting its effectiveness in identifying and categorizing COVID-19 cases. In summary, DyGAF model represents a significant advancement in genomic research, providing a more comprehensive and precise tool for identifying key genetic markers and unraveling the complex biological insights of a disease. The DyGAF model is available as a software package at the following link: https://github.com/hiddenntreasure/DyGAF.
Keywords
Introduction
It is essential to prioritize the earliest and most accurate understanding of how disease pathogens develop and affect human cells at the genetic level. This involves studying how these pathogens, particularly respiratory viruses, infiltrate and replicate within host cells, using cellular mechanisms to proliferate and spread throughout the body. For example, the recent COVID-19 pandemic has highlighted how such viruses can alter gene expression patterns, disrupt normal cellular functions, and trigger diverse immune responses. The severity of the disease, ranging from mild to severe, is largely determined by the body’s immune reaction to the infection. Epithelial cells lining the airways serve as the primary entry points for respiratory viruses, enabling their replication and systemic dissemination. 1 Understanding the genetic basis of these interactions is indispensable for developing effective treatments and vaccines, as it provides insights into the mechanisms of viral entry, replication, and host-pathogen interactions. 2
SARS-CoV-2 virus, responsible for COVID-19, induces a series of genetic and cellular pathway alterations on infecting the human body, profoundly influencing the disease’s trajectory and severity. Research has illuminated significant changes in gene expression related to cytokine production and the antiviral innate immune response. Specifically, a cytokine storm involves the excessive production of immune proteins due to altered gene expression, 3 leading to severe inflammation and tissue damage in serious COVID-19 cases. Studies also identified critical pathways such as the JAK-STAT and NF-κB signaling pathways, which regulate immune responses and cytokine production. 4 In addition, the antiviral innate immune response, the body’s initial defense against viral infections, is compromised as SARS-CoV-2 interferes with interferon signaling pathways critical for activating antiviral genes. Disruption of these pathways delays the initial immune response, allowing the virus to replicate more freely within the host. 5
ACE2, TMPRSS2, IL-6, IFI6, and MX1 are identified as biomarker genes associated with COVID-19. Their impact on the disease cannot be attributed solely to single-gene mechanisms due to their involvement in complex molecular and genetic interactions. Numerous studies have used gene signature models to distinguish COVID-19 from healthy individuals or other viral diseases.6 -9 These genes, along with others identified through genomic studies, highlight the complex interactions between the virus and the human host. Furthermore, the severity and spread of COVID-19 are influenced by environmental factors such as air quality, temperature, and population density.10,11 This situation necessitates a comprehensive approach to understanding the biological characteristics of the virus, from its entry into the body and initiation of immune responses to the ensuing inflammation and health impacts.
In the field of bioinformatics, the integration of statistical methods has long been a conventional approach for analyzing complex biological data. Techniques such as differential expression analysis (DEA), 12 regression analysis, 13 principal component analysis, 14 and cluster analysis 15 are used to uncover patterns and correlations within large genomic datasets. Similarly, the significance of machine learning in genomic studies, particularly in the context of COVID-19, lies in its ability to automate feature selection, accurately classify disease outcomes, and predict disease severity based on genetic markers. For example, Arslan 16 applied machine learning to accurately identify COVID-19 infection and distinguish them from other coronaviruses, thereby improving diagnostics. Another study analyzed microarray data using the binary reptile search algorithm (BRSA) and found 6 COVID-19-related genes with a support vector machine (SVM) classifier with 87.22% accuracy. 17 In 2020, Peterson et al 9 used gene expression data to predict COVID-19 illness severity, developing an 18-gene signature that achieved an area under the curve (AUC) of 85%, indicating good performance in differentiating severe from mild/moderate conditions. In addition, an in silico study analyzed SARS-CoV-2 gene expression profiles to classify different stages of infections by implementing feature selection. 18 Overall, by leveraging machine learning, researchers can transcend traditional analysis limitations, enabling the identification of biomarker genes and enhancing our understanding of COVID-19 and other complex diseases. Traditional methods, such as DEA, emphasize the significance of individual genes but often neglect the interactions within larger gene networks. In contrast, machine learning approaches tend to focus on these interdependent gene relationships. However, a significant gap remains in effectively addressing both aspects simultaneously.
Researchers classified COVID-19 patients either by using well-known biomarkers such as ACE2, TMPRSS2,8,19 IL-6, IFI6, 6 HERC6, IGF1R, 20 and MX1 8 in a model known as 2/3-gene signature model or by analyzing the complete gene expression profiles of COVID-19 patients.21,22 We hypothesize a new method that focuses on both aspects—investigating the molecular changes in a gene in response to infection while also considering the complex roles of these genes within gene networks and molecular interactions. In this study, we developed a method called Dynamic Gene Attention Focus (DyGAF) to address this gap. After evaluating our method with a comprehensive dataset, we demonstrated the high efficacy of DyGAF. It identified novel gene ontologies (GOs), pathways, and key genes compared with traditional methods such as DEA and random forest (RF). DyGAF’s innovative approach offers a robust tool for understanding the genetic basis of infectious diseases, providing valuable insights for future research and therapeutic development.
Materials and methods
Data collection
For our study, we collected gene expression profiling data from the Gene Expression Omnibus (GEO) database, hosted by the National Center for Biotechnology Information (NCBI), specifically under the accession number GSE188678. 7 The workflow outlining the overall procedure, including sample collection, RT-PCR amplification, RNA sequencing, and the reporting of biological pathway activation due to COVID-19 infection, is shown in Figure 1. To assess the DyGAF, we meticulously selected and curated the COVID-19 RNA-seq data sets to ensure their accuracy and relevance across diverse disease instances. The dataset, collected from nasopharyngeal swabs, included samples from individuals with COVID-19 and non-viral conditions. It was then filtered with several criteria: it had to be human-based, non-repetitive, include both control (healthy) and case (condition/disease) samples, and have a sufficient number of samples for robust analysis. The dataset used in this study comprises 169 control samples and 90 COVID-19 samples, covering approximately 19 939 genes. This comprehensive selection process allowed for a thorough and reliable analysis, enhancing the study’s robustness and validity.

The diagrammatic workflow for data collection (Created with BioRender.com). The diagram illustrates how COVID-19 samples are collected, tested for infection, and processed for RNA sequencing. It also illustrates the subsequent steps involved in aligning the RNA sequences to obtain gene-level count data and identifying the pathways activated in the body of a COVID-19 host.
Data preprocessing
The initial phase involved data preprocessing using advanced bioinformatics and statistical techniques. Transcript abundance was quantified using Kallisto, 23 which processed raw RNA sequence alignment data into the form of read counts, with each count representing the number of sequences mapped to a specific gene. This was followed by the import and summarization of transcript-level estimates into gene-level data using tximport. 24 Finally, the Trimmed Mean of M-values (TMM) method, 25 integrated into edgeR, 26 was applied to normalize gene expression levels across samples before applying them to DyGAF. The variations in library size and composition effects across the RNA-seq datasets were adjusted to ensure that gene expression levels were comparable across different samples.
Differentially expressed genes (DEGs) were identified using edgeR with the raw counts used as the direct input. To control the false discovery rate (FDR) in the DEA, we implemented the Benjamini-Hochberg FDR procedure. Overall, this process adjusted P-values to account for multiple testing, thereby reducing the number of false-positive genes and ensuring statistical significance at an adjusted P-value (adj-P-value) threshold of ⩽.05.
Attention-based feature selection mechanism
We embraced attention mechanisms as a fundamental principle to dynamically prioritize the most relevant features within the expansive genetic landscape, facilitating precise identification of genes critical to disease outcomes.27,28 Certain genes operate autonomously, exerting direct influence on disease outcomes through their interactions with cellular components. For instance, genes involved in viral entry, replication, or regulation of the immune response can independently affect host responses to infections like COVID-19.29 -32 Conversely, some genes may function more dependently, with their activities influenced by other genes, environmental factors, or cellular signaling pathways. In the context of COVID-19, dependent gene’s action may involve immune-related genes or cytokine signaling pathways, where disturbances in one gene’s expression can cascade through the network, affecting disease outcomes. 28
To capture both independent and dependent gene behaviors, we proposed a combined method, DyGAF, including 2 separate models. DyGAF was initially inspired by the attention models proposed by Bahdanau 27 and Shaw et al, 33 but was tailored to biological feature selection rather than sequence modeling. Unlike traditional attention mechanisms that rely solely on additive scoring or scaled dot-product attention, DyGAF employed element-wise multiplication (Model A) for independent feature weighting and dot-product transformations (Model B) to capture interdependencies, ensuring alignment with gene regulatory mechanisms.
Model A (independent gene functions analysis)
Model A focuses on the independent roles of genes, evaluating each gene’s individual effect on disease dynamics without considering its interactions with other genes or environmental factors. It uses a custom attention layer, developed with TensorFlow and Keras, to effectively learn and assign weights, thereby calculating attention scores for each gene as illustrated in Figure 2A.32,34 Model A’s attention mechanism ignored the interdependencies among input data elements. It began with an input matrix X, where each element was denoted as xij, indicating its position within the matrix. The model proceeded to calculate the attention scores (α) through the application of a hyperbolic tangent function (tanh), which acted on the element-wise product of the input matrix and a weight matrix W (denoted as wij for each element), with an added bias b:

Following this, the model computed the attention weights (β) by again applying the tanh function to α:

These attention weights were then applied to the input matrix X through another round of element-wise multiplication to generate a weighted output matrix:

To ensure operational uniformity and output consistency across inputs and batches, we introduced a zero-filled matrix P, with a predefined size. The matrix addition is followed by a division operation that normalizes the weighted output. Let

To ensure stable feature scaling, we applied power-of-two normalization, empirically testing divisors
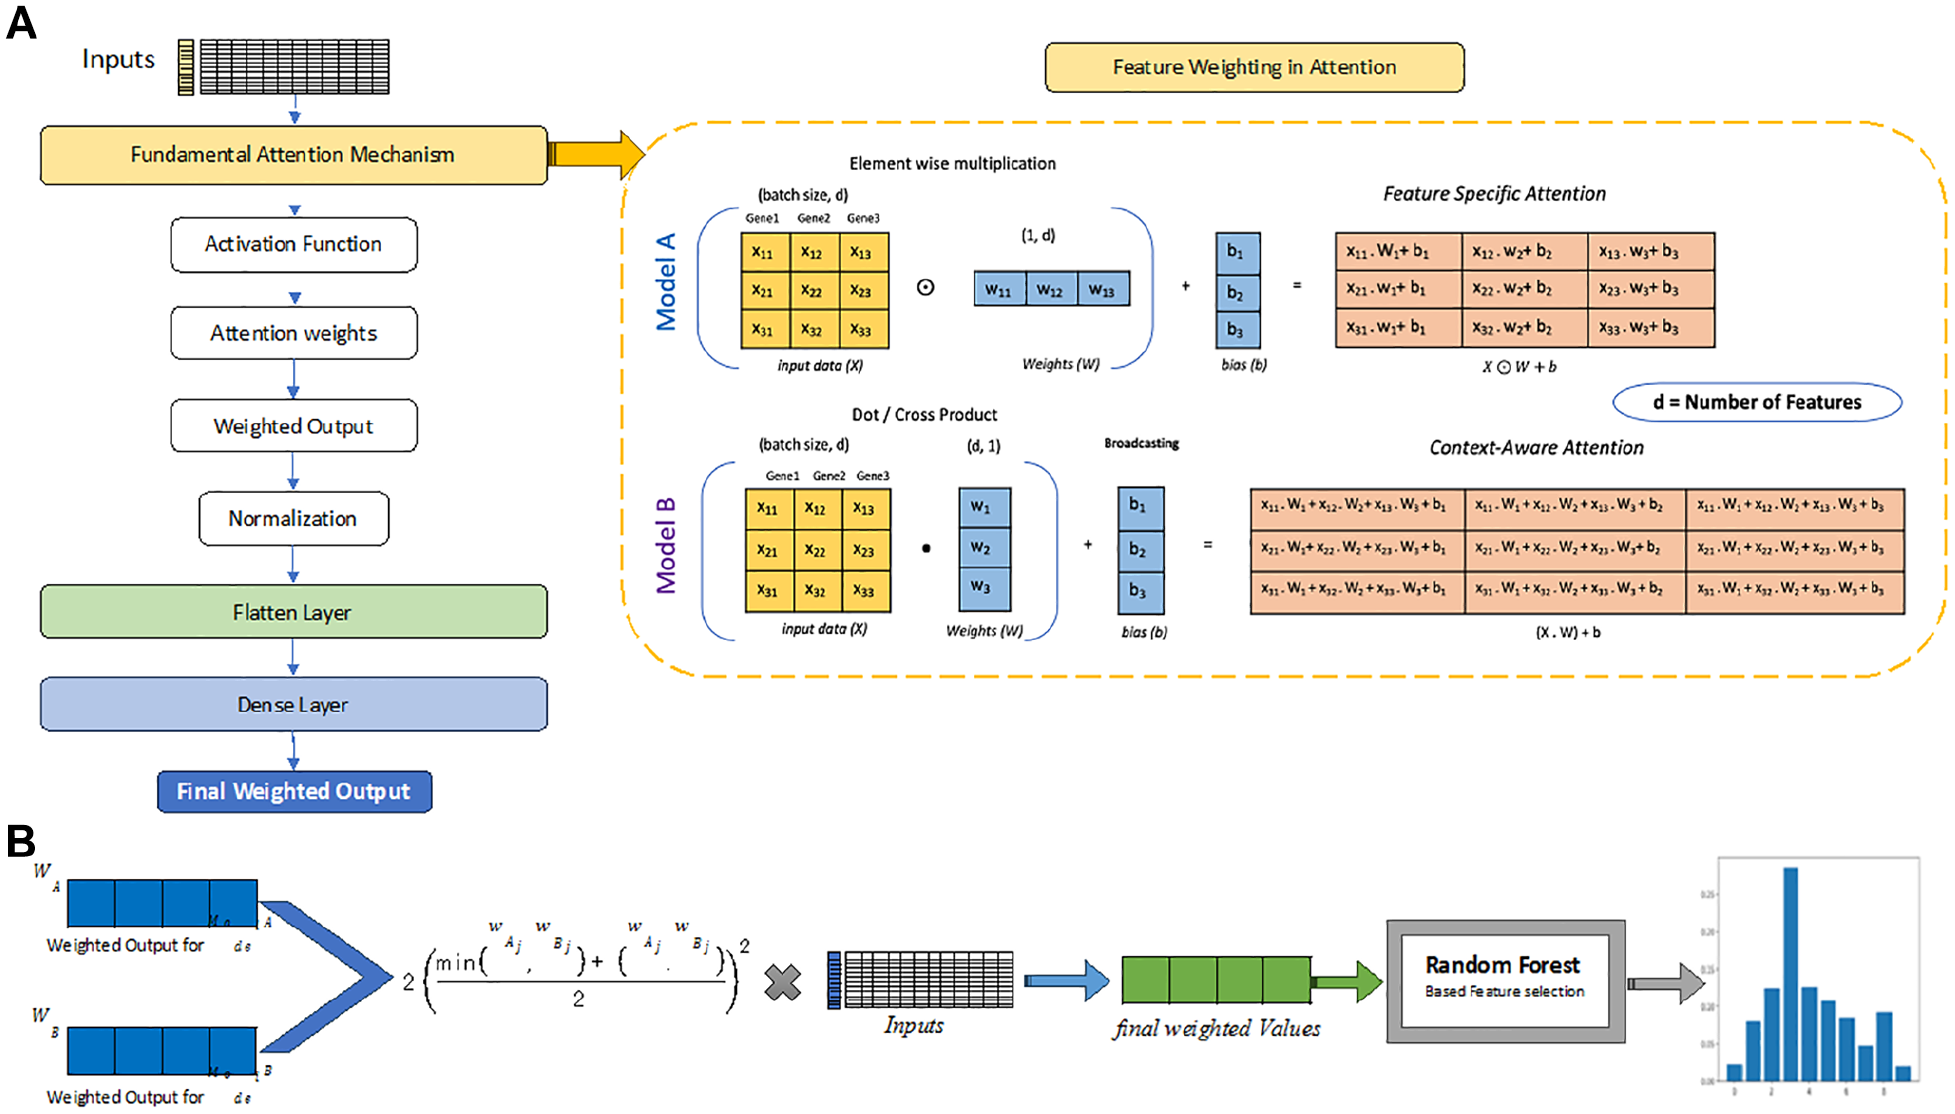
Fundamental attention mechanisms in neural network architecture. (A) Illustration of 2 methods for calculating attention weights in Models A and B. This panel highlights the steps that define the models’ specific independent or dependent natures, using element-wise multiplication and dot products, respectively, each followed by bias addition to compute the final attention scores. (B) This panel illustrates how attention weights are combined to calculate feature importance, emphasizing their computational steps and influence on input relevance.
Through all this steps, Model A carefully assessed the importance of each feature in the dataset, enabling a detailed, feature-focused analysis of biological data. This approach prioritizes examining individual feature contributions over analyzing how features interact with each other.
Model B (dependent gene functions analysis)
To find out how genes interact within complex regulatory networks and affect each other’s expression, Model B used gene expression data to infer gene interdependencies through attention mechanism. It examined genes expression with the objective of capturing the intricate interplay between genes and identifying key features (genes) that collectively contribute to the progression of diseases. 36 The dependent model adopted a more complex attention mechanism that acknowledged the relational dynamics among input data elements as shown in Figure 2A. This model began with the input matrix X and computed initial attention scores (α′) using a sigmoid function (σ) applied to a hyperbolic tangent activated linear transformation of X. This transformation was performed through a dot product between X and a weight matrix W, with an added bias b:

Here, the bias term b is broadcasted and added to the result of the dot product, ensuring each element of the resulting matrix is adjusted by the corresponding bias value, which enhances the model’s flexibility and learning capacity. 37 Subsequently, the model computed a weighted output by multiplying the mean-reduced attention scores across a specified axis (in this case, axis = 0, which refers to the features dimension in the data matrix) with the input matrix X, through an element-wise multiplication:

Following this, the model recalculated attention scores (α′′) using a sparsemax activation function applied to a dot product of the previously obtained weighted output

A zero-filled matrix P′, dynamically sized according to the last dimension of X, was used to ensure dimensionality alignment during matrix addition, followed by normalization. Let

Model B aims to capture the nuanced dynamics of gene regulatory networks, offering insights into genes’ interconnected roles in disease contexts. The architecture enhanced interpretability by returning attention weights, facilitating a focused analysis of critical genetic factors in disease susceptibility and progression.
Model training, experimentation, and evaluation
In the process of model training, experimentation, and evaluation, parameters and hyperparameters were tuned for both Model A and B. Our dataset, representative of the problem domain, underwent a validation split of 20%. This step serves as a crucial step for monitoring the model’s performance on unseen data, thereby mitigating the risk of overfitting. Hyperparameter tuning, a vital phase of model training, was conducted with varying batch sizes (8, 16, 32, 64) over 100 epochs. However, it was observed that a batch size of 16 yielded state-of-the-art results. This iterative process is pivotal in identifying the optimal configuration that balances training efficiency and model performance. We implemented the Adam optimizer through TensorFlow and Keras, known for managing large datasets and high-dimensional spaces by dynamically adjusting learning rates. In addition, when coupled with the binary cross-entropy loss function, this setup provided a robust framework for training the attention mechanism model.
We also implemented multi-head attention models, leveraging the core principles of attention mechanisms, inspired by the seminal work of Ashish Vaswani et al. 28 Each model processes input independently across 2, 4, 6, or 8 heads, with outputs either concatenated or used directly, then flattened and passed through a sigmoid-activated dense layer. Our experiments showed that the model with 4 heads most effectively balances performance and interpretability, with each head containing 239, 269 trainable parameters. The outputs from all attention heads were concatenated, forming a comprehensive representation that underpins the model’s decision-making process. To validate the robustness of our findings, we also implemented k-fold cross-validation, with k equal to 5. By rotating through each subset as the testing set, we obtained multiple evaluations of the model’s performance across different data segments. This technique provided a more accurate estimation of model performance across data segments and reduced data partitioning bias.
We compared our model’s results to DEA analysis and the RF-based feature selection method. This comparison shed light on our model’s effectiveness in capturing genetic factors relevant to the disease. By integrating machine learning interpretability and deep learning sophistication, our model surpassed the scope of DEGs analysis, offering refined biomarker identification.
Combination of attention-based weighted values and RF-based feature selection in the DyGAF method
The amalgamation of attention weights from the independent (Model A) and dependent (Model B) frameworks constituted the foundation of our investigative process (Figure 2B). Acknowledging the intricate nature of biological pathways at play, our methodology employed custom scoring functions to refine the synthesis of attention weights, thereby guaranteeing a thorough appraisal of gene relevance. 38 In bioinformatics and functional genomics, where determining gene significance is crucial, the dual-model system offers a robust framework for integrating and evaluating gene importance. Specifically, given a data matrix X with i instances (samples) and j features (genes), along with 2 vectors of normalized weighted value WA and WB corresponding to each gene’s weighted values derived from Model A and B, respectively.
Formally, for each gene j, the combined score or weighted value

Here, by taking the minimum of
Finally, we calculated the weighted values by multiplying the weights with the gene expression. On top of the final weighted value, we used a feature selection technique based on RF. 39 Overall, the technique of using random forest on the analyzed integrated weighted values for gene selection is named DyGAF. The RF algorithm was highly regarded for effectively identifying key features crucial for distinguishing between 2 classes. We also evaluated established combination metrics, including Geometric Mean, Borda Count, and Harmonic Mean, using RF for classification effectiveness and Mutual Information (MI) for information retention. As demonstrated in Table S1 in the Supplemental File 1, our custom metric outperforms traditional methods in both accuracy and information preservation. This methodological approach improved the reliability of our feature selection, ensuring accurate identification of key genes associated with COVID-19.
COVID-19 classifier
DyGAF is also used to classify COVID-19 patients from healthy individuals by analyzing gene expression profile. To assess the classification efficacy of DyGAF, we employed RF, support vector machines (SVM), and K-nearest neighbors (KNN) on raw data to differentiate COVID-19 samples from healthy ones. Total 5 models compared in our analysis: DyGAF, RF, DyGAF-SVM, DyGAF-KNN, and DEA-RF. The models were specifically applied to features (eg, genes) identified by the DyGAF method. In contrast, the RF model was applied to all genes, and the DEA-RF model used RF to classify samples based on genes deemed significant by DEA. During this classification, sensitivity was prioritized to ensure that no COVID-19-positive samples were misclassified as healthy.
GO and pathways analysis
We made use of GO, KEGG, and WikiPathways, which are among the most helpful resources available for annotating gene functions, investigating biological pathways, and comprehending the intricate connections that exist between genes and molecules. An enrichment analysis web tool, Enrichr (https://maayanlab.cloud/Enrichr/), was used to carry out the functional analysis (GO, KEGG, and Wiki) of the most significant genes list.
40
A functional annotation would be statistically significant if the adjusted P-value
Protein-protein interaction and hub proteins
To unravel the underlying protein interaction networks encoded by the COVID-19 dataset, we used the STRING database ( http://string-db.org ) (version 12.0), a comprehensive resource that amalgamates known and predicted protein-protein interactions. 41 The top 100 significant genes used to construct the protein-protein interaction (PPI) network via STRING. We employed Cytoscape ( https://cytoscape.org/ ) to visualize the complex landscape of protein interactions. 42 To pinpoint the hub genes within the network, we also employed the CytoHubba plugin, a renowned tool for identifying key nodes in biological networks based on their topological features. 43 The top 10 hub genes formed a high-centrality subnetwork, suggesting their roles are likely crucial to COVID-19’s pathogenesis due to their PPI network activities. Four different methods availed in CytoHubba, such as Maximum Neighborhood Component (MC), Degree, Betweenness, and Closeness, were used to rank the important genes in our analysis.
TF-gene regulatory network
In the context of our study, we identified a set of significant genes whose expression is overseen by transcription factors (TFs). To determine the regulation between TFs and target genes, we used NetworkAnalyst (version 3.0), a web tool for biological analysis. 44 Specifically, we analyzed the top 100 significant genes identified by the attention-based model to elucidate the regulatory networks. We selected the JASPAR 45 and ChEA 46 databases, which are widely accepted resources for TF-gene interactions. Finally, Cytoscape ( https://cytoscape.org/ ) is used to visualize the network.
Results
We have developed a method called DyGAF, a comprehensive framework that offers a nuanced understanding of genomic expression patterns linked to a condition. The process began with the acquisition of expression profiling data, rigorous preprocessing steps including TMM normalization, data cleaning, and transformation; subsequently, the pipeline proceeds to model building to identify and rank biomarker genes associated with COVID-19, providing valuable insights into the molecular signatures of the disease (as shown in Figure 3). In the final stage of the pipeline, a comprehensive molecular analysis of COVID-19 was conducted using bioinformatics tools and databases such as KEGG and WikiPathways for pathway mapping, GOs for functional annotation, protein-protein interaction networks, hub-protein, and TF-gene interactions identification. By leveraging these diverse analytical approaches, a holistic understanding of COVID-19 at the molecular level was achieved, facilitating the identification of key biological mechanisms and potential therapeutic targets.

Overview of data processing and analysis for COVID-19 gene expression profiling (Created with BioRender.com). (A) Gene expression profiling was carried out on the nasopharyngeal swab data and collected from the Gene Expression Omnibus (GEO) database. (B) Structured data was created on performing Trimmed Mean of M-values (TMM) normalizing, data cleaning, and data transformation. (C) A dual attention-based model was built and trained along with random forest algorithm as a classifier for feature selection. (D) Top features were analyzed using the Kyoto Encyclopedia of Genes and Genomes (KEGG) and WIKI Pathway, Gene Ontology (GO) enrichment analysis, protein-protein interaction (PPI) network analysis, hub-protein, and TF-gene interaction.
Data preprocessing
The boxplots in Figure 4 illustrated the distribution of gene expression across samples before (Figure 4A) and after (Figure 4B) TMM normalization. Each boxplot represented the log2-transformed expression values of genes across various samples. On closer inspection of Figure 4B, it is evident that following TMM normalization, the medians of all the samples are centered within a narrower range of 3 to 6. The scaling adjusted the data’s shape during normalization, improving consistency across samples by reducing the effects of library size and composition. This enhances the reliability of downstream analyses, ensuring that biological insights from RNA-seq data reflect true biological differences rather than technical variabilities.

Comparison of Trimmed Mean of M-values (TMM) normalization: gene expression before and after TMM normalization using log2-transformed of the expression profile. (A) The data before TMM normalization and (B) the data after the TMM normalization.
Gene ranking using attention-based mechanism
The attention-based feature selection technique, DyGAF, was used to rank the genes according to their feature importance. This approach identified 923 genes with feature importance values greater than zero (Supplemental Table 1). By leveraging DyGAF, the model enhanced its capacity to pinpoint critical genetic biomarkers linked to COVID-19, thereby facilitating the discovery of valuable insights into the disease’s underlying biological mechanisms. Specifically, DyGAF highlights genes’ persistent importance and how they affect disease progression. In our analysis, we focused on the top 100 genes to achieve a balance between comprehensiveness and manageability in downstream validation and possible clinical applications. The threshold is flexible, so future studies may include more or less genes based on research or therapeutic goals.
Comparative assessment of the conventional methods (DEA and RF)
In our investigation, we employed the traditional DEA approach to identify potential biomarkers (genes) associated with COVID-19. In addition, we used RF, a prominent feature selection method in machine learning, to perform biomarker identification. Results from both approaches were compared with our new method to showcase the robustness of our model.
Using edgeR, a total of 1702 DEGs for COVID-19 patients were identified from the GSE188678 dataset. These DEGs were filtered based on an adjusted P-value threshold of ⩽.05, and for a comparative downstream study, the top 100 DEGs were selected using a stricter criterion of an adjusted P-value ⩽.005 (Supplemental Table 2). Furthermore, employing the conventional RF-based feature selection approach initially yielded 918 relevant genes in the dataset (see Supplemental Table 3). To visualize the overlap and uniqueness of genes identified by all 3 models, we constructed a Venn diagram depicted in Figure 6A.
COVID-19 classifier performance comparison
In our study, the DyGAF model demonstrated superior performance in classifying COVID-19 samples from nasopharyngeal swabs based on gene expression profiles. It achieved the highest testing accuracy and F1-score as compared to the control models, including DEA-RF, RF, DyGAF-SVM, and DyGAF-KNN (Table 1). Particularly noteworthy was DyGAF’s perfect sensitivity rate, as shown in Figure 5A, indicating its exceptional ability to identify all true positive COVID-19 cases without any false negatives. These findings highlight the potential of DyGAF as a robust tool for diagnostic applications in the context of gene expression analysis. More information about classification can be found in the Additional Results of Supplemental File 1.
Classification report comparing dynamic gene attention focus (DyGAF), random forest (RF), differential expression analysis (DEA-RF), support vector machines (DyGAF-SVM), and K-nearest neighbors (DyGAF-KNN) models based on the gene expression profiles from human nasopharyngeal swabs.

Bold values are the results yielded from the DyGAF method.

Confusion matrices for the classification of COVID-19 infection in humans based on ranked gene expression profiles, comparing the performance of 4 computational models: (A) dynamic gene attention focus (DyGAF), (B) random forest, (C) support vector machines (DyGAF-SVM), and (D) K-nearest neighbors (DyGAF-KNN).
GO and pathway (KEGG and Wiki) analysis
Furthermore, GO and pathway analyses were conducted on the top 100 genes identified by all 3 methods to validate and select the optimal model. Comparisons were made based on enriched biological processes (BP) yielded from GO analysis, and pathways identified from KEGG pathways, and WikiPathway mapping. Our novel approach successfully identified the highest number of GOs, elucidating the biological processes strongly linked to the progression and severity of COVID-19 in host cells (Figure 6B). Figure 6C to E illustrates the top 20 statistically significant COVID-19-related GO terms identified by DyGAF, DEA, and RF models, respectively. Overall, DyGAF also showed a higher number of overlapping gene sets associated with specific GO terms or pathways compared with DEA and/or RF. Table 2 presents the significant COVID-19-related KEGG pathways with adjusted P-values ⩽.05. Notably, DyGAF identified key pathways such as Coronavirus disease and Cytokine-cytokine receptor interaction with the highest overlapped genes, highlighting its robust capability in pathway analysis. Similarly, Table 3 presents the significant COVID-19-related WikiPathways identified by those 3 models. DyGAF outperformed by identifying the most significant pathways with adjusted P-values ⩽.05 (Figure 6B). Key pathways identified by DyGAF include the Network Map of SARS-CoV-2 Signaling and Type I Interferon Induction and Signaling. These pathways, supported by in vitro and in vivo studies conducted over the past 5 years, 47 are crucial for COVID-19 diagnosis and medication development.4,5

Comparative analysis of COVID-19 genes and gene ontology (GO) terms. (A) Venn diagram illustrating the overlap and unique genes identification by 3 different models: dynamic gene attention focus (DyGAF), differential expression analysis (DEA), and random forests (RF). (B) Venn diagram displaying the shared and unique counts of statistically enriched COVID-19-related GO terms among DyGAF, DEA, and RF models. (C-E) The bubble plots illustrate the top 20 statistically significant COVID-19-related GO terms identified by DyGAF, DEA, and RF, respectively. The size of the bubbles represents the gene count, while the color intensity indicates the level of statistical significance (P-value).
Statistically significant COVID-19-related KEGG pathways for all the 3 methods including dynamic gene attention focus (DyGAF), differential expression analysis (DEA), and random forest (RF).

For each method, the P-values were corrected for multiple comparisons using Benjamini-Hochberg procedure; and overlap indicates the number of genes (from each model) shares with a reference pathway.
Statistically significant COVID-19-related Wiki-pathways for all the 3 methods such as dynamic gene attention focus (DyGAF), differential expression analysis (DEA), and random forest (RF).
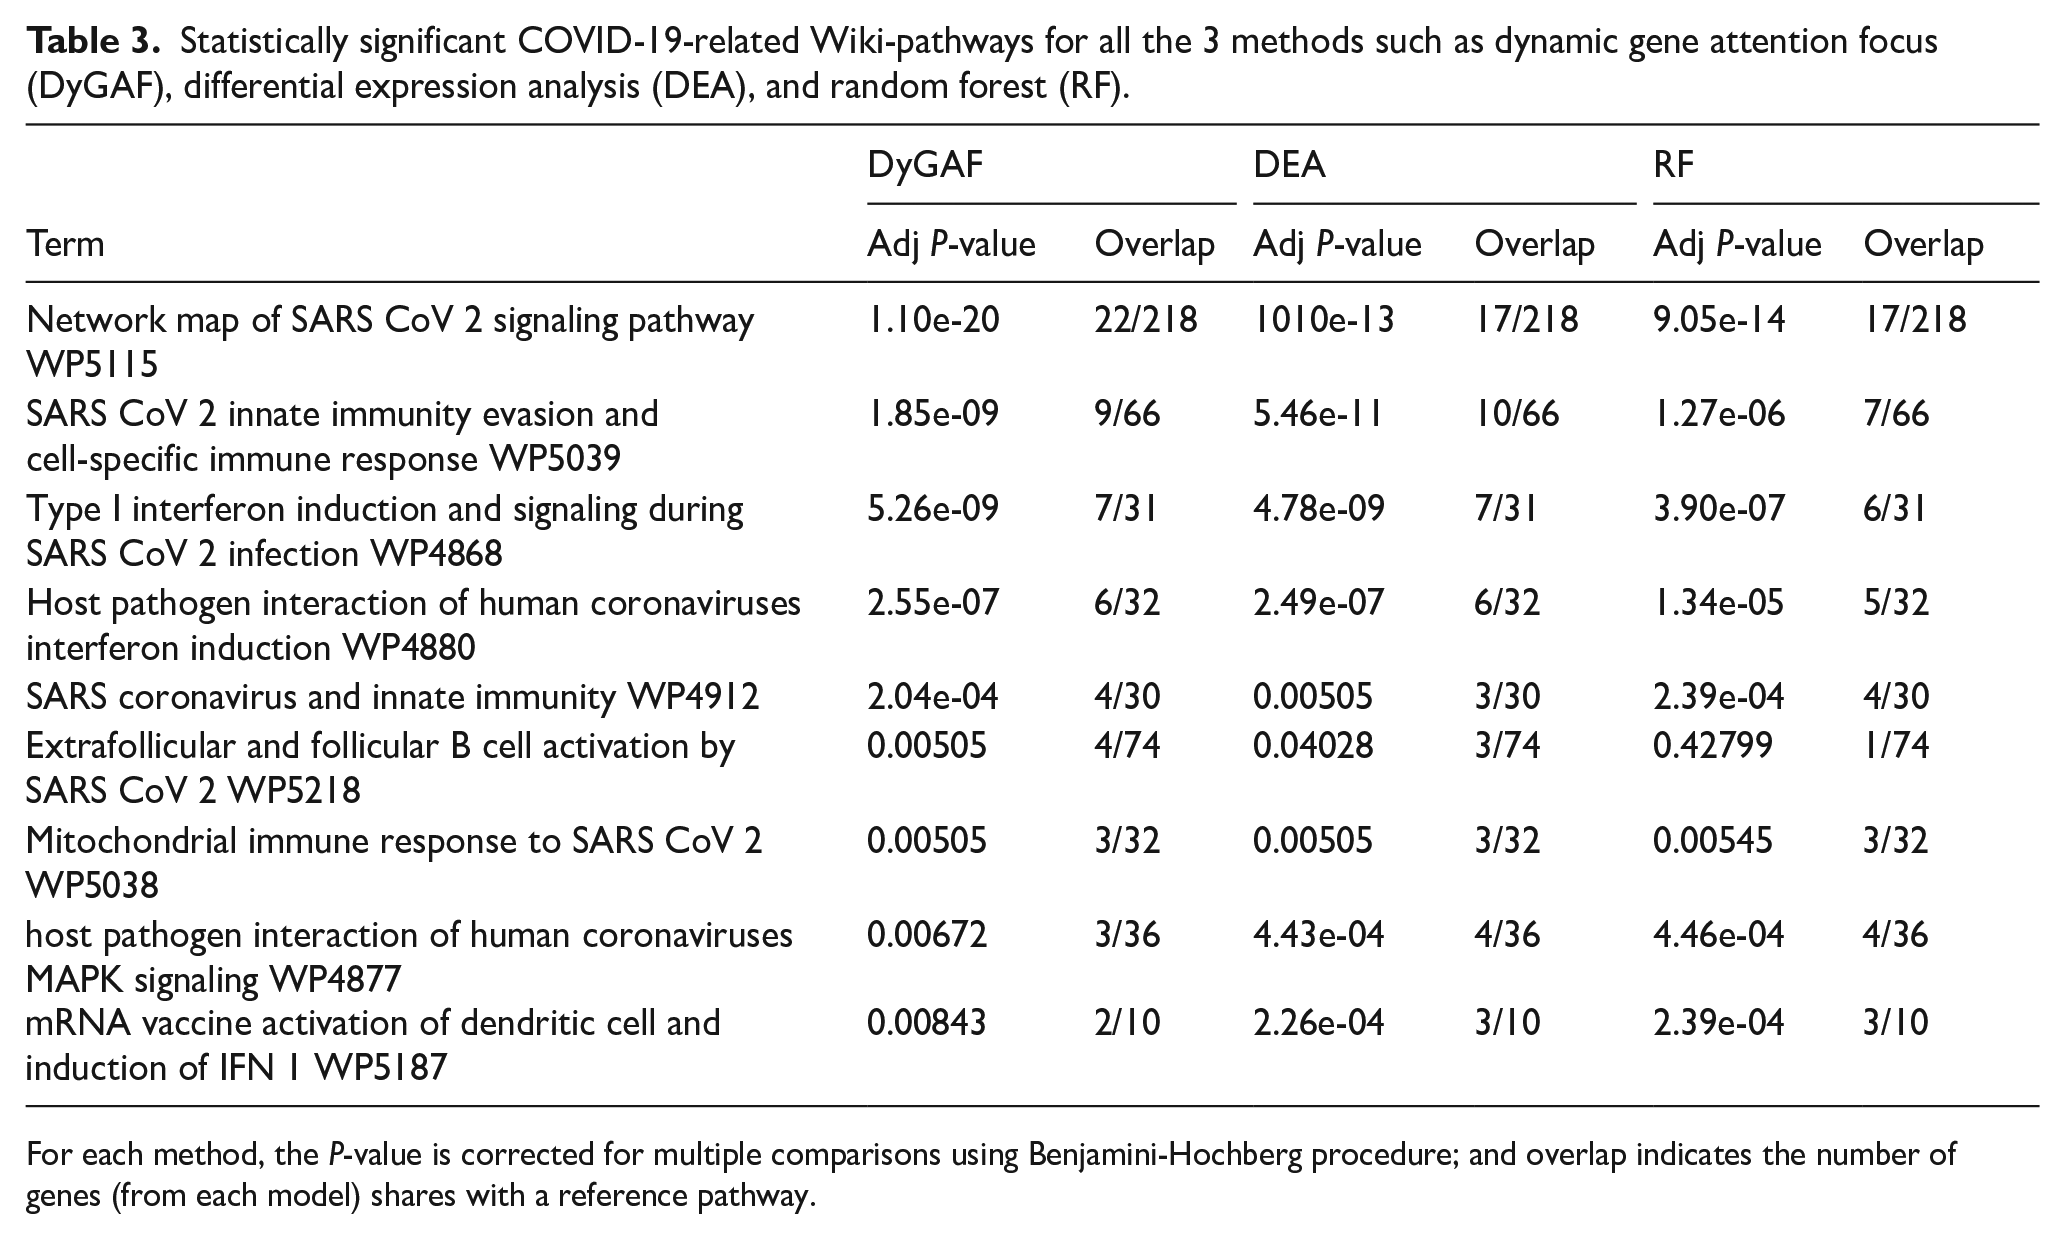
For each method, the P-value is corrected for multiple comparisons using Benjamini-Hochberg procedure; and overlap indicates the number of genes (from each model) shares with a reference pathway.
Moreover, the supplemental tables provide a comprehensive view by including complete GOs and pathway analyses, covering all relevant biological processes. Supplemental Tables 4 through 6 present the results of enriched biological processes identified through GO analysis, and pathways through KEGG, and WikiPathway mapping using the top 100 genes identified by the DyGAF. Supplemental Tables 7 through 9 show similar analyses results for the top 100 genes determined through DEA. Finally, Supplemental Tables 10 through 12 contain the pathway analysis outcomes for the top 100 genes identified using the RF approach. Finally, identified GOs and pathway’s relevance with COVID-19 are discussed in Supplemental File 1.
PPI and hub proteins analysis for biomarker gene identification
To uncover direct molecular interactions, we imported the top 100 genes identified by the DyGAF into the STRING database to contract a relevant PPI network for COVID-19. Various parameters were applied to ensure the specificity and reliability of the interactions, including Network Type, Interaction Sources, and Minimum Required Interaction Score. To ensure the highest confidence in the interactions, a threshold was set at 0.900, exclusively including interactions with the most robust empirical support. The PPI network was constructed with 28 genes and 46 edges using Cytoscape, as shown in Figure 7A. Furthermore, CytoHubba was used to filter the top 10 hub proteins shared by ranking algorithms such as maximum neighborhood component (MCC), Degree, Betweenness, and Closeness. These hub proteins, which play crucial roles in the network, were identified as CXCL13, DDX58, DHX58, OAS1, OAS3, ASF1A, OAS2, H4C14, H3C13, and H2AC4 (Figure 7B). Further discussion of this result can be found in the Additional Discussions of Supplemental File 1.
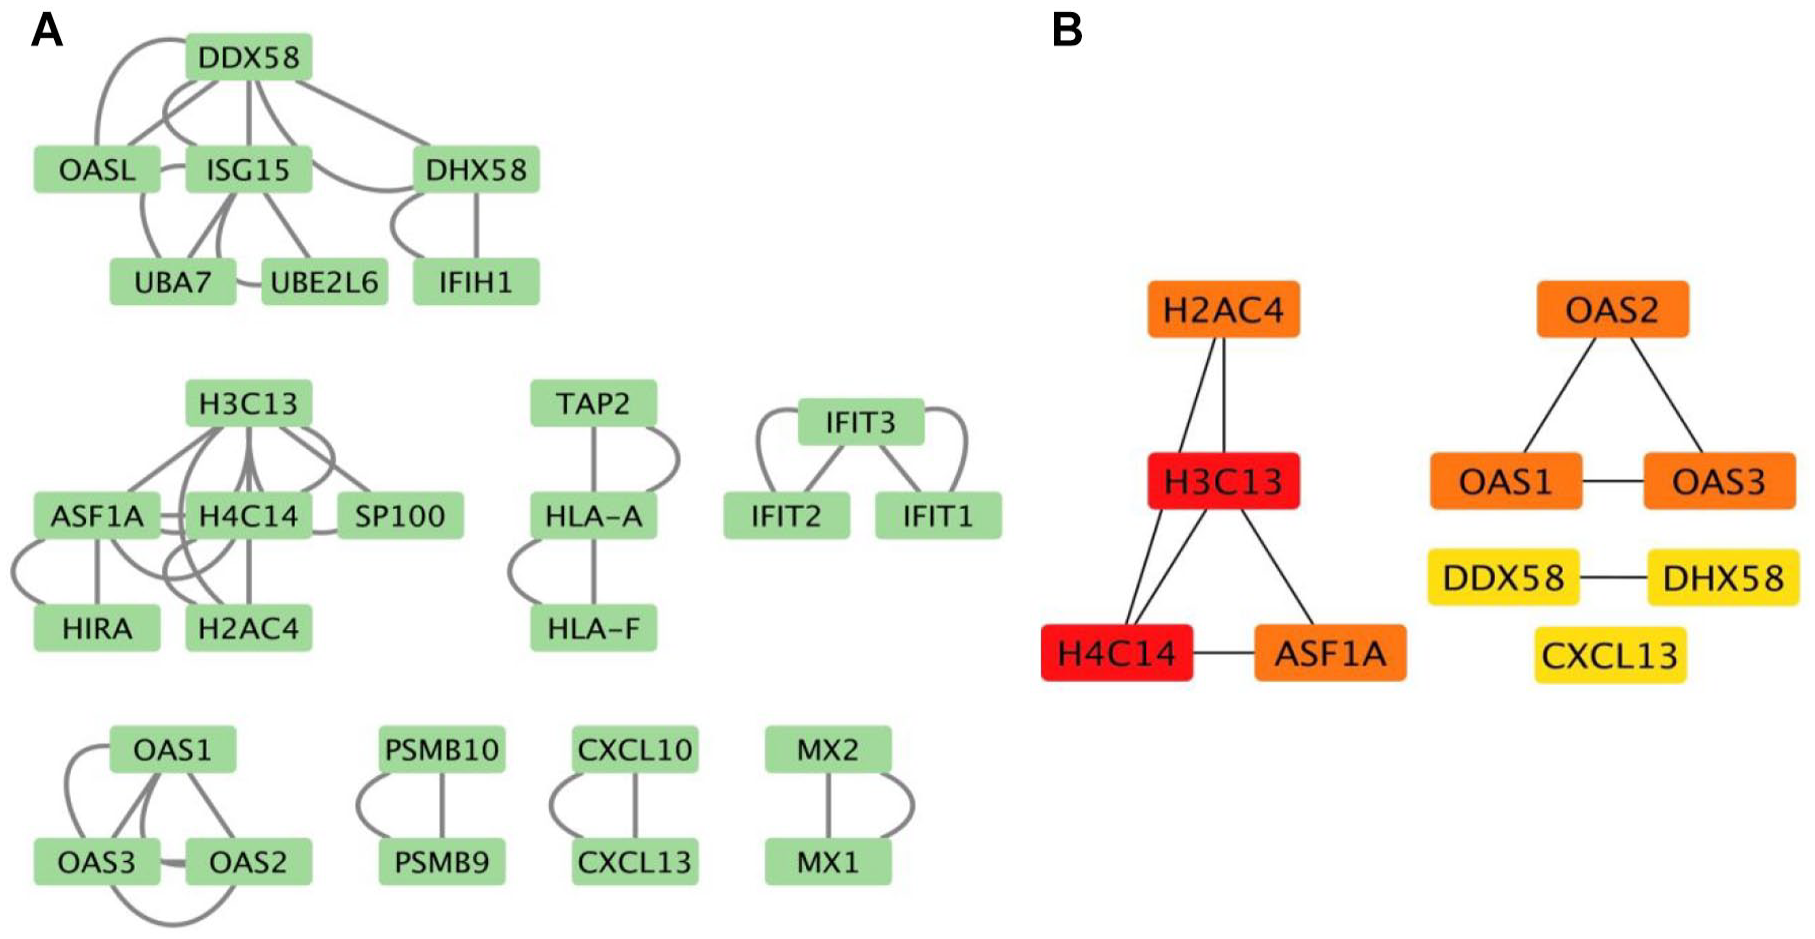
Key protein-protein interactions (PPI) and hub proteins with COVID-19. (A) PPI retrieve from STRING database using the top 100 significant genes. (B) Hub-proteins found out using different algorithms available in cytoHubba.
Transcriptional regulation analysis
The analysis of TF-gene regulatory network using the JASPAR and ChEA databases provided a critical approach to understanding the complex regulatory mechanisms of COVID-19 pathogenesis and host response. Figure 8A and B depict TF-gene networks that regulate the expression of specific genes in COVID-19 patients. The TFs identified, as shown in dark-olive-green nodes, include AR, CREB1, E2F1, FLI1, FOXC1, FOXL1, GATA2, GATA3, HNF4A, IRF8, IRF9, JUN, MEF2A, MYC, NFIC, NFKB1, NFYA, POU2F2, POU5F1, PPARG, RELA, RUNX1, SOX2, SPI1, SREBF1, STAT3, TEAD1, TFAP2A, TP63, USF2, and YY1, whereas the pink nodes represent target genes that are non-TF. In COVID-19 patients, the identified TFs such as NFKB1 (or NF-κB1 in some literature) and RELA (or RelA in some literature) are central to activating genes that drive the inflammatory response, exacerbating severe symptoms and acute respiratory distress syndrome (ARDS). Targeting these can help modulate excessive inflammation. 48 SARS-CoV-2-induced enhancement of STAT3 activity, coupled with STAT1 inhibition, modulates the expression and activity of various genes and proteins involved in immune cell differentiation, cytokine production, and inflammation, playing a crucial role in the severe immune dysregulation observed in COVID-19.49,50 Similarly, IRF8, a TF activated by IFN-γ and TLR signaling, regulates immune cells and the expression of key inflammatory cytokines. 51 This analysis of the TF-gene regulatory network highlighted important TFs and their target genes involved in COVID-19 pathogenesis and host response, providing potential targets for therapeutic intervention and diagnostic biomarkers.

TF-gene network identified using Network Analyst. (A) Visualization of the TF-gene network generated with JASPAR. (B) Visualization of the TF-gene network generated with ChEA database. Dark-olive-green ellipses represent TFs, while pink ellipses represent target genes (non-TF).
Discussion
Although significant research has investigated the genetic basis of different diseases and their interactions with human cells, a crucial gap persists in computational methods capable of retrieving the maximum number of biomarker genes while establishing their biological relevance. This is critical for understanding the variability in a disease such as COVID-19, particularly regarding severity and outcomes (Figure 1). Our study introduced a novel attention-based dynamic dual-model method, termed DyGAF, to identify and rank the most significant genes in response to COVID-19 infection. DyGAF facilitates comparative gene-expression analysis between healthy individuals and COVID-19 patients. In our study, we used samples collected from nasopharyngeal swabs of COVID-19 patients and healthy individuals (Figure 3A), followed by preprocessing, modeling and analysis (Figure 3B). The DyGAF model demonstrated superior accuracy compared with traditional methods such as DEA and RF feature selection (Table 1 and Figure 5). This heightened accuracy can be attributed to several key principles inherent to the DyGAF approach. First, DyGAF uses a dual-model framework that integrates both independent and dependent analyses of gene significance. Model A focused on the individual contributions of each gene, ensuring the identification of genes with strong independent signals. Model B, on the other hand, examines genes within their broader regulatory networks by analyzing gene expression, capturing gene interactions and their collective roles of genes. Both models incorporated attention mechanisms, collectively forming DyGAF, which enhances its ability to prioritize the most relevant genes. This dynamic focus enhances the interpretability and relevance of the identified genes, further contributing to the DyGAF’s superior performance by combining final weights for each gene using a new metric. Furthermore, empirical results, including higher MI scores and improved classification accuracy, validate DyGAF’s efficacy in delivering a more informative and accurate analysis compared with other methods (as shown in Table S1 and S2 within Supplemental File 1). This comprehensive approach enables DyGAF to leverage the strengths of both independent and dependent evaluations, leading to a more nuanced and precise identification of significant genes.
Through the application of DyGAF, we have identified several novel insights into the genetic mechanisms underlying COVID-19. Notably, DyGAF directed the identification of unique GOs that were not highlighted by traditional methods. For instance, the identification of GOs such as “Regulation of Monocyte Chemotactic Protein-1 Production” and “Positive Regulation of T Cell Cytokine Production” provides new avenues for understanding the immune response in COVID-19. These novel findings underscore the ability of DyGAF to uncover previously unrecognized gene interactions and pathways that play crucial roles in disease progression and severity. Furthermore, DyGAF’s holistic approach to analyzing gene networks allows for the identification of key regulatory nodes within these networks. This insight is critical for developing targeted therapeutic interventions and improving our understanding of the complex biological processes involved in COVID-19 or other infectious diseases. More discussion can be found in the Additional Discussions of Supplemental File 1. The discovery of these novel GOs and pathways highlighted the potential of DyGAF’s contribution toward the field of genomics and infectious disease research.
DyGAF also identified a key pathway called “Coronavirus Disease” in KEGG with greater statistical significance and a higher number of enriched genes (Table 2). Moreover, both DyGAF and DEA identified a greater number of COVID-19-related pathways in the WikiPathways database compared with RF (Table 3). The identified pathways, such as the “Network Map of SARS-CoV-2 Signaling Pathway” and “SARS-CoV-2 Innate Immunity Evasion and Cell-Specific Immune Response,” provided detailed insights on how the virus evades host immune defenses and triggers the subsequent cellular responses. 52 Further details about these pathways can be found in Additional Discussions of Supplemental File 1. In addition, the protein-protein interaction (PPI) analysis using DyGAF biomarkers identified crucial hub proteins such as histones, 53 ASF1A, 54 OAS enzymes, 55 DDX58, 56 and CXCL13, 57 which play significant roles in the host’s immune response to SARS-CoV-2. Further discussions can be found in Supplemental File 1.
The accuracy and reliability of DyGAF are contingent on the availability of comprehensive genomic data. DyGAF uses raw-read counts gene expression, which can be obtained a specific host species of interest, making it widely applicable. Its efficiency can be further amplified with increased data size and quality. However, the computational complexity of DyGAF, particularly with the integration of attention mechanisms and dual-model frameworks, can be resource-intensive, necessitating significant computational power and expertise. The other limitation is the potential for overfitting, particularly when dealing with small sample sizes. Although we have implemented various strategies to mitigate overfitting, such as cross-validation, and hyperparameter tuning, the risk cannot be entirely eliminated. Future work should focus on refining these techniques and exploring additional methods to further reduce the risk of overfitting. Finally, while DyGAF provides valuable insights into gene interactions and regulatory networks, the interpretation of these results requires careful consideration. The biological relevance of identified genes and pathways must be validated through experimental studies, and the potential for false positives or negatives should be critically assessed.
Conclusions
In conclusion, the DyGAF model offers a robust and innovative approach to gene significance analysis, particularly in identifying biomarkers of infectious diseases within complex genomic data. In addition, DyGAF’s superior diagnostic performance, characterized by exceptional sensitivity, underscores its importance in disease outbreak management by ensuring the rapid detection of causative pathogens for timely intervention. By leveraging gene GO enrichment analysis and pathway studies, DyGAF effectively identified essential genes and outlined the host-pathogen interactions, emphasizing the critical roles of host defense and viral evasion mechanisms. The analyses revealed pivotal biological processes, including interferon signaling, cytokine production, and immune regulation. These mechanisms are crucial for therapeutic targeting to enhance viral clearance and reduce inflammatory responses. In addition, the model’s identification of hub proteins highlights their roles in processes such as NET formation and cytokine signaling modulation, pinpointing potential targets for mitigating viral replication and managing immune responses. Overall, DyGAF provides a solid foundation for future research, guiding the development of more effective diagnostics, treatments, and preventive strategies against infectious diseases.
Supplemental Material
sj-docx-1-bbi-10.1177_11779322251325390 – Supplemental material for Dynamic Gene Attention Focus (DyGAF): Enhancing Biomarker Identification Through Dual-Model Attention Networks
Supplemental material, sj-docx-1-bbi-10.1177_11779322251325390 for Dynamic Gene Attention Focus (DyGAF): Enhancing Biomarker Identification Through Dual-Model Attention Networks by Md Khairul Islam, Himanshu Wagh and Hairong Wei in Bioinformatics and Biology Insights
Supplemental Material
sj-xlsx-2-bbi-10.1177_11779322251325390 – Supplemental material for Dynamic Gene Attention Focus (DyGAF): Enhancing Biomarker Identification Through Dual-Model Attention Networks
Supplemental material, sj-xlsx-2-bbi-10.1177_11779322251325390 for Dynamic Gene Attention Focus (DyGAF): Enhancing Biomarker Identification Through Dual-Model Attention Networks by Md Khairul Islam, Himanshu Wagh and Hairong Wei in Bioinformatics and Biology Insights
Footnotes
References
Supplementary Material
Please find the following supplemental material available below.
For Open Access articles published under a Creative Commons License, all supplemental material carries the same license as the article it is associated with.
For non-Open Access articles published, all supplemental material carries a non-exclusive license, and permission requests for re-use of supplemental material or any part of supplemental material shall be sent directly to the copyright owner as specified in the copyright notice associated with the article.