
Abstract
Identifying interactions between transcription factors (TFs) and target genes is crucial for understanding the molecular mechanisms involved in biological processes and diseases. Traditional biological experiments used to determine these interactions are often time-consuming, costly, and limited in scale. Current computational methods mainly predict binding sites rather than direct interactions. Although recent studies have achieved high performance in predicting TF–target gene associations, they still face a significant challenge related to constructing a robust dataset of positive and negative samples. Currently, methods do not adequately focus on selecting negative samples, resulting in incomplete coverage of potential TF–target gene relationships. This article proposes a method to select enhanced negative samples to improve the prediction performance of TF–target gene interactions. Experimental results show that the proposed method achieves an average area under the curve (AUC) value of 0.9024 ± 0.0008 through 5-fold cross-validation. These results demonstrate the model’s high efficiency and accuracy, confirming its potential application in predicting TF–target gene interactions across various datasets and paving the way for large-scale biomedical research.
Introduction
Transcription factors (TFs) are regulatory proteins responsible for controlling the transcription process of genes. This process involves converting genetic information from DNA into RNA.1,2 TFs perform this function by binding to specific DNA sequences, which are often located near or within the gene’s promoter region. When a TF binds to DNA, it can activate or inhibit the activity of RNA polymerase, the enzyme responsible for transcribing information from DNA to RNA. TFs play a critical role in regulating gene expression, directly influencing cell development and maintaining normal biological functions. However, disruptions in the activity of TFs can adversely affect gene regulation, leading to the development of various serious diseases. Accurately identifying the relationships between TFs and their target genes is a significant advancement in understanding the complex molecular mechanisms underlying fundamental biological processes and the pathogenesis of numerous diseases. These insights will pave the way for more extensive research in molecular biology and applied biomedical sciences, contributing to the development of more effective methods for disease diagnosis, treatment, and prevention in the future.
Previously, identifying interactions between TFs and their target genes relied on experimental methods that required significant effort and time. However, with the rapid development of high-throughput analysis techniques, particularly chromatin immunoprecipitation sequencing (ChIP-seq) and RNA sequencing (RNA-seq), predicting TF–target genes on a genome-wide scale has become feasible. 3 ChIP-seq enables mapping of the interactions between TFs and DNA across the entire genome, while RNA-seq provides data on RNA expression, aiding in identifying genes affected by TF activity.4,5 Although experimental results have achieved considerable success in identifying interactions between TFs and target genes, these outcomes only reflect a small fraction of the entire complex gene regulatory network (GRN). For many TF–target gene links, the type of interaction remains unclear in public databases. Existing datasets on the interaction between TFs and target genes, obtained through techniques, such as ChIP-seq, only cover a small portion of the entire GRN. Furthermore, current computational methods mainly predict binding sites rather than direct interactions. Some recent studies have achieved high performance in predicting links between TFs and target genes, but there still exists a significant limitation in constructing a good dataset for positive and negative prediction samples. Currently, methods do not adequately emphasize the selection of negative samples, leading to a deficiency in comprehensively capturing potential relationships between TFs and target genes, thereby affecting the prediction performance. Therefore, there is a need to continue developing computational methods to identify potential interactions between TFs and target genes, to select the most promising candidate pairs for biological experiments.
This article discusses a method for selecting enhanced negative samples to improve the prediction of relationships among TFs, target genes, and diseases. The key points of this research are as follows:
(a) The negative sampling method we propose enhances efficiency, ensuring robust and reliable prediction performance.
(b) The model we developed achieves higher prediction performance in linking TFs to target genes, representing a significant advancement in this field.
(c) Our method demonstrates remarkable effectiveness and outstanding accuracy compared with existing approaches, as supported by rigorous evaluation and comparative analysis.
(d) The experimental validation results demonstrate that our proposed method is a feasible solution and significantly outperforms existing methods in this research area.
Related Work
The prediction of interactions between TFs and target genes has garnered significant attention due to its importance in understanding gene regulation mechanisms and disease mechanisms. Several research methods have been developed to address this challenge, focusing on 3 aspects: Binding site prediction approaches, Network-based approaches, and Heterogeneous graph-based models.
Binding site prediction approaches
Most current computational methods for identifying interactions between TFs and target genes focus on their binding sites. This is achieved by calculating the corresponding transcription factor binding sites (TFBS) and using traditional deep learning models, such as convolutional neural networks (CNN) and recurrent neural networks (RNN).
Among the CNN-based methods, Avsec et al 6 introduced the BPNet model. This model uses DNA sequences to predict ChIP-nexus binding profiles of TFs with pluripotency. Similarly, Salekin et al 7 proposed DeepSNR, a deep learning algorithm based on the deconvolutional network (deconvNet) model, inspired by image segmentation, predicts TFBS at the single nucleotide resolution from DNA sequences. DeepSNR has been shown to be useful in the regulatory analysis of TFBS binding sites and in improving the specificity of TFBS predictions using ChIP-seq data.
For RNN-based methods, Lachantin et al 8 developed the Deep Motif Dashboard (DeMo Dashboard) to visualize and better understand deep neural network (DNN) models in classifying TFBS. Meanwhile, Shen et al 9 proposed the KEGRU model. This model combines a bidirectional gated recurrent unit (GRU) network with k-mer embedding techniques. Experimental results demonstrated that their method outperforms several advanced methods, particularly when using k-mer embedding to enhance model performance.
Computational strategies using CNN and RNN have made significant strides in predicting TFBS, but they are constrained by their reliance on long non-coding DNA sequences, 10 complicating the precise identification of TFBS and resulting in high false-positive rates. Furthermore, these methods often overlook the direct interaction network between TFs and target genes, thereby limiting their predictive performance and practical applicability.
Network-based approaches
Recent advances in GRN prediction have achieved significant milestones, thanks to the development of algorithms based on gene expression data and transcriptional regulatory relationships. Pratapa et al 11 evaluated advanced algorithms for inferring GRNs from single-cell transcriptional data, using synthetic networks, Boolean models, and experimental RNA-seq data. They developed the evaluation framework BEELINE, which demonstrated that the algorithms achieved moderate performance in terms of AUC-PR but performed better on synthetic networks compared with Boolean models. Methods that did not rely on pseudotime-ordered cells exhibited higher accuracy. BEELINE is expected to drive the development of network inference methods further.
In another study, Su et al 12 developed the computational platform NetAct to construct core TF regulatory networks using transcriptomics data and TF–target gene databases derived from literature. NetAct has been successfully applied to model the regulatory networks of TGF-β-induced epithelial–mesenchymal transition and macrophage polarization, demonstrating significant potential in analyzing and predicting complex GRNs.
Building on these efforts, Fan et al 13 proposed 3D Co-Expression Matrix Analysis (3DCEMA), a deep learning method using a 3D CNN to predict gene regulations by classifying 3D co-expression matrices of gene triplets. The inclusion of unique labels and a third reference gene effectively reduces the impact of noise and data dropout. In addition, scalability improvements enable 3DCEMA to handle scRNA-seq datasets. This method outperforms existing algorithms in both stability and accuracy, providing a reliable tool for researchers to infer GRNs efficiently.
Although the interaction between TFs and their target genes plays a critical role in disease mechanisms, the methods mentioned above have not fully considered the role of TFs in predicting their target genes. Furthermore, despite the promising results of the 3DCEMA method, it faces limitations due to the high cost of scRNA-seq data and the substantial computational resources required, making its large-scale implementation and application in extensive experimental studies challenging.
Heterogeneous graph-based models
With the increasing amount of data on interactions between TFs and target genes collected from experiments, the TRRUST database 14 has been published to provide comprehensive information on these interactions within human GRNs. TRRUST currently contains 8427 TF–target gene interactions for 795 human TFs. Several studies have used the TRRUST database to predict interactions between TFs and target genes. For instance, Huang et al 15 proposed a novel deep learning model named HGETGI to predict TF–target gene interactions. This model employs a random walk technique on a heterogeneous graph comprising TF, target gene, and disease nodes to generate sample paths. Subsequently, a heterogeneous graph embedding technique is applied to these sample paths to learn vector representations for the nodes. Experimental results demonstrate that HGETGI outperforms other methods when applied to real-world datasets.
Similarly, Du et al 10 proposed the GraphTGI model to predict TF–target gene interactions based on a heterogeneous graph. The performance of this model is also impressive, with an average AUC value of 88.64% achieved through 5-fold cross-validation, indicating that GraphTGI is a powerful tool for analyzing and predicting TF–target gene interactions. Both methods demonstrated the utility of heterogeneous networks but did not explicitly address the issue of negative sample selection, which is critical for robust model training.
Although current methods have achieved high performance in predicting the links between TFs and target genes, the issue of selecting negative samples has not been adequately addressed. This oversight may lead to incomplete coverage of potential relationships between TFs and target genes. As it is well known, the number of negative samples in practice is much greater than the number of positive samples in the dataset. Therefore, in this study, we propose a novel method called “Enhanced Negative Sampling” to improve the quality of negative samples. This method considers the relationships between disease pairs, along with the interactions between TFs and diseases, and the interactions between target genes and diseases. By incorporating these additional relationships, optimized negative samples are selected, leading to enhanced prediction performance.
The Method
Data collection
In this section, we introduce the data we used, which consist of 3 types of nodes, 15 namely TF, target gene, and disease nodes, and 3 kinds of relationships between the 3 types of nodes. The 3 types of relationships are TF–target gene, TF–disease relationships, and target gene–disease relationships (Tables 1 and 2).
Nodes in the network.

Relationships in the network.

Actual data on the interaction between TFs and target genes in humans are collected from the TRRUST database. TRRUST, constructed using text mining based on sentences, is a manually curated database on transcriptional regulatory networks. During this process, duplicate pairs were removed, resulting in 6542 interactions between 696 TFs and 2064 target genes. In addition, TFs and target genes were associated with diseases through the public DisGeNET database. DisGeNET focuses on the genetic basis of human diseases. As a result, 8199 associations between TFs and diseases were gathered, along with 31 895 associations between target genes and diseases, encompassing 6121 different types of diseases.
Method
The data in the TF–target gene problem comprise interactions between TFs and target genes, between TFs and diseases, and between target genes and diseases. Known TF–target gene pairs were collected as positive samples, while unknown TF–target gene pairs were generated as negative samples using our improved method. These datasets were used to evaluate the performance of predicting the relationship between TFs and target genes.
Figure 1 illustrates the workflow of our method in 6 steps: (a) constructing a heterogeneous TF–target gene disease network based on previously known relationships of TF–target gene interactions, target gene–disease interactions, and TF–disease interactions; (b) generating enhanced negative datasets using our improved method; (c) heterogeneous meta-path definition; (d) conducting random walks on the graph along the meta-path to generate training data for the embedding model; (e) learning representations of heterogeneous network nodes using a deep learning model; and (f) predicting TF–target gene interactions.

The workflow consists of 6 fundamental steps.
Heterogeneous construction
A heterogeneous network has many types of nodes and relationships. The nodes in the network can represent different entities, such as people, devices, documents, or other types of data, while the edges depict the relationships or interactions between these entities.
Definition 1.
In recent years, leveraging diverse data sources to construct classification models has become a prevalent trend. The richness and diversity of information from various sources offer numerous benefits, enhancing the capability and efficiency of classification models. By thoroughly exploiting features and unique characteristics from each data source, these models can achieve higher accuracy and generalization than using a single data source alone. This study aims to design a model to predict the association between TFs and target genes. It is known that TFs and target genes each have specific relationships with various types of diseases; using them can help detect potential associations between TFs and target genes. Therefore, a heterogeneous network is constructed, where TFs, target genes, and diseases are defined as nodes. There are 3 types of nodes in the network, and we identified 3 types of edges, each corresponding to a type of association between TFs, target genes, and diseases.
Extract-enhanced negative sampling
Figure 2 visually illustrates how to extract enhanced negative samples. The work uses the following notations: z for TFs, d for diseases, and t for target genes. The interactions between TFs and target genes are represented by the matrix Azt[m×n]. In this matrix, each element Azt[i, j] = 1 if TF zi regulates target gene tj, and Azt[i, j] = 0 if the relationship between TF zi and target gene tj is unknown. Similarly, the matrix Azd[m×p] represents the interactions between TFs and diseases, where Azd[i, j] = 1 if TF zi is associated with disease dj, and Azd[i, j] = 0 if there is no such interaction. The interactions between target genes and diseases are captured in the matrix Atd[n×p], where Atd[i, j] = 1 if target gene ti is directly associated with disease dj and Atd[i, j] = 0 if there is no known relationship.
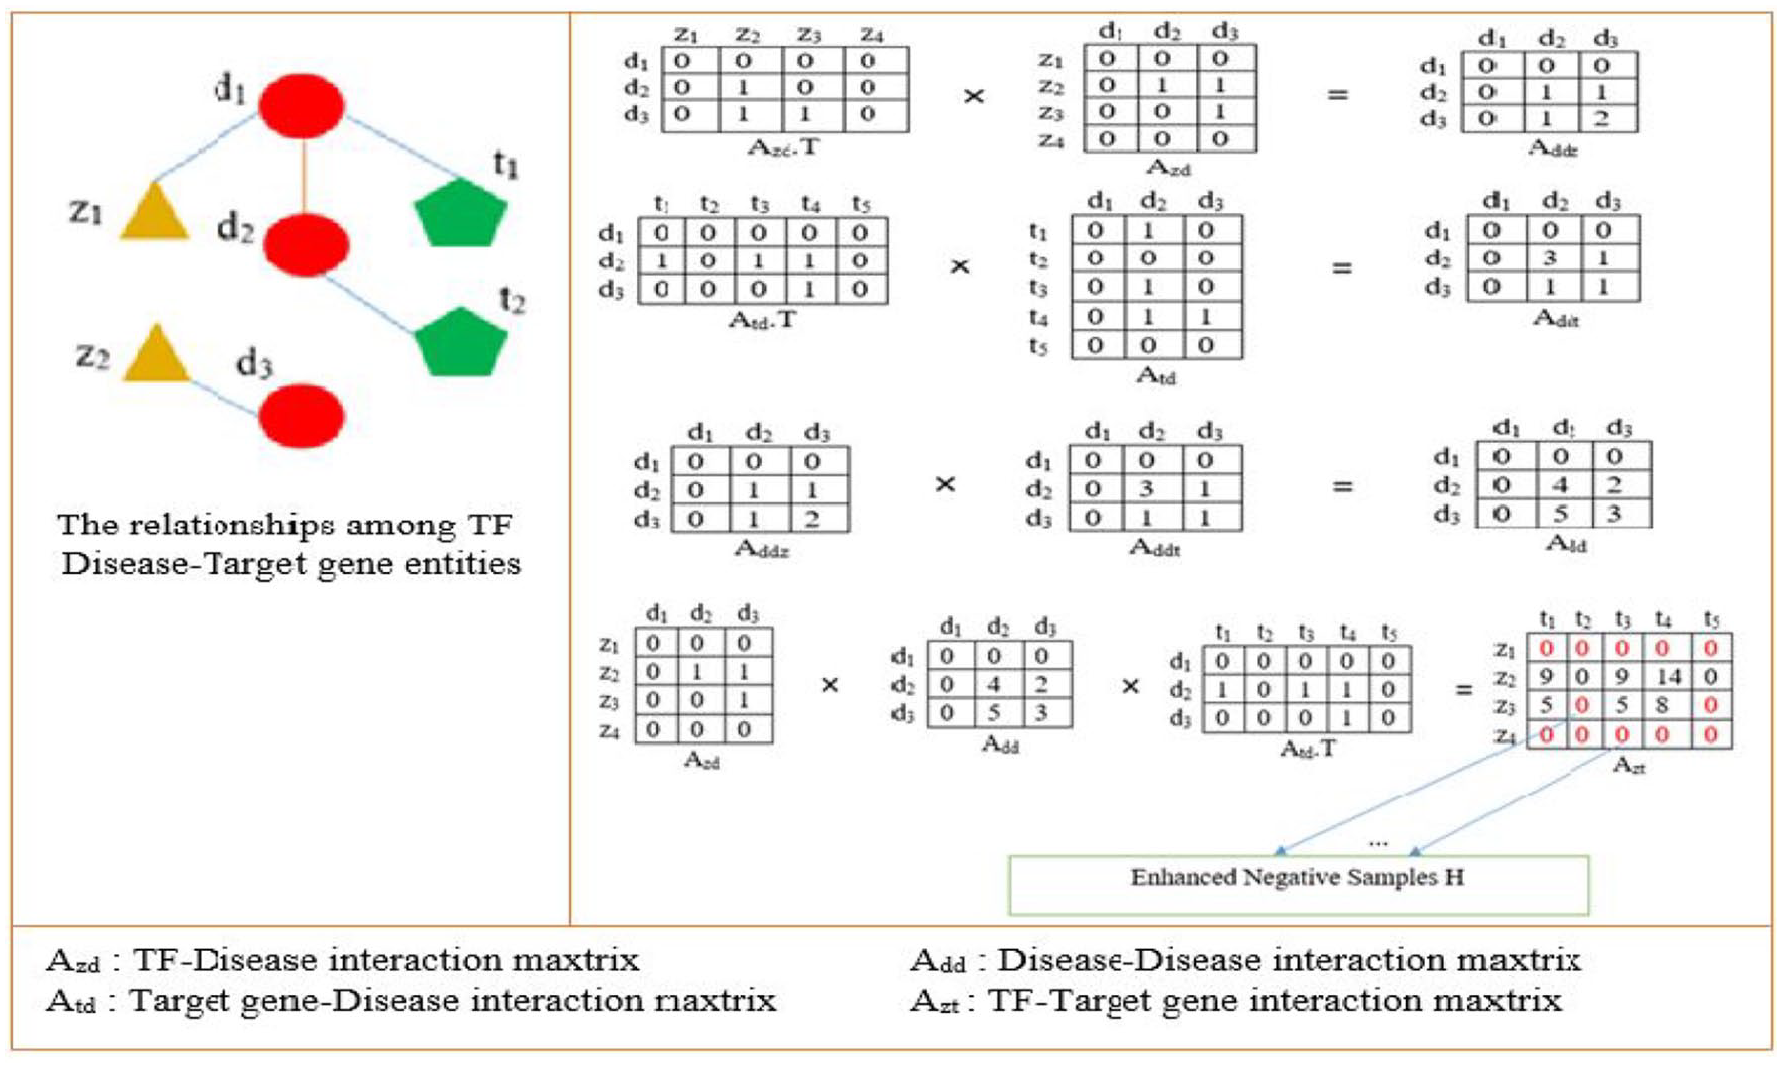
Extract-enhanced negative samples.
We use Bayesian inference18,19 to model the interaction between TFs and target genes for TF design. It is crucial to evaluate the prediction P(z|t), which represents the probability of using a TF z for a target gene t. This evaluation is typically based on the likelihood P(t|z) of t given z, the prior probability P(t), and the marginal probability P(z), as follows:

However, the marginal probability P(t) of the target gene t is usually negligible, shifting the focus to the likelihood P(t|z) and the probability P(z):

Specifically, the TF–target gene interaction, which has data in the past to be analyzed, can be used to estimate the prior probability P(z) from existing training data:
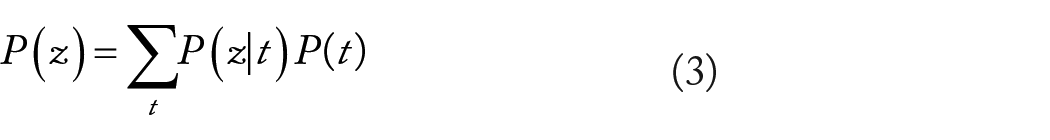
When constructing the TF–target gene–disease heterogeneous network, various values of P(z|t) are derived from equation (3), as follows:

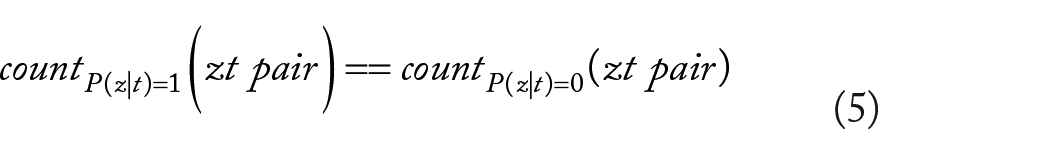
It is also worth noting that the number of TF–target gene interactions confirmed to be coded by a value of 1 is significantly smaller than the number of unconfirmed interactions marked by a value of 0 in equation (4). During the training process, samples are chosen in such a way that the number of positive samples (value of 1) matches the number of negative samples (value of 0). This balance is crucial to ensure accurate predictive performance. It means that:
Our heterogeneous network not only encompasses TF–disease interactions via P(z|d), disease–disease interactions via P(d|d), and disease–target gene interactions via P(d|t) but also offers an alternative estimation approach as follows:

Looking at it this way, equation (6) yields fundamental values of 0, 1, and other values (k) within the interval (0, 1), as follows:

Given our focus on selecting negative samples from a vast pool, it may be prudent to opt for those negative samples with precisely estimated P(z|t) values of zero, thereby eliminating any samples where k ∈ (0, 1). This selective process aids in refining the accuracy of P(t) estimation outlined in equation (3), thereby bolstering prediction performance. Consequently, our approach to constructing negative samples does not rely directly on TF–target gene interactions; instead, it leverages interactions between target genes and diseases, and TF–disease interactions.
From the aforementioned issues, we select enhanced negative samples for training as follows. First, we propose to construct a disease–disease interaction matrix (Add) to represent the relationships among diseases, based on the TF–disease interaction matrix (Azd) and the target gene–disease interaction matrix (Atd). Next, we re-evaluate the correlation between TFs and target genes by employing the linear multiplication of 3 matrices: the TF-disease interaction matrix, the target gene–disease interaction matrix, and the disease–disease interaction matrix. The process of extracting enhanced negative samples is detailed in Algorithm 1.
Enhanced negative sampling.

Meta-path-induced networks
A meta-path is a widely used concept when constructing models based on networks. The hidden association information can be extracted from a given network using a meta-path.
Definition 2.
Take Figure 3 as an example. A meta-path “TP53—Lung Cancer—EGFR—Breast Cancer—MYC” represents 2 TF relationships with diseases through a common target (EGFR): TP53 (TF) → Lung Cancer (Disease) → EGFR (Target) → Breast Cancer (Disease) → MYC (TF). This meta-path illustrates how the TFs TP53 and MYC are connected to lung cancer and breast cancer, respectively, through the shared target gene EGFR. This example demonstrates the complex relationships within a biological network and how meta-paths aid in identifying these hidden connections.

Meta-path: TF—disease—target—disease—TF.
Node embedding learning with skip-gram
After completing the step of enhanced negative sampling (Figure 1B), we developed a graph embedding model based on sampled paths generated through random walks. This model incorporates 2 neural networks designed to learn node representations capable of predicting the context nodes surrounding a target node along the paths (Figure 1E). Specifically, the first neural network consists of 3 layers, with the input being a central node. From this central node, the network generates a set of highly probable related nodes. The second neural network is designed to compute the similarity between the central node and its neighboring nodes. In the TF–target gene–disease network, the first neural network scans the sampled paths generated from random walks (Figure 1D). For each node, the network attempts to embed the node in such a way that its features can accurately predict its neighboring nodes. During the scan, each node in the sampled path sequentially acts as the central node, while the neighboring nodes within the scanning window (of size k) form the context for embedding learning. The embedding process is based on maximizing the likelihood that a node can connect with its heterogeneous neighborhood. This approach is implemented using the skip-gram method, as detailed below.
In particular, given a heterogeneous network G = (V, E, T) with the number of node types

where

where
To calculate the embedding distance between a center node

where F represents the fully connected layer,

Results and Discussion
Evaluation criteria
To evaluate the performance of the proposed method, we employed the k-fold cross-validation technique (with k = 5). Specifically, the data were randomly divided into k approximately equal parts, where each part was sequentially used as the test set in k iterations. This means that a model was trained on k−1 remaining parts and tested on the kth part. This process was repeated k times, with each part of the data used once as the test set. To demonstrate the effectiveness of our proposed method in k-fold cross-validation, we applied the Area Under the ROC Curve (AUC), 15 calculated as follows:

where
We conducted experiments with different values for 3 parameters: the number of walkers, the path length, and the dimension of the embedding, and compared the prediction results for each parameter change. The average AUC value of each experiment is presented in Table 3. The best prediction results were achieved with a number of walkers of 450, a path length of 130, and a dimension of embedding of 450. The corresponding ROC curve is shown in Figure 4, illustrating that our proposed method achieved an average AUC value of 0.9024 ± 0.0008 through 5-fold cross-validation.
Comparison of performance based on AUC during 5-fold CV with different parameter sets.

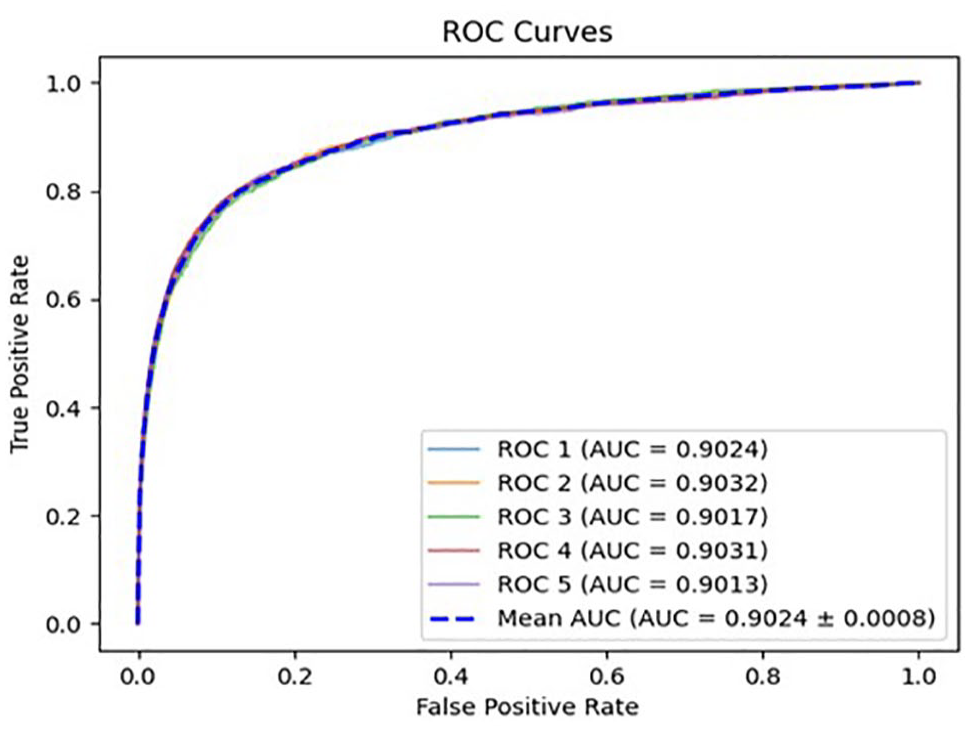
The ROC curve yielded under 5-fold cross-validation.
Optimizing embedding learning and prediction capability in heterogeneous networks
The random walk strategy using a meta-path ensures that the semantic relationships between different types of nodes are accurately modeled. In the experiment, we used the meta-path “TF–Target–Disease/CS–Target–TF” 15 to perform random walks on the heterogeneous network. Here, CS (Cold Start node) is a node added to the sampled paths. Adding the CS node to the sampled paths addresses the cold start problem in the model. This issue arises when some nodes (specifically TFs or target genes) have no links to any target genes in the training data after randomly removing certain edges between TFs and target genes, making it difficult to learn vector embeddings for these nodes. By adding the CS node and setting its embedding to an all-ones vector, the model can learn information from the paths containing the CS node, thus mitigating the lack of linkage data for these nodes.
Comparison with recent studies
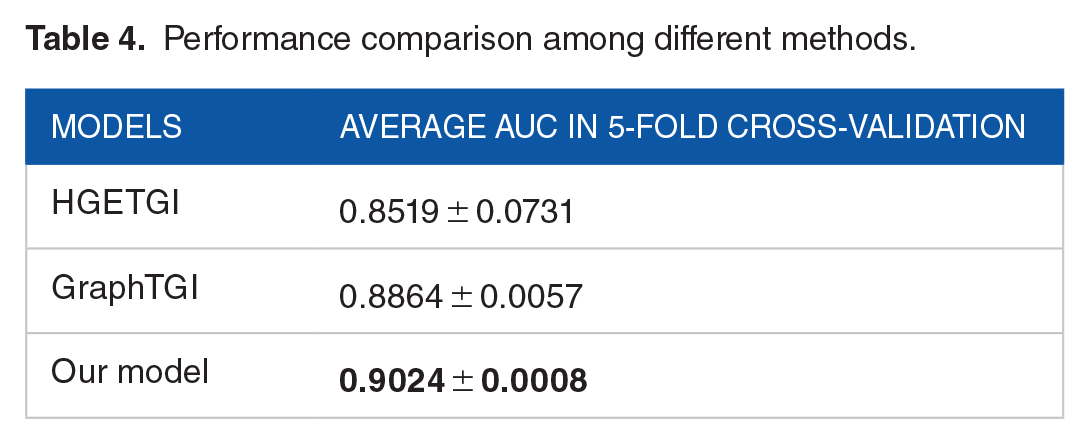
To verify the superior performance of the proposed model, we compared its predictive performance with recent studies, including HGETGI 15 and GraphTGI. 10 The predictive performance of the 3 methods is presented in Table 4. The results show that our method achieved the highest average AUC value of 0.9024, outperforming the other 2 prediction methods. Therefore, the experimental results confirm that our method has a significant capability in predicting unobserved target genes for specific TFs.
Performance comparison among different methods.
Case study
To further assess the predictive capability of our model in identifying potential target genes related to specific TFs, we conducted studies on 2 TFs: STAT1 and STAT3. Specifically, we removed the links between the specific TFs and their target genes. Then, we reconstructed the heterogeneous network. Finally, we trained the model and inputted the specific TFs to evaluate the results.
Cancer is characterized by multiple factors, including the abnormal activation of the STAT1 and STAT3 signaling pathways. 22 This abnormality occurs through the activation of STAT genes and dysregulation in immune control. Specifically, STAT3 plays a crucial role in the survival of cancer cells by activating anti-apoptotic proteins, such as Survivin, members of the Bcl family, and cell cycle–related proteins, such as cyclin D1, c-Myc, and pim-1/2, thereby enhancing tumor invasiveness. In addition, STAT3 acts as an antagonist to the TF STAT1 and functions as a tumor suppressor. In many types of tumors, STAT1 is often regulated and mediates the antiproliferative and proliferative activities of interferons (IFNs). However, when STAT1 is abnormally activated and expressed, it can promote carcinogenesis and tumor development. Abnormal activation of STAT1 has been observed in various malignancies, such as breast cancer, lymphoma, and hepatocellular carcinoma, indicating that abnormal expression of STAT1 may contribute to tumor proliferation rather than inhibiting malignant transformation. STAT1 and STAT3 are the key genes being researched for their potential clinical applications in diagnosing and treating various cancers.
After training the model, we obtain low-dimensional embedding vectors for TFs and target genes. 15 From this, we create the embedding matrix Z for TFs and the embedding matrix G for target genes. The prediction scores for the interactions between TFs and target genes are determined as follows:

where the value in the ith row and jth column represents the interaction score between the ith TF and the jth target gene.
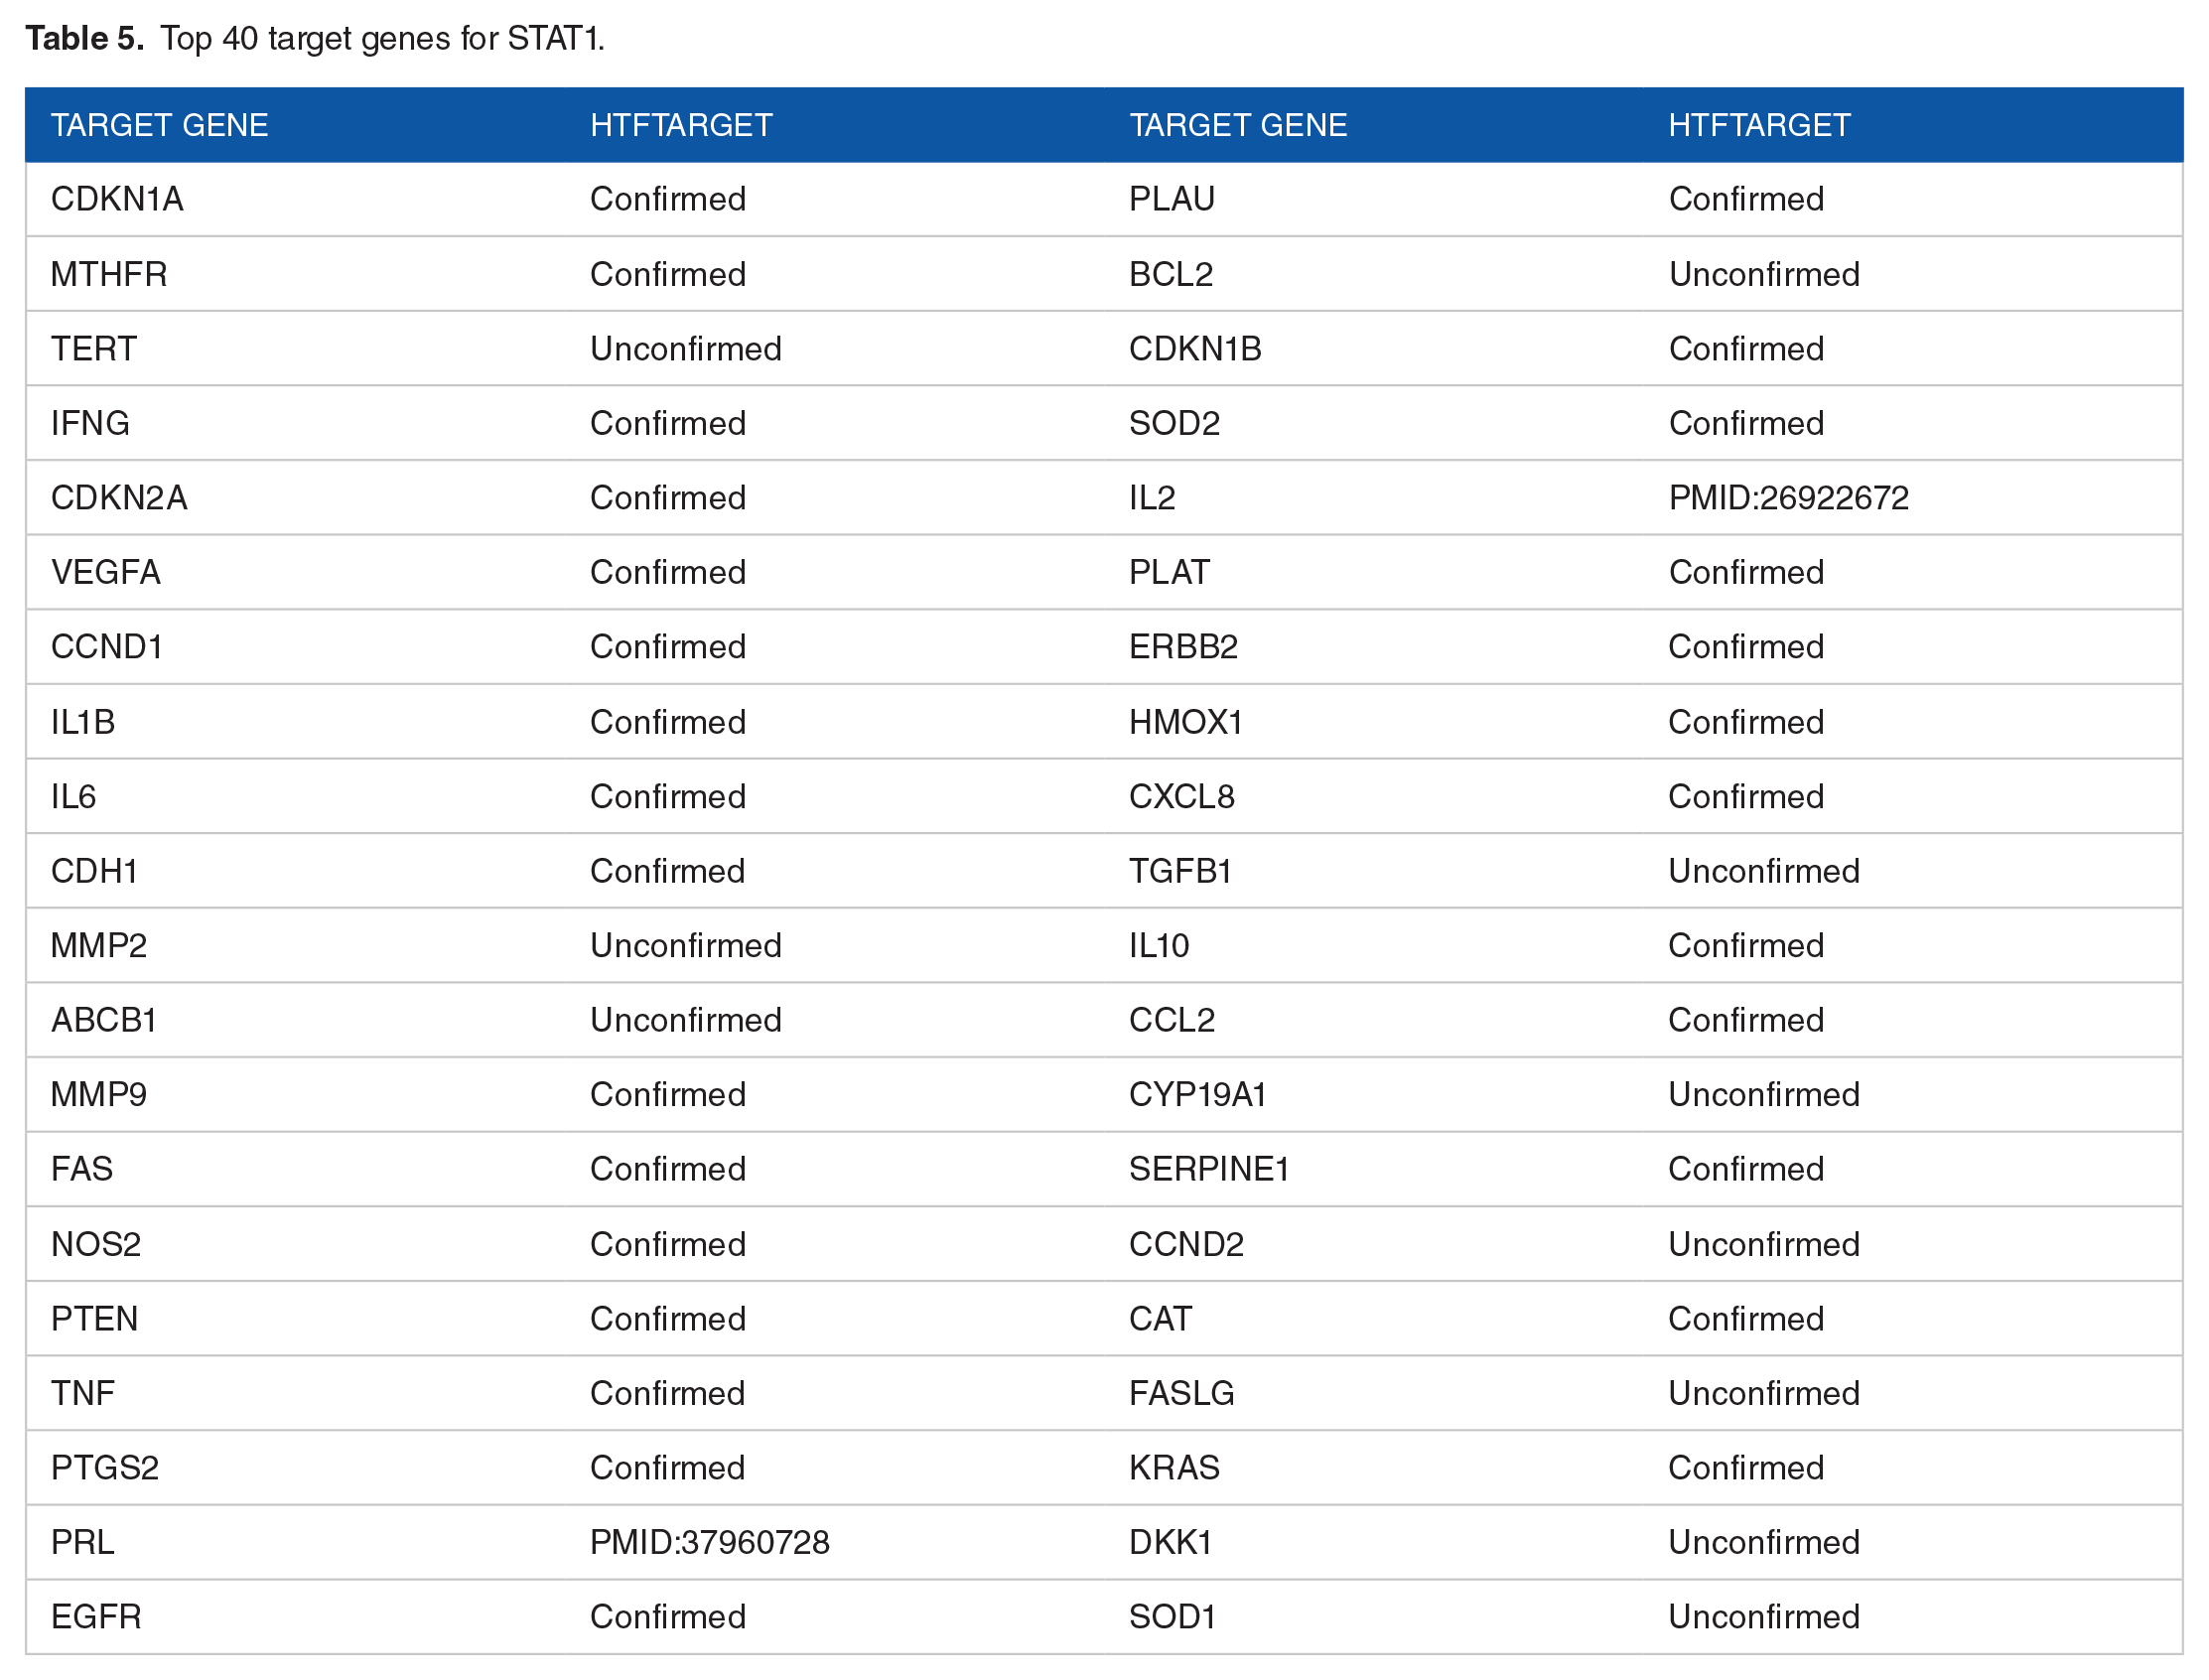
We ranked the predicted scores based on the weight matrix to identify potential target genes. Next, we validated the accuracy of these target genes by cross-referencing them with the hTFtarget database. 23 Specifically, we focused on examining and confirming the top 40 predicted target genes to ensure the reliability and accuracy of the prediction model. This process helps us affirm the model’s capability in identifying potential target genes associated with TFs.
The experimental results are presented in Tables 5 and 6 for STAT1 and STAT3, respectively. As shown in these tables, 70% (28/40) of the predicted target genes were validated against the hTFtarget dataset. In addition, we conducted further research and found that genes such as PRL and IL2, which were not listed as interacting with STAT1 in hTFtarget, have been reported to have associations with STAT1 in other studies, as indicated by the PMID24,25 numbers in Table 5. Similarly, genes such as ABCB1 and IL1B were found to be associated with STAT3, as indicated by the PMID26,27 numbers in Table 6. These results demonstrate the effectiveness of our proposed method.
Top 40 target genes for STAT1.
Top 40 target genes for STAT3.

The results in Table 6 indicate that STAT3 has a strong association with the target gene IL6, a cytokine that plays a crucial role in various physiological processes, including chronic inflammation and tumor development. This relationship has been validated in the hTFtarget database, underscoring the accuracy and efficiency of the enhanced negative sampling method in predicting critical links between TFs and target genes. In a practical example, breast cancer is the most common cancer among women, with metastasis being the leading cause of mortality. The IL6/JAK/STAT3 28 signaling pathway plays a central role in this process, where IL6 serves as a key cytokine that activates the pathway. Signaling through IL6 via STAT3 not only promotes cancer cell growth and invasiveness but also sustains a chronic inflammatory cycle that compromises the immune system’s ability to counter tumors. Our method successfully predicted the association between STAT3 and IL6, highlighting its capability to identify critical relationships. This provides a foundation for better understanding cancer metastasis mechanisms and developing targeted therapies against IL6 or STAT3, which are currently under evaluation in preclinical and clinical stages. Numerous studies have demonstrated that targeting the IL6/JAK/STAT3 signaling axis holds significant promise in inhibiting tumor progression and restoring immune function, offering new hope for breast cancer patients.
Discussion
Predicting interactions between TFs and target genes remains a significant challenge in gene regulation research. Negative sampling plays a critical role in determining the quality and effectiveness of prediction models. Current methods often fail to adequately optimize negative sampling, resulting in incomplete coverage of potential relationships. The enhanced negative sampling method we propose uses information from TF–disease and target gene–disease relationships to select high-quality negative samples, thereby improving the model’s predictive performance. Experimental results show that the enhanced negative sampling method outperforms other approaches, such as GraphTGI. Specifically, the model employing this method achieved nearly a 2% increase in AUC for transcriptional regulation prediction compared with the GraphTGI model. This highlights the significant effectiveness of incorporating improvements in negative sampling, making the model more accurate in identifying interactions between TFs and target genes.
Although promising results have been achieved, there are still several research directions to improve the effectiveness of this method in the future. Specifically, exploring optimization techniques for selecting high-quality negative samples could enhance the predictive accuracy of the model. In addition, establishing experimental validation pipelines to verify predictions is a crucial step to ensure the practical applicability of the model.
Conclusion
Predicting interactions between TFs and target genes remains a significant challenge, particularly when the complex relationships within GRNs are not fully understood. In this article, we introduce a novel method called Enhanced Negative Sampling, which selects reliable negative samples based on the relationships between TFs, diseases, and target genes. Our method has demonstrated superior effectiveness and accuracy compared with existing methods. Through evaluation and comparative analysis, we affirm the superiority of this method, providing an attractive option for predicting TF–target gene relationships. Results from case studies have confirmed the reliability and usefulness of the method in identifying links between TFs and target genes, opening up important prospects for future research and applications.
Footnotes
Acknowledgements
The authors thank Yu-An Huang et al. for generously sharing the source and dataset for this study.
Author Contributions
TTL contributed to investigation, data analysis, resource, validation, writing—original draft, writing—review and editing; XTD is a corresponding author involved in conceptualization, formal analysis, methodology, model building, supervision, writing–review and editing, and submitted Preprint to Bioinformatics and Biology Insights.
Declaration of conflicting interests:
The author(s) declared no potential conflicts of interest with respect to the research, authorship, and/or publication of this article.
Funding:
The author(s) received no financial support for the research, authorship, and/or publication of this article.