
Abstract
Compositionally biased regions (CBRs), ie, tracts that are dominated by a subset of residue types, are common features of eukaryotic proteins. These are often found bounded within or almost coterminous with intrinsically disordered or ‘natively unfolded’ parts. Here, it is investigated how the function of such intrinsically disordered compositionally biased regions (ID-CBRs) is directly linked to their compositional traits, focusing on the well-characterized yeast (Saccharomyces cerevisiae) proteome as a test case. The ID-CBRs that are clustered together using compositional distance are discovered to have clear functional linkages at various levels of diversity. The specific case of the Sup35p and Rnq1p proteins that underlie causally linked prion phenomena ([PSI+] and [RNQ+]) is highlighted. Their prion-forming ID-CBRs are typically clustered very close together indicating some compositional engendering for [RNQ+] seeding of [PSI+] prions. Delving further, ID-CBRs with distinct types of residue patterning such as ‘blocking’ or relative segregation of residues into homopeptides are found to have significant functional trends. Specific examples of such ID-CBR functional linkages that are discussed are: Q/N-rich ID-CBRs linked to transcriptional coactivation, S-rich to transcription-factor binding, R-rich to DNA-binding, S/E-rich to protein localization, and D-rich linked to chromatin remodelling. These data may be useful in informing experimental hypotheses for proteins containing such regions.
Introduction
Eukaryotic proteins often contain regions that demonstrate a compositional bias for a subset of the 20 amino acids. For example, the tract PSPEPPSESSPSPPSSTSPSTPPP is biased for proline (P) and serine (S). Such compositionally biased regions (CBRs) range from highly biased and repetitive to quite mildly skewed in residue usage.
Intrinsically disordered regions (IDRs) are stretches of protein chains that remain unfolded during part of the functioning.1,2 The IDRs are implicated in a variety of functional roles including kinase binding, transcription and translation regulation, histone binding, and chromatin remodelling.2,3 The sequences of IDRs often contain compositional bias, or ‘low-complexity’, a related concept.4,5 They are also enriched in short runs of amino acids, sometimes termed homopeptides.6,7 The CBRs involved in protein interaction networks can be enriched in short linear motifs, particularly rich in serine and proline. 8 Such CBRs can have also have residue patterning that may have functional significance such as residue dispersion, 9 repetitiveness, 10 in addition to homopeptide content. 6
Here, I formally define intrinsically disordered compositionally biased regions (ID-CBRs) – CBRs that are intrinsically disordered – and cluster them using compositional distance and measures of residue patterning, ie, the degree of bunching or ‘blockiness’ of residues along the ID-CBR sequences and the amount of homopeptides in them. Functional hypotheses are extracted that are linked to clusters with specific predominant compositional tendencies and types of residue patterning.
Methods
Proteome data
The proteome of budding yeast Saccharomyces cerevisiae strain 288c (UP000002311) was downloaded from UniProt in September 2023. 11
Protein families
The yeast proteome was clustered into protein families using an algorithm described previously that uses the BLASTP program.12,13 Briefly, similarities that accord to an e-value threshold (=1 × 10⁻⁴) and an alignment coverage threshold were tallied and sequences then sorted on decreasing number of similarities. This sorted list was searched to progressively add sequences to families and de-select them from further consideration. The 2 applied alignment coverage thresholds were 50% and 33%, but the former was used primarily (Supplemental File 1). These coverage thresholds were the percentage lengths of both sequences in a pair-wise similarity that need to be included in the respective aligned parts. These protein families were labelled with a numeric family index.
Compositional bias
The program fLPS was employed to annotate CBRs in yeast.14,15 The CBRs are labelled with a bias signature, which is the list of biasing residues sorted in decreasing order of contribution with the ‘primary bias’ first, and a P-value indicating the degree of compositional bias. 14 For any program that annotates CBRs or low-complexity regions, different parameter sets can be chosen that target regions of a certain length or degree of bias. 16 Degree of bias can be conceived as how much of the sequences are ‘covered’ by a parameter set. For example, parameters can be picked that target regions of, say, length = 15 residues and cover ~10% of the sequences. To detect trends that are independent of parameter choice, and also tendencies that only occur for shorter or for longer regions, a range of 12 parameter sets were applied (Table 1). These parameter sets are labelled according to the length and coverage that they target, eg, len = 50_cov = 10% is for a target length of 50 residues and a target proteome coverage of ~10%.
Parameter sets examined and totals of hypothetical GO enrichments/depletions for ID-CBRs for each parameter set.

Source: From Harrison. 16
To limit redundancy, lists of CBRs for any given parameter set were filtered to remove any with the same primary bias whose ends were ⩽10 residues from the ends of a CBR with a smaller P-value. Also, only 1 region of the same bias signature was selected for each sequence, to avoid overpopulating cluster trees.
Intrinsic disorder
Intrinsic disorder annotations for yeast were taken from the MobiDB database, namely, curated-disorder-merge (experimentally determined) and prediction-disorder-alphafold (algorithmic annotations). 17
Prions and prion-like regions
A list of amyloid-based prion-forming proteins in yeast was formed by updating a list analysed in a previous paper, with more recent examples18,19 (Supplemental Table 1). A list of intrinsically disordered prion proteins was obtained from the work of Chakrabortee et al 20 (Supplemental Table 1).
Regions with prion-like composition were identified with PLAAC. 21 The PDR score in PLAAC output was inspected (or the LLR score, failing no calculation of a PDR score). Two thresholds were considered: >0.0 or ⩾15.0, as before. 22
Structural features
Coiled coils were defined using DeepCoil. 23 Assignments across whole protein sequences to atom-record sequences of ASTRALSCOP protein domains (version 2.08) were made using BLASTP and e-value threshold 1 × 10−4.12,24
Nuclear localization signals
Nuclear localization signals (NLS) sequences for yeast were downloaded from the NLSdb database. 25 Only cases that were labelled ‘experimental’ or ‘by expert’ were extracted.
Definition of intrinsically disordered compositionally biased regions
An ID-CBR is a CBR that is likely intrinsically disordered. A CBR was labelled as an ID-CBR if >50% of it was annotated in any specific IDR, or it had an overall disorder propensity >0.0. The former is termed the overlap criterion, and the latter the propensity criterion. These regional disorder propensities were summed from individual amino-acid residue disorder propensities, which were given by log[fdis/fstruct], where fdis is the amino-acid frequency in a non-redundant set of experimentally determined IDRs taken from the DISPROT database, 26 and fstruct is the frequency in the 40% set of protein domain sequences from ASTRAL version 2.08, but using the atom-record sequences, to avoid inclusion of intrinsically disordered protein loops. 24 The DISPROT IDRs were made non-redundant by reducing to a set of cluster representatives arising from application of the protein-family clustering algorithm described above.
Furthermore, as prion-like regions are a subset of IDRs, prion propensities were considered in a similar way, but with a prion propensity scale derived from amino-acid frequencies in known prion-forming domains, compared with the overall frequencies in the yeast proteome (denoted Prprion). Also, >50% overlap with an annotated PLAAC prion-like region was used as a criterion.
Blockiness of intrinsically disordered compositionally biased regions
The distribution of residues along the expanse of an ID-CBR can vary quite substantially. One aspect is their degree of bunching or ‘blockiness’ (Figure 1). At one extreme, the most ‘blocky’, all of the residues are segregated from each other in decreasing (or increasing) order of frequency from one end of the sequence to the other. At intermediate levels of blockiness, there may be smaller ‘islands’ of different residues; whereas at the other extreme amino acids of a specific type try to be as distant as possible from their fellows (Figure 1). This is quite easy to conceptualize for 2 residue types (they alternate), but for many residue types, the solution is not trivial. A measure of such blockiness (B) was derived using the following formula:

where L is the length of the sequence being considered, and

Bmax is calculated from the maximally blocky arrangement depicted in Figure 1. To estimate Bmin, first residues of each type in decreasing order of frequency were filled into positions in a sequence of length L such that they were as far away as possible from any fellow residues of the same type. Then, the sequence was perturbed over 100 000 iterations by switching residues of different types and keeping any changes that lead to a lower Bmin estimate (Figure 1). RB is examined on log-log scatter plots vs region length. Linear regression lines are fitted and where they have significant correlation (P < .01), the deviation D(RB) from the linear regression line is used as an indicator of blockiness (negative for less blocky or not blocky, positive for more blocky). These deviations are used to divide data into tertiles with high (H), intermediate (I), or low (L) blockiness.

Method for calculating blockiness of ID-CBRs. The blockiness ratio (RB) is derived from the blockiness (B) of the ID-CBR sequence and from Bmax and Bmin as depicted. A plot of log(RB) vs log(region length) is drawn for a parameter set for an amino-acid primary bias. Here, it would be for the yellow residues. Then, deviations from the linear regression line, D(RB), are used to characterize the blockiness of the ID-CBR.
Homopeptide content
As before, homopeptides were defined as runs of amino acids with a minimum count of 3 residues. 6 The proportion of residues in homopeptides (denoted hpep) was calculated for each ID-CBR. Specific data sets are separated into tertiles with high, intermediate, or low homopeptide content.
Clustering of intrinsically disordered compositionally biased regions using compositional distance
Compositional distance (Dcomp) was used to characterize the differences in amino-acid usage across ID-CBR populations. Dcomp is given by:
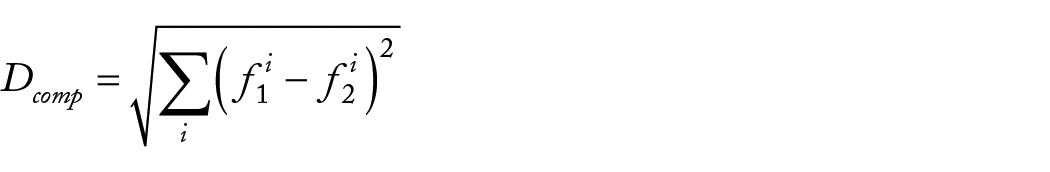
The summation is over all 20 amino-acid types i, for comparing ID-CBRs 1 and 2. All-to-all comparison of each ID-CBR population arising from an fLPS parameter set was performed. This yielded for each population a distance matrix. This distance matrix was fed into the neighbour program from the PHYLIP package (version 3.695), 27 to make a neighbour-joining (NJ) tree in Newick format, 28 out of which an exhaustive list of clusters and cluster members was extracted iteratively. This was achieved by at first searching for clustered pairs, and then expanding outwards from these pairs to define further larger clusters. This NJ analysis is not to infer evolutionary descent, but simply to extract clusters of ID-CBRs that are compositionally similar. The number of ID-CBRs in these trees ranges from 932 to 25 125.
The ID-CBR clusters were labelled with the most common bias occurring among the cluster members, and this was termed a consensus bias signature. This was set equal to the most common residue type at each position in the set of bias signatures, if the frequency of this is ⩾50% (if this frequency is <50% for the first position, the consensus is simply ‘X’). Contributions to the consensus from beyond the first position are included progressively if similarly they are included in ⩾50% of sequences.
Intrinsically disordered compositionally biased region cluster drawing
The illustrative example tree was drawn in Evolview. 29 ID-CBRs are named: UniProtAccession_Start_End_BiasSignature. They were also labelled with numeric protein-family indices, where appropriate.
Gene Ontology data
Gene Ontology (GO) term annotations for the yeast proteome were downloaded from geneontology.org in December 2023. 30 Also obtained was the complete GO digraph (file go-basic.obo). This was parsed recursively into a list of over terms for each lower term, an over-term being any term above a lower term in the digraph and connected to it.
Generation of hypothetical functional associations
Significant enrichments and depletions of GO terms were calculated for each ID-CBR cluster using hypergeometric probability and a Bonferroni correction, with the P-value threshold for significance being divided by the total number of GO terms in the yeast annotation file for protein-family representatives. Duplicated term annotations for the same protein sequence were not counted. Where the count of terms for an ID-CBR cluster was zero, a normal approximation to the hypergeometric distribution was applied, with an equivalent z-score threshold. Statistics were calculated for the proteome clustered into protein families using the protein-family clustering algorithm described above and the 50% coverage criterion.
The ID-CBR clusters overlap and have much common membership. So, to derive a list of distinct significant hypothetical enrichments/depletions (abbreviated ED), the principle of parsimony was applied, ie, the most concise explanation for the landscape of GO EDs was sought. In doing this, enrichments are only compared with other enrichments, and depletions to other depletions.
First, for each lower ID-CBR cluster, lists of over-clusters were generated, where an over-cluster is any cluster containing a smaller cluster. These over-cluster lists were then progressively searched for larger clusters that yield a smaller significant P-value for a specific GO ED, and on finding such a cluster, the GO ED for the smaller cluster was de-selected, or vice versa if the smaller cluster P-value was smaller (this is illustrated schematically in Figure 2).
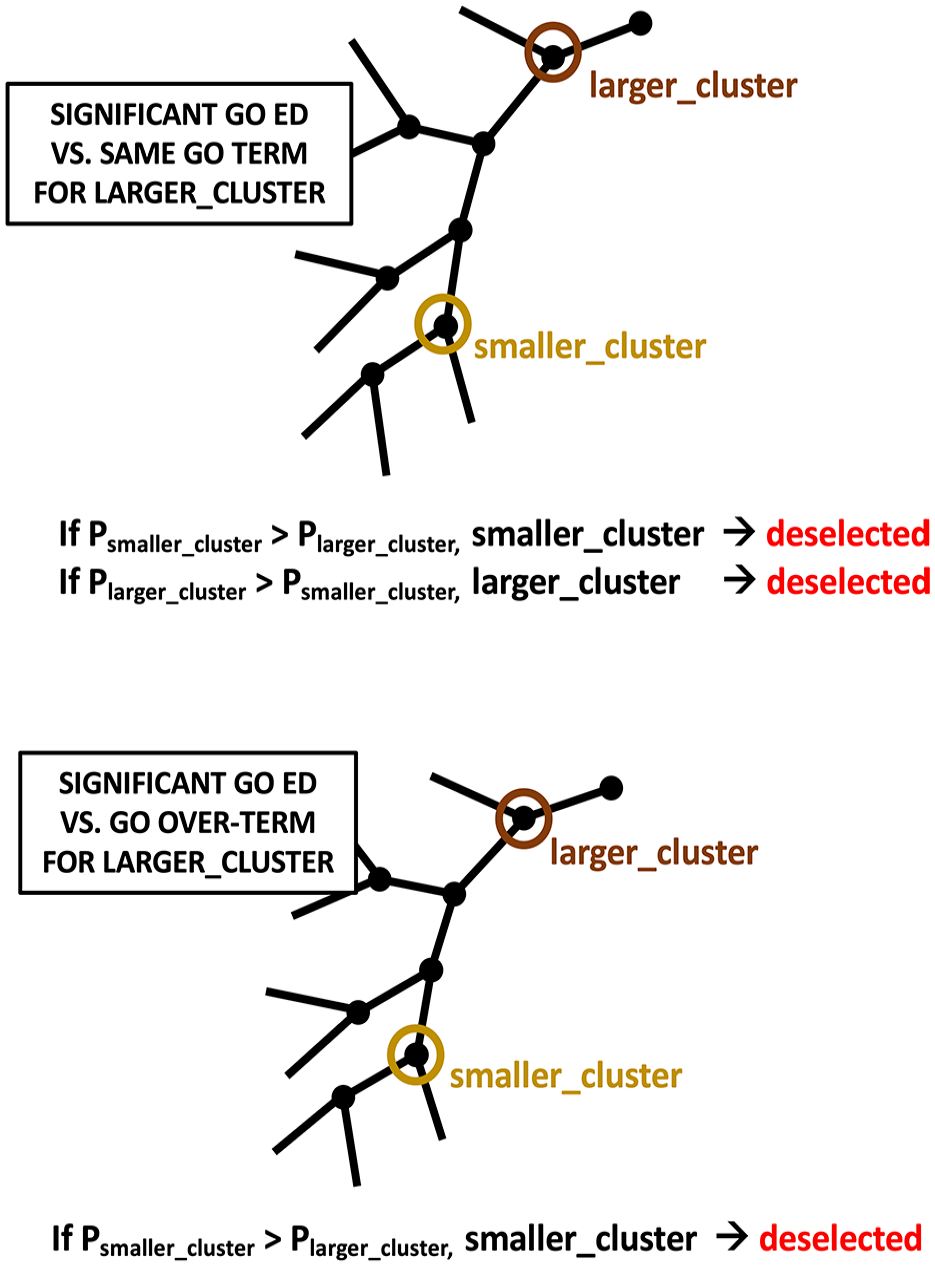
Parsimonious reduction to a list of distinct GO enrichments and depletions. The list of significant EDs is reduced parsimoniously using the criteria illustrated. The upper panel indicates the case where, if there are 2 clusters, 1 smaller and 1 larger that encompass it, and they both have an ED for the same GO term, either is de-selected for the ED if the other has a smaller P-value. The lower panel shows the scenario where a smaller cluster has a significant GO ED, but a larger cluster has a significant ED for a GO over-term relative to it. In this situation, the smaller cluster is de-selected for this GO ED.
Second, for any specific GO ED, lists of GO over-terms in the same cluster or an over-cluster that have a smaller significant P-value were searched for, and on finding them, the initial GO ED under examination was also de-selected (Figure 2).
The GO associations were derived for hpep and D(RB) tertiles in the same manner, except they were only processed with the latter criterion considering GO over-terms.
Results and Discussion
Definition of intrinsically disordered compositionally biased regions
Compositionally biased regions were labelled in the proteome of baker’s yeast S cerevisiae, using the program fLPS. 15 Different parameters annotate regions of shorter or longer CBR target length or cover more of less of the yeast proteome (ie, the regions can be less or more biased). A diverse panel of parameter sets that target varying region lengths and proteome coverage were applied (Table 1). For example, for the fLPS parameters m = 12, M = 16, t = 5.4e−06, the median target length of CBRs is 20 and the estimated proteome coverage is ~5% (denoted ‘len = 20_cov = 5%’).
Intrinsically disordered compositionally biased regions were defined as regions that are compositionally biased and demonstrate a propensity for intrinsic disorder. For all the produced data sets, ID-CBRs were identified using 2 criteria, the overlap and propensity criteria as described in section ‘Methods’. There is substantial convergence between these criteria for ID-CBRs. Figure 3 presents an analysis of this for the parameter sets for 10% coverage. Here, we can see that typically >90% of cases found by 1 criterion are also found by the other (Figure 3A). An example of a plot of percentage IDR overlap vs disorder for the len = 100_cov = 10% parameter set illustrates this convergence (Figure 3B).

Convergence of the propensity and overlap criteria for ID-CBRs. (A) A tabulation of the percentages of ID-CBRs found by 1 criterion that are found by the other, for the parameter sets that yield 10% proteome coverage. (B) An example of a plot of ID-CBR disorder propensity vs disorder overlap for the len = 100_cov = 10% parameter set.
In general, there is little contribution to ID-CBRs from structured protein domains or coiled coils (Table 2). Only 0.2% to 2.2% of ID-CBR residues are covered with a structured protein domain match, and only 0.1% to 0.8% are labelled with a coiled coil by the DEEPCOIL algorithm. 23
The percentage occurrence of ASTRAL protein domain matches and coiled-coil annotations in the ID-CBRs.
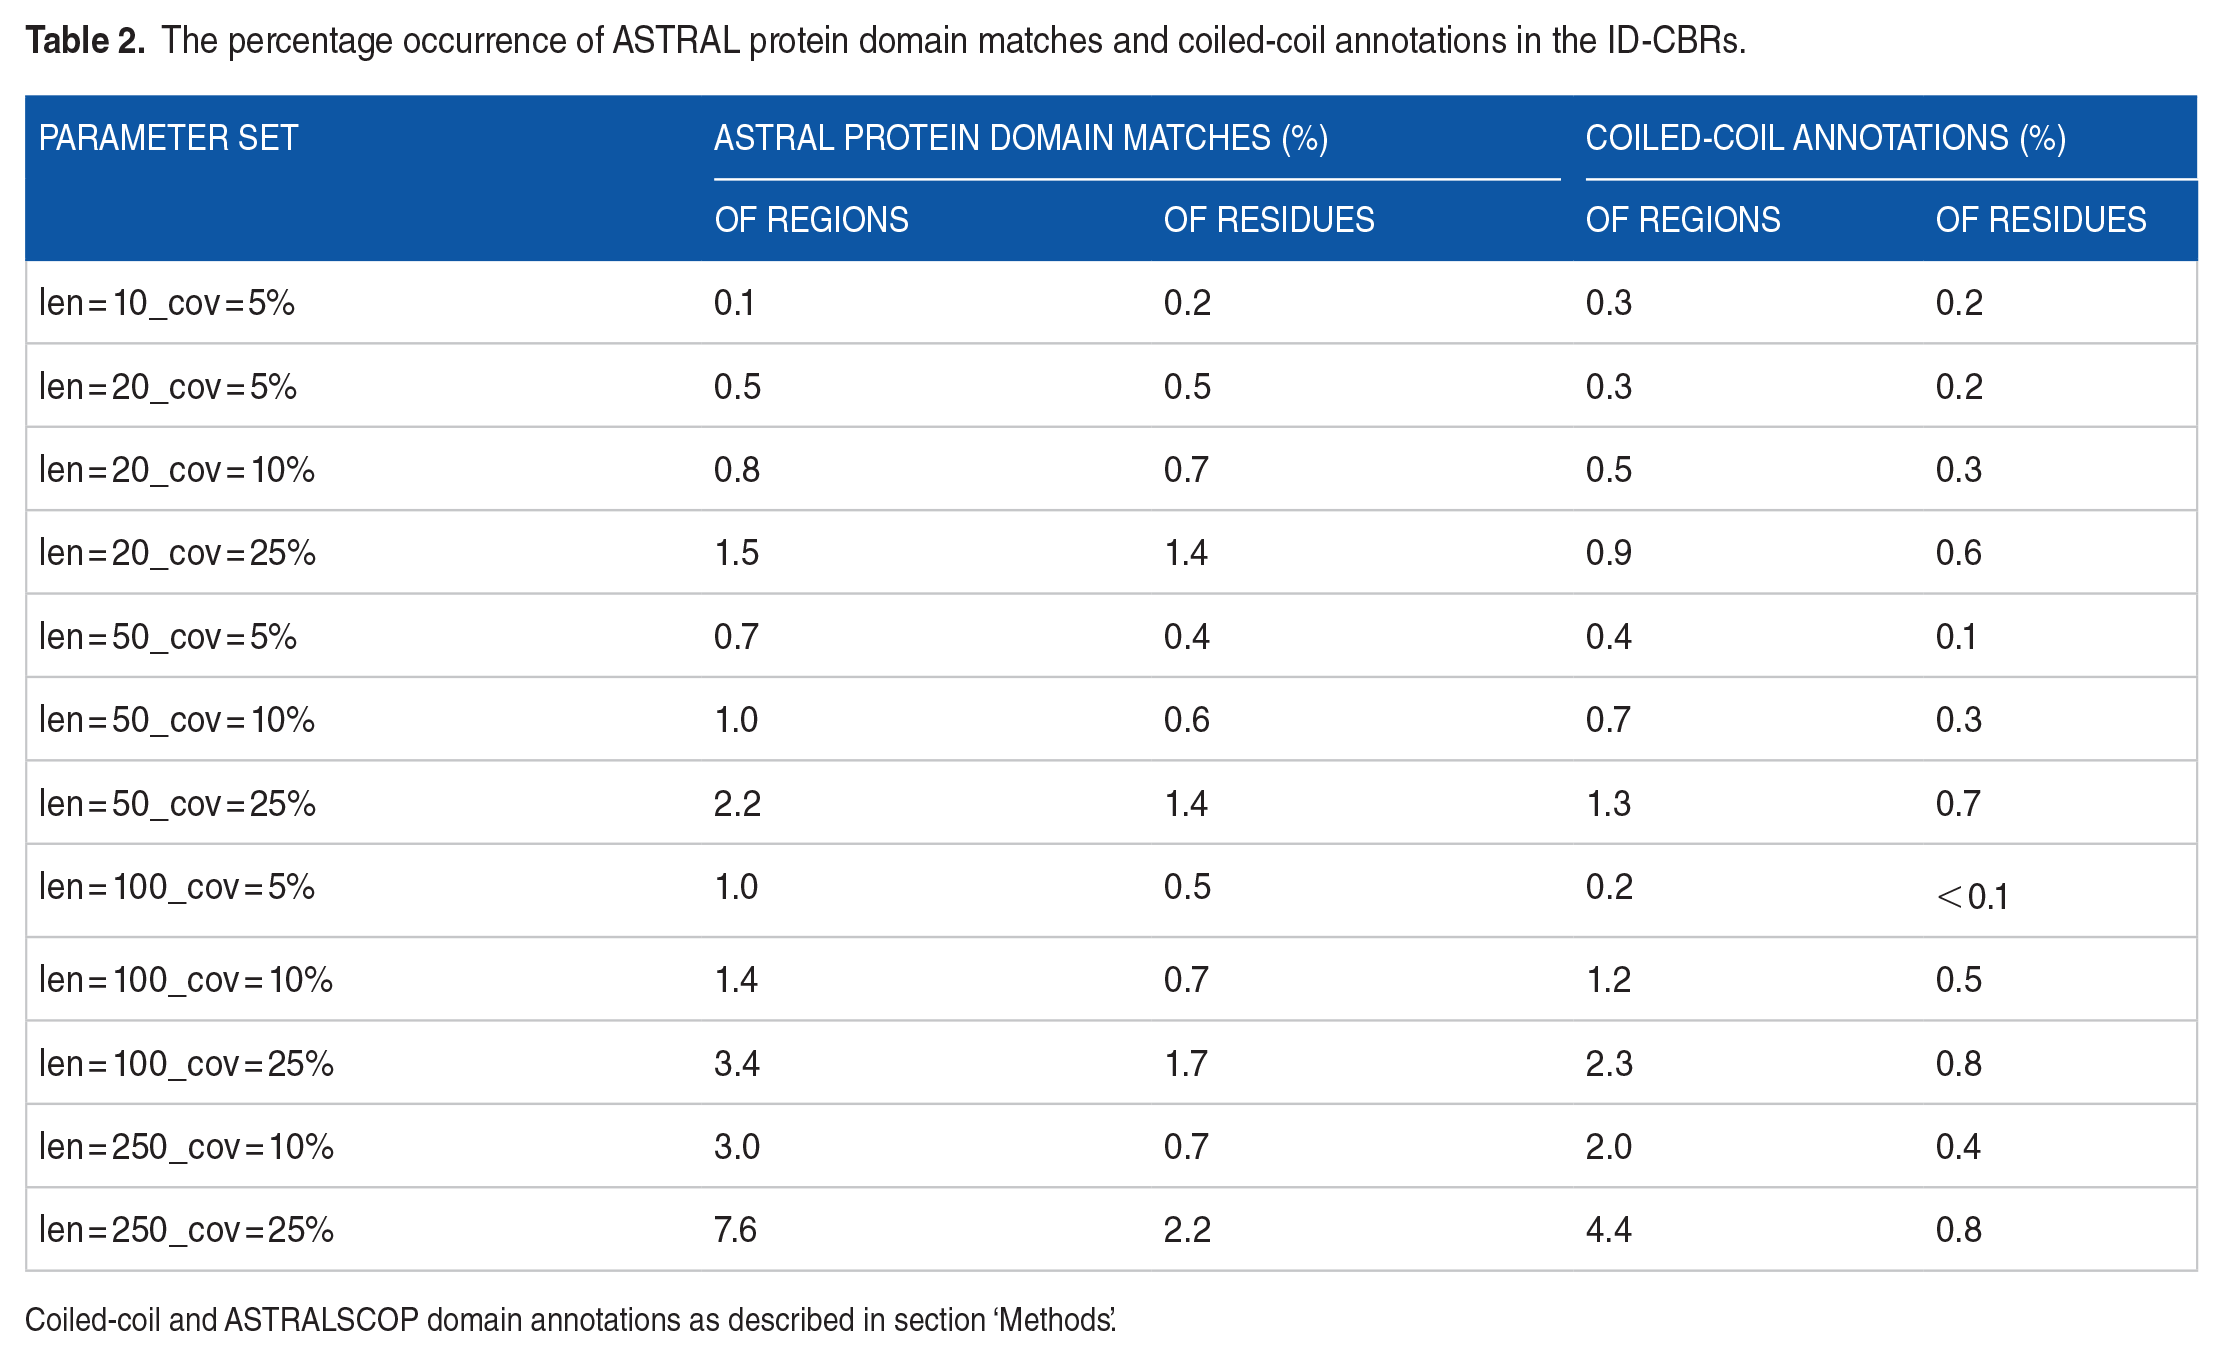
Coiled-coil and ASTRALSCOP domain annotations as described in section ‘Methods’.
Intrinsically disordered compositionally biased regions prevalences
Some ID-CBR types are prevalent regardless of the parameter sets used (Figure 4). In particular, {S}-rich ID-CBRs are always ranked first, with the related signatures {SN}, {ST}, {SP}, and {SK} in the top 20 (Figure 4). {N}-rich and {Q}-rich are the next most prevalent. Such biases are linked to the prion phenomenon in budding yeast, and a large population of N-rich ID-CBRs accumulated during the evolution of the Saccharomycetes class. 31 These prevalences tally with the general trends across Saccharomycetes for homopeptide frequency. 6 However, some regions are only prevalent for low target length or high proteome coverage, eg, {K}-rich regions, and some only gain prominence at higher proteome coverage (ie, they are more mildly biased), such as the {Y}-rich, {F}-rich, and {G}-rich regions that move into view (Figure 4B). Also, multiple-residue biases become more numerous when longer ID-CBRs are probed (Figure 4C).

Prevalences of different bias signatures for ID-CBRs. (A) The prevalence of ID-CBR bias signatures across all 12 parameter sets was calculated using a mean rank, where the most prevalent is given rank 1, and so on. The colour key for this whole figure is to the right, and it is the same as used in the example tree figure (Supplemental Figure 2). (B) The parameter sets for a low target length = 20 residues, but with increasing proteome coverage down the page. (C) Similarly to (B), but for a higher target length of 100 residues.
Blockiness and homopeptide content
The patterning of residues within an ID-CBR may also have functional importance. One type of patterning is blockiness, where residues of the same type clump together more along the sequence. A measure of blockiness RB was derived as described in section ‘Methods’ (Figure 1). It was found to be most informative to plot RB vs region length on a log-log plot and extract the deviation from the regression line D(RB) as a relative measure of blockiness for a population of ID-CBRs with the same primary bias (Figure 1). Triads of sequences with roughly the same region length and low, intermediate, or high blockiness have been picked out for 2 example populations (Figure 5). In Figure 5A, one can see that sequences with lower relative blockiness can still have a lot of shorter homopeptides in them. In Figure 5B, the examples are the special case of regions that have bias for both E and K. For the lowest blockiness example, the Es and Ks are dispersed quite evenly along the sequence. Another measure of residue patterning studied here is the proportion of homopeptides (denoted hpep), where homopeptides are runs of ⩾3 residues. In general, D(RB) only has a shallow correlation with hpep (R 2 values < 0.05) (examples for serine-rich ID-CBRs are displayed in Supplemental Figure 1).

Examples of the blockiness calculation. (A) Log10(RB) vs Log10(region length) for ID-CBRs for the len = 100_cov = 5% parameter set and a primary bias of S (serine). Examples of higher, intermediate, and lower blockiness are picked out. (B) As in (A), except for the special category of K/E-rich (ID-CBRs that are rich in both lysine and glutamate), and the len = 100_cov = 25% parameter set (ie, for detection of longer ID-CBRs with more mild bias).
Intrinsically disordered compositionally biased region clustering
The ID-CBR data sets arising for any one parameter set were clustered using compositional-distance matrices fed into the NJ algorithm. 28 An example of this clustering is displayed in Supplemental Figure 2, for annotations with target length 100 residues and coverage 5% (ie, highly biased). Here, ID-CBRs coloured according to their primary biasing residues can be observed coalescing into larger clusters. Of particular note are the following: a large cluster of primarily Q-rich or N-rich regions, almost all of which are also labelled as prion-like in composition, or prion-forming; populations of SN-rich and ST-rich regions, and a charged group that bifurcates between mostly E-rich and most K-rich.
To representatively probe the detail of these clusterings, the positioning of the Sup35 protein was examined (UniProt accession P05453, Figure 6). The Sup35 protein functions in translation termination and stop codon recognition and contains a {QYNG}-rich prion-forming domain that underlies the [PSI+] prion phenomenon.32,33 It also contains a {KE}-rich central M domain that mediates pH sensing during reversible condensate formation in response to stress.34,35 Rnq1 (UniProt P25367) is a prion protein that underlies the [RNQ+] prion phenomenon, which is required in yeast cells for the natural occurrence of the [PSI+] prion.36-38 In Figure 6 (lower left), one can see that a region containing its prion-forming domain clusters pairwise with part of the Sup35 prion-forming domain, indicating that its [PSI+] seeding function may be in part compositionally engendered. Two other prion-forming domains cluster close by, one in Ngr1, a negative-growth regulatory protein, and the other in Pgd1, a mediator of RNA pol II transcription subunit 3. Indeed, for parameter sets targeting 5% coverage (ie, for detecting highly biased regions), this close clustering of Rnq1 and Sup35 is the general result (median cluster size = 3, Table 3). Across the upper half of the figure, we progressively zoom into the locale of the Sup35 M domain in the clustering tree, where we find it together with other {KE}/{EK}-rich ID-CBRs, and paired most closely with a {KE}-rich region in Zeo1, which is an antagonist in signalling cell-wall stress to the PKC1-MPK1 cell integrity pathway (Figure 6).

ID-CBR clusters involving the Sup35 prion protein. The illustrative clustering supplied in Supplemental Figure 2 is examined with zoom-ins to the locales of the Sup35 {KE}-rich M domain and the {QYNG}-rich prion-forming domain. The colour-coding is described in the Supplemental Figure legend. The tree is made with parameters for target length = 100 residues and proteome coverage of ~5%. ID-CBRs are named: UniProtAccession_Start_End_BiasSignature. A large cluster of predominantly E-biased or K-biased regions is zoomed into (upper left), then a further zoom-in reveals the locale of the Sup35 M domain. The ID-CBR sequences are displayed below this, coloured in concert. Also, a zoom-in to a cluster containing a Sup35 prion-forming ID-CBR is presented along with the sequences of the Sup35 ID-CBR and 3 other prion-forming ID-CBRs within the cluster. Labels that indicate the presence of prion or prion-like domains in the respective protein sequences are also arrayed in an outer rim (see Supplemental Figure legend for details). Numeric protein-family indices are displayed where relevant. The depicted sequences are also labelled with their bias signatures and their D(RB) and hpep tertiles.
Smallest clusters in cluster trees containing both Sup35 and Rnq1.

The results for 5% coverage (ie, highly biased) are in bold.
Hypothetical Gene Ontology functional cluster associations
The informativeness of this compositional-distance clustering was further probed by generating sets of functional hypotheses using GO. 30 Significant GO associations were filtered for redundancy and for protein-family sequence homology as described in section ‘Methods’. Hundreds of GO EDs are detected, with depletions being about ~20% the amounts of enrichments (Table 1). Each calculated GO ED is a hypothesis about the functional importance of clusters. The number of parameter sets that a GO ED occurs in is used as an indicator of parameter independence. Also, more regions that are more distant compositionally are pulled in the larger the cluster is; the more parameter sets that a cluster is found by, more, mildly biased regions are pulled into the hypothesis. Furthermore, significant ED may occur for just, say, low proteome coverage, or long target length parameter sets.
As an illustrative example, the significant GO EDs that occur in most parameter sets for the Sup35 protein have been arrayed in Table 4, for both its {KE}-rich M domain and its {QYNG}-rich prion-forming domain. The most striking trend for the E/K-rich clusters is the predominant association with the nucleolus, and with other categories linked to nucleolar functions and compartments, although these are not specifically annotated for Sup35. Itself, it is part of a more general association of E/K-rich ID-CBRs with nucleotide binding. The Sup35 Q-rich ID-CBR is part of a clear association with cytoplasmic stress granules along with up to 28 other Q/N-rich cases, an association which does not occur for the E/K-rich regions, which is interesting considering the role of the M domain in phase separation.34,35
Most prominent hypothetical GO enrichments for compositional-distance clusters containing the Sup35 M domain or prion-forming domain ID-CBRs.

The terms associated with Sup35 are in bold.
Further categories in the top 20 associated with nucleolar function and compartments include (no. parameter sets in brackets): GO:0006364 rRNA processing (9); GO:0000466 maturation of 5.8S rRNA from tricistronic rRNA transcript (8); GO:0000463 maturation of LSU-rRNA from tricistronic rRNA transcript (8); GO:0030686 90S preribosome (7); GO:0000462 maturation of SSU-rRNA from tricistronic rRNA transcript (5); GO:0000480 endonucleolytic cleavage in 5’-ETS of tricistronic rRNA transcript (4); GO:0000472 endonucleolytic cleavage to generate mature 5’-end of SSU-rRNA (4).
Further categories in the top 20 associated with transcription include (# parameter sets in brackets): GO:0006357 regulation of transcription by RNA polymerase II (8); GO:0003677 DNA binding (7); GO:0001228 DNA-binding transcription activator activity, RNA polymerase II-specific (7); GO:0000981 DNA-binding transcription-factor activity, RNA polymerase II-specific (7); and GO:0000122 negative regulation of transcription by RNA polymerase II (6).
Parameter sets (len = 20_cov = 25%, len = 20_cov = 10%, len = 50_cov = 10%, len = 50_cov = 25%).
Parameter sets (len = 10_cov = 5%, len = 100_cov = 10%, len = 20_cov = 10%, len = 20_cov = 25%).
Three specific examples of compositional-distance clusters with clear hypothetical functional associations were picked to examine in further detail (Figure 7). An {AQ}-rich region with low blockiness is linked to transcription coactivator activity and to a general category of transcriptional regulation (Figure 7A), thus providing functional hypotheses for other clustered but un-annotated cases. In Cyc8, length variation of this region has been shown to cause concerted upregulation or downregulation of expression in >150 genes, and transcription-factor binding site analysis further suggests that this is due to Cyc8’s role as a coactivator. 39 The {AQ}-rich ID-CBR in GTS1 was shown to be part of a tract that suppresses polyglutamine toxicity of other proteins, 40 implying a dual function for such tracts. The second example (Figure 7B) is an {AK}/{KA}-rich region that overlaps IDRs in proteins associated with tRNA aminoacylation. Arc1p is a protein that binds tRNA and forms the AME complex with methionyl-tRNA and glutamyl-tRNA synthetases and functions in tRNA delivery.41,42 A long {KA}-rich region in Arc1p is part of a central IDR region whose character (ie, lysine content) indicates it may feature in RNA binding. 43 The third example is a set of {SE}-rich ID-CBRs, 4 of which are linked by GO to regulation of protein localization (Figure 7C), such as SPA2, which is a polarisome subunit linked to actin cytoskeletal organization, establishment of cell polarity, apical bud growth, and regulation of mating projection growth initiation and termination.44,45 The function of this region has yet to be discerned. Of the other cases, BNI1 is also a polarisome component, and ZDS1 and ZDS2 are involved in establishment of cell polarity (Figure 7C).
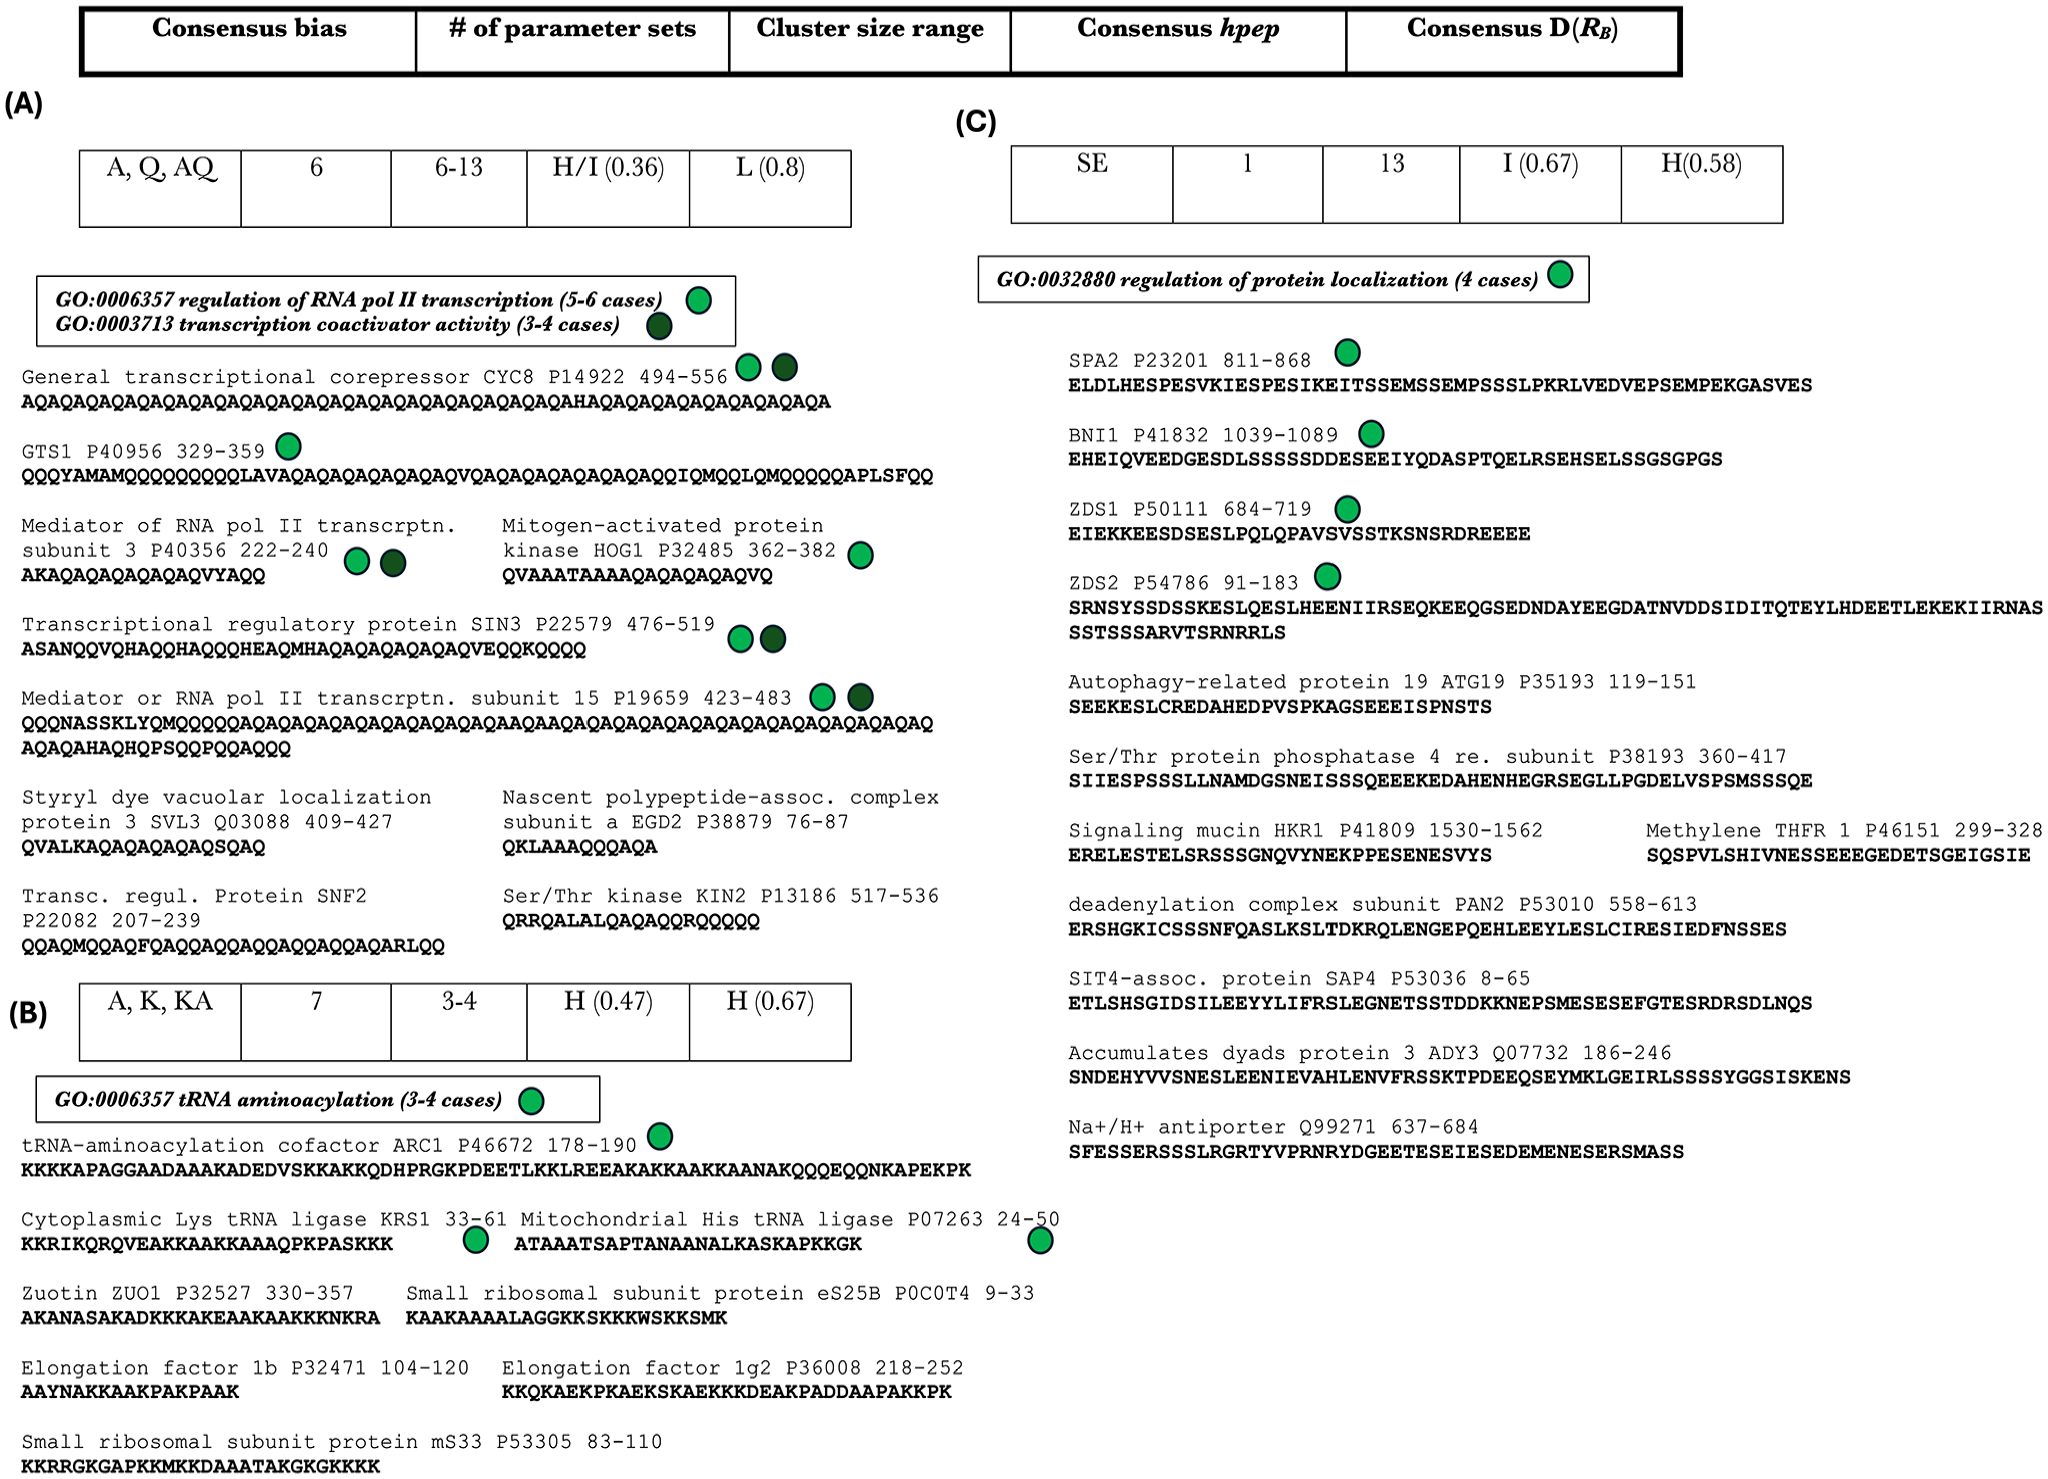
Three examples of ID-CBRs clustered by compositional distance. Along the top is the key for the 1-row tables at the top of each figure panel. The consensus bias is the predominant bias for the cluster for any parameter set. Also tabulated are the number of parameter sets that designate this cluster, the cluster size range across parameter sets, and the predominant tertiles for hpep and D(RB) for the cluster, ie, H for high, I for intermediate, and L for low (with the proportion in these tertiles in brackets). Gene Ontology associations significant at < Bonferroni-corrected P-value threshold of 1.1e−05 are listed, with the number of cases for each association in brackets. The identity of these cases is colour-coded with dots. The longest ID-CBR sequences for each case are shown.
Larger clusters of regions containing hundreds of cases may also be functionally informative. A rather large cluster of 138 R-rich regions significantly associated with nuclear localization was noted at 25% proteome coverage (ie, they are often mildly biased) and shorter target lengths (Supplemental File 2). To check whether these regions arise from possible NLSs (which can have some R bias) or from DNA-binding (as arginine features in DNA-binding mechanisms 46 ), they were cross-referenced with the 104 known NLSs in the NLSdb database. 25 Only 11 of the 104 NLSs associate with an R-rich tract, with a further 30 associated with a K-rich tract and 26 being embedded in regions with a different compositional bias (eg, the short NLSs in large ribosomal subunit protein uL15 P02406 are encompassed by an {HG}-rich ID-CBR). Furthermore, when the larger number of R-rich tracts that are also associated with DNA/nucleic-acid binding is accounted for, the nuclear association for these R-rich tracts is no longer significant, indicating that it likely comes primarily from features for such binding. Similarly, for a much larger cluster of >900 cases of short K-rich regions found at 25% coverage, the significant association with nuclear localization disappears when the larger number of cases associated with DNA/nucleic-acid binding is accounted for.
Tertiles of blockiness and homopeptide content and their functional hypotheses
The ID-CBRs with the same primary bias were portioned into tertiles for both hpep and D(RB) values (H, high; I, intermediate; L, low). Functional hypotheses for these tertiles were then examined. First for these tertiles, I continued the theme of examining E/K and Q/N biases that were first picked out in relation to the Sup35p example (Table 5). Notable E/K-rich examples in this table are high hpep and D(RB) ID-CBRs associated with the nucleolus (examples are depicted in Supplemental Figure 3C), and low D(RB) ones linked to the spindle pole body. In a recent review, such nucleolar regions are specifically described as associated with the fibrillar centre and dense fibrillar component within nucleoli. 47 There are 2 distinct types of Q/N-rich ID-CBRs; those associated with transcription coactivator activity have high hpep and high D(RB), whereas those linked to kinase activity tend towards intermediate hpep and low D(RB) (Table 5, examples are depicted in Supplemental Figure 3A and B). Indeed, experimental work on modifying the length of Q/N homopeptide tracts in transcription factors and coactivators has indicated that they can tune or modulate their proteins’ regulatory roles. 39
Gene Ontology enrichments for tertiles of blockiness and homopeptide content for E/K-rich regions and Q-or-N-rich regions.

Enrichments that occur for multiple parameter sets are listed up to a maximum of the top 5, including ties.
The count of tertiles, ie, high (H), intermediate (I), or low (L) for hpep and for D(RB).
The range of region counts for different parameter sets. The upper bounds arise when more mildly biased regions are included (through application of parameter sets with higher proteome coverage).
Enrichments that occur for both a hpep and D(RB) tertiles are in bold.
The most prominent functional hypotheses across all tertiles and parameter sets are arrayed in Supplemental Table 2. One can see that in general, low blockiness and high hpep content are favoured among these GO EDs, although these lists overlap rarely (just 3 cases), and 26 cases show both a hpep trend and a blockiness trend. For example, a population of up to 36S-rich ID-CBRs with low hpep and intermediate blockiness is linked to DNA-binding transcription-factor activity, including a tract of SFL1, an activator involved in control of flocculation, stress response and pseudohyphal growth, 48 and VHL1, which is required for induction of vitamin H and biotin-intermediate transporters 49 (Figure 8A). A group of up to 18 cases of D-rich ID-CBRs feature a chromatin remodelling linkage (Figure 8B), including the transcription-factor Autonomously-Replicating Sequence binding factor 1, and RAD26, which is involved in transcription-coupled repair of nucleotide excisions. In general, D-rich regions may facilitate and accelerate DNA binding, especially at cytosine-rich sites.50,51
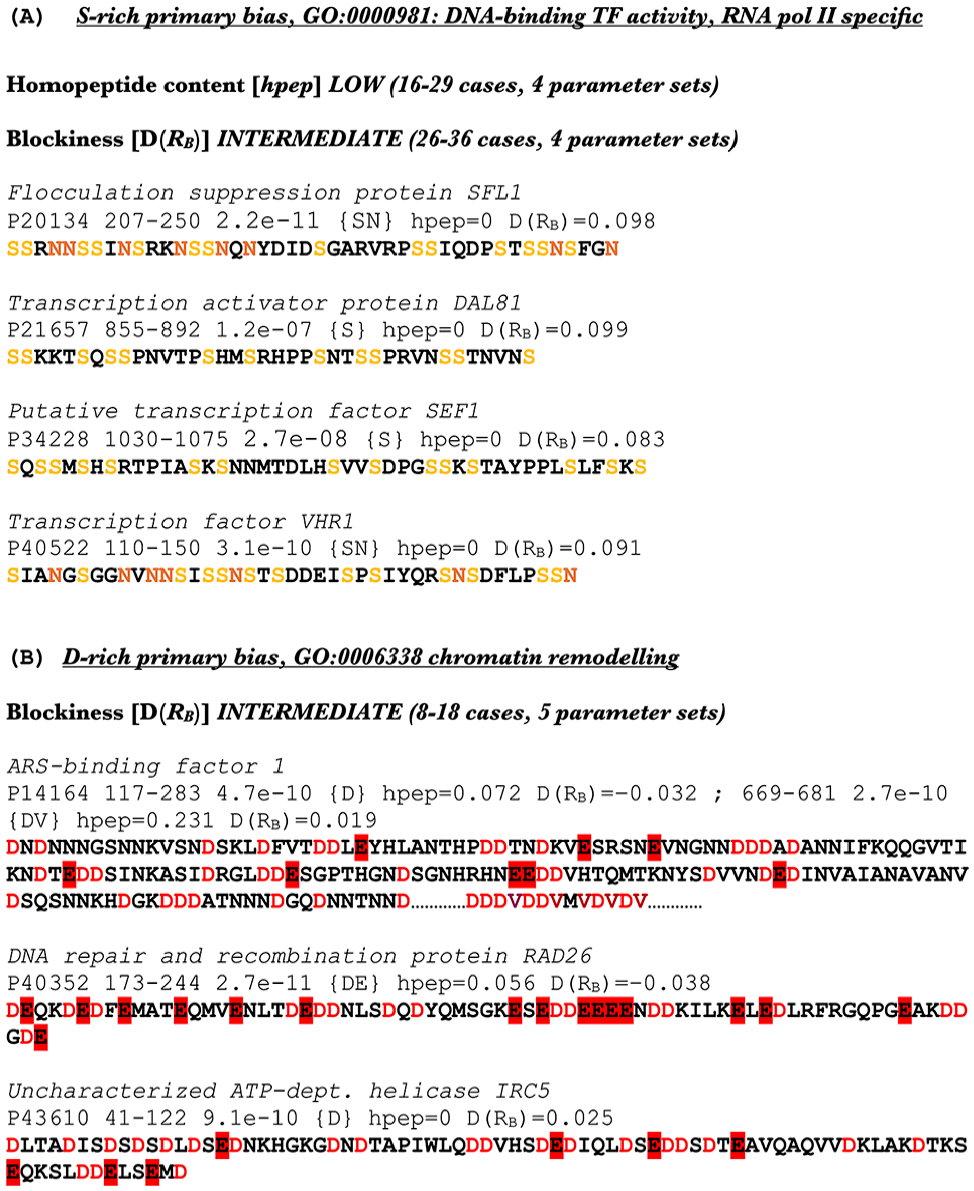
Examples of significant Gene Ontology associations for tertiles of homopeptide content (hpep) and blockiness [D(RB)]. Residues are colour-coded as in other figures. Gene Ontology associations significant at < Bonferroni-corrected P-value threshold of 1.1e−05 are listed, with the number of cases for each association in brackets. Each ID-CBR is colour-coded with the coding applied also in previous figures. Listed for each ID-CBR are: the UniProt accession, the range (start to end), the binomial bias P-value, the bias signature in curly brackets, and the hpep and D(RB) values. The longest regions for each protein for each tendency are picked to display. (A) RNA polymerase II-specific transcription-factor (TF) activity is a significant association for serine-rich ID-CBRs with low homopeptide content and intermediate blockiness. (B) Chromatin remodelling is a significant functional hypothesis for aspartate-rich ID-CBRs with intermediate blockiness. Glutamate residues are also pointed out with red highlighting.
Data
In addition to the raw data for ID-CBRs used to define and analyse them in this article, further characteristics have been added to the Supplementary Files, such as the normalized Kyte-Doolittle Hydropathy and ‘middleness’ scales that were generated for a previous study,13,52 and proportions of groups of residues based on the Taylor Venn diagram of amino acids (eg, ‘tiny polar, ‘charged’, ‘aromatic’) 53 (Supplemental File 3). This information can be cross-referenced with the lists of ID-CBR cluster membership (Supplemental File 4) and of GO E/Ds (Supplemental File 2).
Conclusions
Here, intrinsically disordered compositionally biased regions (ID-CBRs) were formally defined, using 2 different criteria that were largely congruent. It was discovered that ID-CBRs can be formed into clusters using compositional-distance and residue patterning (ie, ‘blockiness’ and homopeptide content), and these clusters can have significant functional associations. In doing so, redundancies were taken account of, such as from the sequence homology of protein-family members, and from similar GO functional terms. The function of CBRs has been generally un-appreciated or under-appreciated in cell biological experiments, constructs, and hypotheses, so these data may be helpful in that regard. The chief advantage of the approach described here is that it mitigates against any parameter dependence in annotating and analysing compositional biases. However, this also means that in many cases, the relevant region boundaries can be ambiguous, and there are multiple solutions to defining the CBRs, so that several protein constructs may be necessary to investigate the relative functional importance of CBR features in cell biology experiments. The functional annotations are also restricted by the detail and structure of the GO digraph created by the GO curators. Nevertheless, they can be used as hypotheses for other proteins in the same cluster or tertile; also, for a given association, the CB-IDRs may perform a more specific functional role that has yet to be elucidated.
Supplemental Material
sj-docx-4-bbi-10.1177_11779322241287485 – Supplemental material for Intrinsically Disordered Compositional Bias in Proteins: Sequence Traits, Region Clustering, and Generation of Hypothetical Functional Associations
Supplemental material, sj-docx-4-bbi-10.1177_11779322241287485 for Intrinsically Disordered Compositional Bias in Proteins: Sequence Traits, Region Clustering, and Generation of Hypothetical Functional Associations by Paul M Harrison in Bioinformatics and Biology Insights
Supplemental Material
sj-docx-5-bbi-10.1177_11779322241287485 – Supplemental material for Intrinsically Disordered Compositional Bias in Proteins: Sequence Traits, Region Clustering, and Generation of Hypothetical Functional Associations
Supplemental material, sj-docx-5-bbi-10.1177_11779322241287485 for Intrinsically Disordered Compositional Bias in Proteins: Sequence Traits, Region Clustering, and Generation of Hypothetical Functional Associations by Paul M Harrison in Bioinformatics and Biology Insights
Supplemental Material
sj-docx-6-bbi-10.1177_11779322241287485 – Supplemental material for Intrinsically Disordered Compositional Bias in Proteins: Sequence Traits, Region Clustering, and Generation of Hypothetical Functional Associations
Supplemental material, sj-docx-6-bbi-10.1177_11779322241287485 for Intrinsically Disordered Compositional Bias in Proteins: Sequence Traits, Region Clustering, and Generation of Hypothetical Functional Associations by Paul M Harrison in Bioinformatics and Biology Insights
Supplemental Material
sj-pdf-1-bbi-10.1177_11779322241287485 – Supplemental material for Intrinsically Disordered Compositional Bias in Proteins: Sequence Traits, Region Clustering, and Generation of Hypothetical Functional Associations
Supplemental material, sj-pdf-1-bbi-10.1177_11779322241287485 for Intrinsically Disordered Compositional Bias in Proteins: Sequence Traits, Region Clustering, and Generation of Hypothetical Functional Associations by Paul M Harrison in Bioinformatics and Biology Insights
Supplemental Material
sj-pdf-2-bbi-10.1177_11779322241287485 – Supplemental material for Intrinsically Disordered Compositional Bias in Proteins: Sequence Traits, Region Clustering, and Generation of Hypothetical Functional Associations
Supplemental material, sj-pdf-2-bbi-10.1177_11779322241287485 for Intrinsically Disordered Compositional Bias in Proteins: Sequence Traits, Region Clustering, and Generation of Hypothetical Functional Associations by Paul M Harrison in Bioinformatics and Biology Insights
Supplemental Material
sj-pdf-3-bbi-10.1177_11779322241287485 – Supplemental material for Intrinsically Disordered Compositional Bias in Proteins: Sequence Traits, Region Clustering, and Generation of Hypothetical Functional Associations
Supplemental material, sj-pdf-3-bbi-10.1177_11779322241287485 for Intrinsically Disordered Compositional Bias in Proteins: Sequence Traits, Region Clustering, and Generation of Hypothetical Functional Associations by Paul M Harrison in Bioinformatics and Biology Insights
Footnotes
Acknowledgements
The author thanks Wan-Chun Su for running the DeepCoil program.
Author Contributions
PMH conceived the project, performed the data analysis and wrote the paper.
Declaration of conflicting interests:
The author(s) declared no potential conflicts of interest with respect to the research, authorship, and/or publication of this article.
Funding:
The author(s) disclosed receipt of the following financial support for the research, authorship, and/or publication of this article: This work was performed largely on a Mac Pro computer funded partly by the National Sciences & Engineering Research Council of Canada and by the Canadian Fund of Innovations and on 2 Mac Mini computers funded by the National Sciences & Engineering Research Council of Canada. Computations of blockiness were run on a node cluster of the Digital Alliance of Canada.
Data Availability Statement
Supplemental Material
Supplemental material for this article is available online.
References
Supplementary Material
Please find the following supplemental material available below.
For Open Access articles published under a Creative Commons License, all supplemental material carries the same license as the article it is associated with.
For non-Open Access articles published, all supplemental material carries a non-exclusive license, and permission requests for re-use of supplemental material or any part of supplemental material shall be sent directly to the copyright owner as specified in the copyright notice associated with the article.