
Abstract
Long non-coding RNAs (lncRNAs), which are RNA sequences greater than 200 nucleotides in length, play a crucial role in regulating gene expression and biological processes associated with cancer development and progression. Liver cancer is a major cause of cancer-related mortality worldwide, notably in Thailand. Although machine learning has been extensively used in analyzing RNA-sequencing data for advanced knowledge, the identification of potential lncRNA biomarkers for cancer, particularly focusing on lncRNAs as molecular biomarkers in liver cancer, remains comparatively limited. In this study, our objective was to identify candidate lncRNAs in liver cancer. We employed an expression data set of lncRNAs from patients with liver cancer, which comprised 40 699 lncRNAs sourced from The CancerLivER database. Various feature selection methods and machine-learning approaches were used to identify these candidate lncRNAs. The results showed that the random forest algorithm could predict lncRNAs using features extracted from the database, which achieved an area under the curve (AUC) of 0.840 for classifying lncRNAs between early (stage 1) and late stages (stages 2, 3, and 4) of liver cancer. Five of 23 significant lncRNAs (WAC-AS1, MAPKAPK5-AS1, ARRDC1-AS1, AC133528.2, and RP11-1094M14.11) were differentially expressed between early and late stage of liver cancer. Based on the Gene Expression Profiling Interactive Analysis (GEPIA) database, higher expression of WAC-AS1, MAPKAPK5-AS1, and ARRDC1-AS1 was associated with shorter overall survival. In conclusion, the classification model could predict the early and late stages of liver cancer using the signature expression of lncRNA genes. The identified lncRNAs might be used as early diagnostic and prognostic biomarkers for patients with liver cancer.
Introduction
Liver cancer is the second leading cause of cancer-related death worldwide. The most common type of liver cancer is hepatocellular carcinoma (HCC), which accounts for more than 80% of cases. According to GLOBOCAN 2020, the region with the highest incidence rate of liver cancer is Southeast Asia, including Thailand. The elevated mortality observed in patients with HCC can be attributed to many factors, which include insufficient early detection strategies, the absence of curative treatments for individuals diagnosed at later stages, and inconsistent implementation of curative therapies in clinical practice. The stage of the tumor at the time of diagnosis is linked to the likelihood of receiving curative treatment and affects overall survival. For instance, 5-year survival rates are less than 5% for individuals with advanced-stage HCC compared with more than 70% for those diagnosed with early stage HCC. 1 Thus, minimizing the global impact of HCC is a primary concern, and this can be accomplished through improvements in early detection and effective management. 2
For liver cancer screening, most serum biomarkers are proteins such as alpha-fetoprotein (AFP) or des-gamma-carboxy prothrombin (DCP), which has low sensitivity and specificity in HCC early detection. 3 Although conventional biomarkers are usually proteins, most of the human genome consists of non-protein-coding regions. Therefore, we are focusing on long non-coding RNAs (lncRNAs), which make up most non-coding RNAs (ncRNAs) in the human genome. Accordingly, there is a need to identify new and promising biomarkers for patients with liver cancer.
Currently, an extensive amount of sequence data, including genomics, epigenomics, and transcriptomics, have been generated using next-generation sequencing technology. This transcriptomics data, which includes messenger RNAs (mRNAs) and ncRNAs such as micro RNAs (miRNAs), lncRNAs, and circular RNAs (circRNAs), have been selected for studying HCC detection. 4 Compared with other ncRNAs, lncRNAs were the most of ncRNAs with length exceeding 200 nucleotides and are more tissue- or condition-specific than mRNAs. 5 There are several studies showing that lncRNAs are the regulators related to multiple major biological processes in various types of cancers.6-8 In HCC, lncRNAs play an important role in cancer development and progression through several mechanisms such as epigenetic regulation, chromatin remodeling, RNA binding, and cell proliferation. 9 Moreover, previous studies have revealed that lncRNAs are critical in regulating HCC, functioning either as oncogenes or as tumor suppressor genes. 4 For instance, increased levels of lncRNA CDKN2B-AS1 are associated with an unfavorable prognosis in patients with HCC. 10 CDKN2B-AS1 plays a role in advancing HCC, as it interacts with E2F transcription factor 1 (E2F) in HCC cells to enhance the expression of oncogenes G protein subunit alpha Z (GNAZ). Up-regulation of lncRNAs MALAT1 is related to HCC progression, 11 and HOTAIR, an oncogenic molecule has been used as potential biomarkers of HCC recurrence. 12 In addition, there is evidence represented that lncRNAs-UCA1 and lncRNA-WRAP53 can be used as biomarkers in HCC diagnosis.13,14 Moreover, lncRNAs have been reported as potential therapeutic targets for several cancers’ treatment. 15 For example, some FDA-approved drugs based on lncRNAs have progressed into clinical trials, demonstrating their promising potential for tumor treatment. Andes-1537, specifically designed to target mitochondrial lncRNA (mtlncRNA), exhibited therapeutic efficacy at well-tolerated doses during phase 1 clinical trials (NCT03985072) for multiple solid tumors. 16
Due to the low expression levels of lncRNAs, the RNA-sequencing (RNA-Seq) technique is a highly sensitive method commonly used to identify novel lncRNA transcripts. Therefore, bioinformatics approaches have become a vital part of data analysis techniques for identifying candidate lncRNAs. Recently, various data mining and machine-learning techniques have been applied as bioinformatics tools in many fields of research, especially in the biological and clinical sciences. 17 These techniques were used to identify insights into biological data including expression data, single nucleotide polymorphism data, metagenomic data, methylation data, and clinical data. 18 Several research has demonstrated that machine-learning and data mining techniques have been used for discovering novel biomarkers for many cancers from large data sets,19-21 especially in whole-transcriptome sequencing (RNA-Seq).
Recently, many research studies have applied machine-learning techniques such as random forest (RF), K-nearest neighbor (KNN), and Naïve Bayes (NB) to RNA-seq data.22-24 Previous studies have indicated that using machine learning is a suitable method for analyzing data and making predictions in investigations of lncRNAs associated with cancer and other diseases. In liver cancer research, it was demonstrated that the hub lncRNA CAHM might be a novel biomarker for chemotherapy resistance in HCC. 25 In addition, lncRNAs, including PARP2-202, SPON2-203, and CYREN-211, were identified using a machine-learning approach. 26 Despite numerous lncRNAs being identified by previous research, most were discovered from the different expression profiles, which are available in various repositories and literature in different formats such as cBioPortal, BioXpress, and OncoMX. Moreover, they were either not updated or relied solely on information from The Cancer Genome Atlas (TCGA) database.27-29 Thus, a gap remains in investigating lncRNAs using comprehensive data collection from a liver cancer-specific database. The Liver Cancer Expression Resource (CancerLivER) database offers significant benefits to the scientific community engaged in liver cancer research, as follows: First, the database consolidates various updated data sets and biomarker information in a consistent format. Second, it provides user-friendly tools for data queries and browsing, enabling the extraction of information about biomarkers and data sets. Third, the database is a freely accessible resource. 30
For a more comprehensive discovery of new biomarkers, we applied machine learning to investigate candidate lncRNAs in differentiating tumor stages and predicting the overall survival of liver cancer using the CancerLivER database. 30 This research could provide insight into the significant candidate lncRNAs from various feature selection techniques, which could be used as novel biomarkers in liver cancer.
Method
Data sets and SMOTE process for normal and liver cancer data
The liver cancer ncRNA-seq expression data set was downloaded from the Liver Cancer Expression Resource (CancerLivER). 30 CancerLivER is a liver cancer database that contains gene expression data sets curated from public repositories including the National Center for Biotechnology Information (NCBI) database and TCGA database. The data set of lncRNA expression in liver cancer data included 50 normal samples (negative data set) and 374 cancer samples (positive data set), which included all stages of liver cancer based on The Barcelona Clinic Liver Cancer (BCLC) staging scores 1, 2, 3, and 4. To handle the imbalance data set of positive data set and negative data set, synthetic minority oversampling technique (SMOTE) 31 involves creating synthetic examples of the minority class by interpolating between the feature vectors of existing minority class examples was applied in liver cancer ncRNA-seq expression data set.
Feature selection and model building for classification between normal and cancer
A total of 40 699 lncRNA genes (features) were filtered with expression value. The expression values less than 0.5 were removed from the expression data set. Various feature selection techniques, including correlation-based feature selection (CFS), 32 information gain, 33 and recursive feature elimination 34 were used on a lncRNA-seq expression data set for liver cancer. Each technique was used to select the top 50 significant features from the data set. Furthermore, a Venn diagram analysis was performed to select significant features that were found in all feature selection techniques. Several classifier algorithms, including NB, RF, logistic regression, KNN, multi-layer perceptron, XG Boost, light gradient boosting, and decision tree, were trained on a data set that was balanced using SMOTE and consisted of the significant features identified through Venn diagram analysis. The best classifier was chosen based on its performance in classifying positive and negative samples during 10-fold cross-validation. The selected classifier algorithm was then tested on a separate test set. The overall workflow of this work is shown in Figure 1.

Workflow of machine-learning process in this study: (A) the workflow of normal and cancer data set and (b) the workflow of early stage and late-stage data set.
Data sets and SMOTE process for early and late stage of liver cancer data
In the data set of lncRNA expression in liver cancer data from the CancerLivER database, there are labels indicating the stages in each sample, including stages 1, 2, 3, and 4, and “not reported.” The samples with the label “not reported” were excluded from the data set. To address the imbalance in the data across different cancer stages, SMOTE was applied. The total number of samples in each stage before and after SMOTE can be found in Supplemental Table 1.
Performance measurement
For measuring the performance of each classifier model in 10-fold cross-validation, we used accuracy, area under the curve (AUC), recall, precision, and F1 score. Eight classifier algorithms, including NB, RF, logistic regression, KNN, multi-layer perceptron, XG Boost, light gradient boosting, and decision tree were used to compare performance to select the suitable classifier algorithm. Each of the algorithms was trained and compared using default parameters of the sklearn library in Python.
Statistical analysis in selected feature importance
Selected significant features (non-coding genes) from the selected model were used to test normal and cancer in our data set after SMOTE processed. For the statistical testing, independent t test was used to identify the differential lncRNA expression between groups.10,35 Furthermore, the receiver operating characteristic (ROC) curve analysis and the AUC were performed in 2 groups of data, including cancer stage 1 vs cancer stages 2,3, and 4 (A), and cancer stages 1 and 2 vs cancer stages 3 and 4 (B). Receiver operating characteristic curve analysis is an approach to represent the performance of the test signal using sensitivity and specificity. In addition, AUC from ROC curve is also used for prediction evaluation. The top important features from the selected model were used for clinical correlation. Overall survival analysis of the lncRNAs was performed using Gene Expression Profiling Interactive Analysis (GEPIA) web server (http://gepia.cancer-pku.cn/index.html). 36
Results
Feature selections and Venn diagram analysis
The top 50 significant lncRNA genes shown in Supplemental Table 2 were selected using various feature selection techniques, including CFS, information gain, and recursive feature elimination. A Venn diagram analysis was conducted to identify the common significant genes found in all 3 techniques (Figure 2).
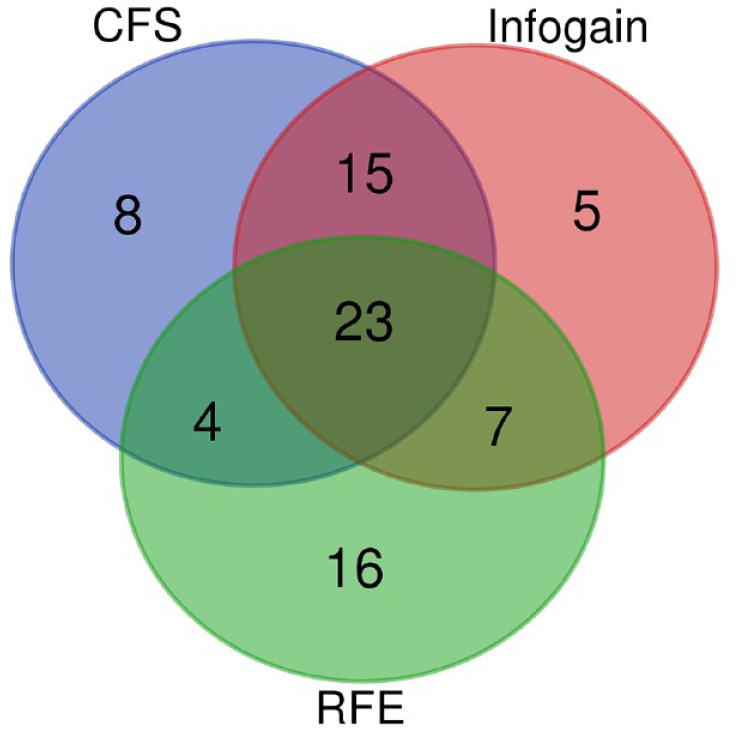
Venn diagram analysis of 3 feature selection techniques including correlation-based feature selection (CFS), information gain (infogain), and recursive feature elimination.
In addition, the details of the 23 common significant lncRNA genes and these lncRNAs-related publications are shown in Table 1. Eleven out of 23 lncRNAs including MAPKAPK5-AS1, TRIM52-AS1, CRYZL2P, RNF216P1, CD63-AS1, WAC-AS1, PMS2P1, Alu-mediated p21 transcriptional regulator (APTR), ARRDC1-AS1, PPIAP22, and HEIH were related to HCC, whereas the FCF1P2, OTUD6B-AS1, and MHENCR were related to osteosarcoma, renal cancer, and melanoma, respectively.
Description of the top 23 significant long non-coding RNA genes.

Not found in current ensemble database (searched on 5 April 2023).
Performance of classifier models for normal and cancer in liver cancer data set
To assess the performance of the classifier models for differentiating liver cancer, the liver cancer balance data set after using SMOTE technique including 374 normal samples (negative data set) and 374 cancer samples (positive data set) was used and compared the classifiers including NB, RF, logistic regression, KNN, multi-layer perceptron, XG boost, light gradient boosting, and decision tree algorithms. The 10-fold cross-validation was used to be benchmarked in each algorithm. The ROC curve was plotted and calculated for AUC. Our result showed that AUC of the RF algorithm achieves 0.999, which is better than those obtained by the other methods (Figure 3).

ROC curve analysis of each algorithm for normal and cancer data set.
However, the result of the model testing with test set showed that the light gradient boosting, XG boost, and RF algorithms show the highest accuracy at 98.9%, recall at 98.1%, and F1 score at 99.0% (Table 2). Therefore, we selected the RF algorithm based on AUC area, which is a versatile and user-friendly approach to machine learning to build the model for discriminating between normal and cancer using lncRNAs-seq expression profiles.
Performance measurement of each classifier algorithm with test set.

Statistical testing in liver cancer data set
The expression profiles of the 23 candidate lncRNAs from database between cancer and non-cancer tissues of patients were subgroup analysis. We separated the liver cancer data set into 2 subgroups, including cancer stage 1 vs cancer stages 2,3, and 4 (group A), and cancer stages 1 and 2 vs cancer stages 3 and 4 (group B). To investigate the differential lncRNA expression between those subgroups, an independent t test was performed. The summary results of the statistical analysis in each group are shown in Table 3.
The statistical significance level of the expression level of long non-coding genes between early and late stage of liver cancer.

Comparison between early stage of cancer (stage 1) and late stage of cancer (stages 2, 3, and 4) (A) and comparison between cancer (stages 1 and 2) and cancer stage (stages 3 and 4) (B). Not significant (NS).
Not found in current ensemble database (searched on 5 April 2023).
P < .05 (*) and P < .001 (**).
For group A, 10 lncRNAs showed a statistically significant difference in the expression level between stage 1 and stages 2 to 4 including SNHG30 (ENSG00000267321.1), AC133528.2 (ENSG00000228989.1), TRIM52-AS1 (ENSG00000248275.1), MAPKAPK5-AS1 (ENSG00000234608.6), ARRDC1-AS1 (ENSG00000203993.4), CD63-AS1 (ENSG00000258056.2), WAC-AS1 (ENSG00000254635.4), APTR (ENSG00000214293.7), HEIH (ENSG00000278970.1), and PMS2P1 (ENSG00000078319.8). For group B, 7 lncRNAs including SNHG30, AC133528.2, RNF216P1 (ENSG00000196204.10), MAPKAPK5-AS1, ARRDC1-AS1, WAC-AS1, and FCF1P2 (ENSG00000228638.1) were statistically significant between stages 1 to 2 and stages 3 and 4. These data suggested that the significant of lncRNAs from statistical testing between early and late stage (groups A and B) might be candidate potential lncRNA genes to classify the stages of liver cancer. In addition, the expression values of lncRNAs in group A and group B were shown in Supplemental Figures 1 and 2.
Performance of classifier models for early and late stage in liver cancer data set
To prove the significance of the 10 and 7 lncRNA genes between early and late stage, including groups A and B, respectively, we performed a 10-fold cross-validation using 8 models, including NB, RF, logistic regression, KNN, multi-layer perceptron, XG boost, light gradient boosting, and decision tree algorithms. These models were trained on a balanced data set of lncRNAs and used to evaluate the performance of classification between early and late stages of liver cancer lncRNA-seq data set. Our results in Figure 4A showed that the light gradient boosting algorithm achieved the highest AUC area compared with other classifier algorithms, with a value of 0.802 for group A. However, the RF algorithm achieved an AUC area with values of 0.798 that are not significantly different from those of the light gradient boosting algorithm. On the contrary, the RF algorithm achieved the highest AUC area compared with other classifier algorithms, with values of 0.840 for group B (Figure 4B).

ROC curve analysis of each algorithm in this study: (A) ROC curve for early stage and late stage in group A and (B) ROC curve for early stage and late stage in group B.
Furthermore, RF was selected and tested using a testing set, achieving AUC areas of 0.840 and 0.830 for groups A and B, respectively (Figure 5A and 5B).
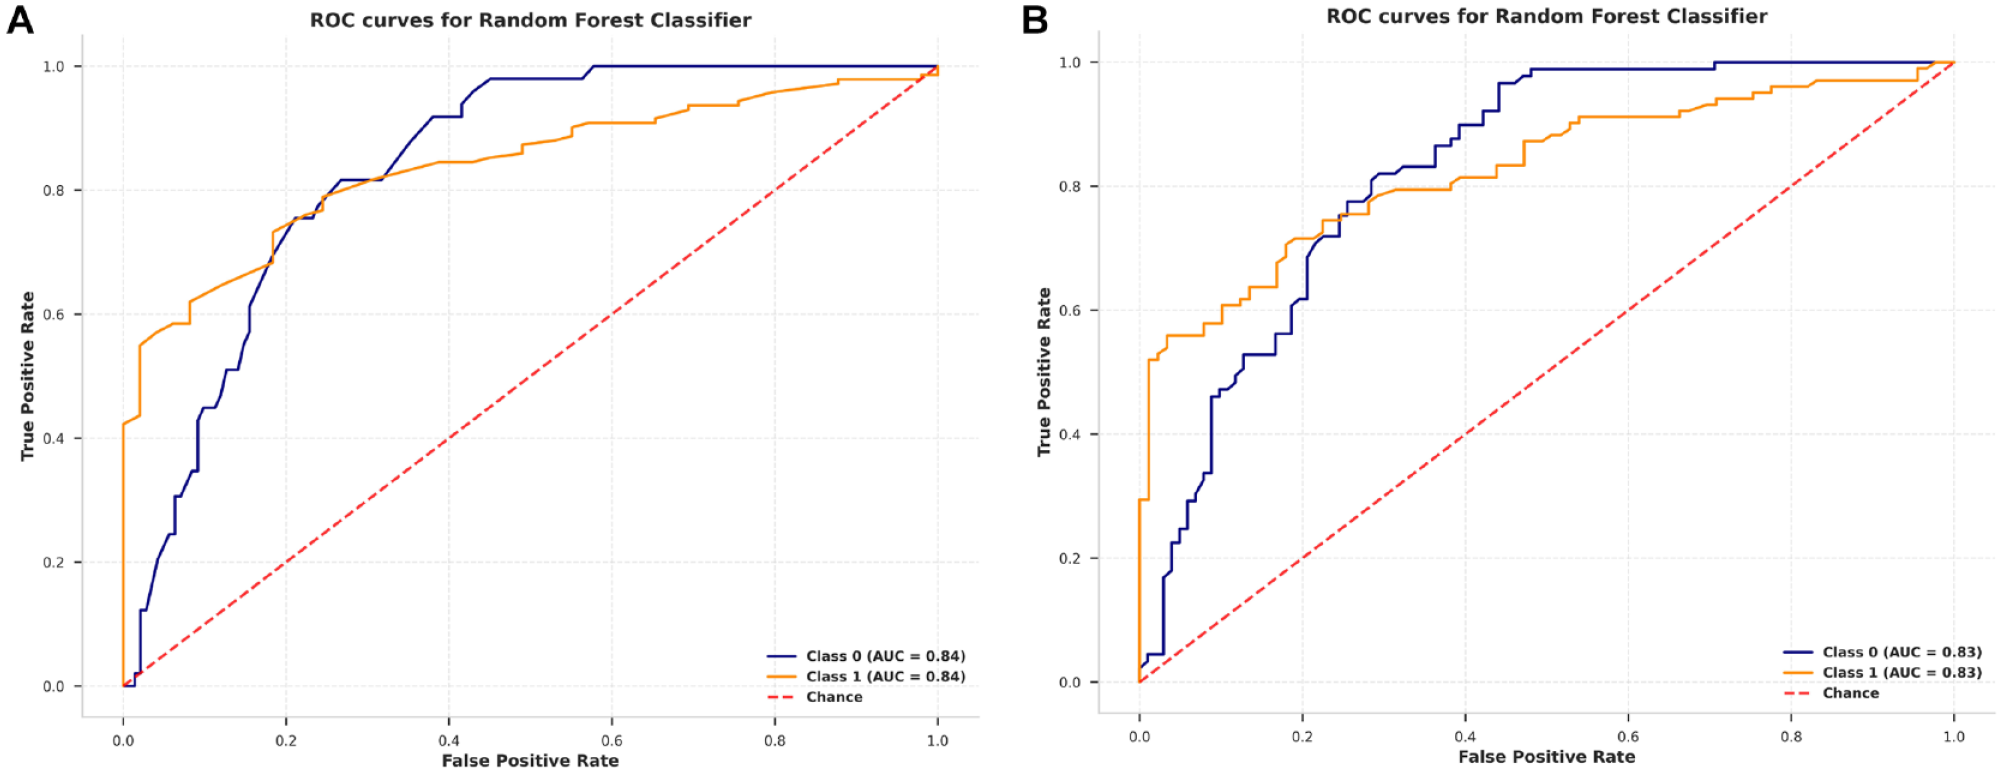
ROC curve analysis of random forest algorithms: (A) ROC curve for early stage and late stage in group A and (B) ROC curve for early stage and late stage in group B (B).
Prognostic analysis of the single significant gene in this study
Based on the significant candidate lncRNA genes in Table 1, SNHG30, AC133528.2, MAPKAPK5-AS1, ARRDC1-AS1, and WAC-AS1 showed statistical significance in both groups. The 5 significant genes were then subjected to survival analysis using the GEPIA web server, and the results in Figure 6A to E showed that the survival curves indicated a correlation between the expression of WAC-AS1, MAPKAPK5-AS1, and ARRDC1-AS1 and overall survival (log rank P < .05). However, there was no significant difference in overall survival observed in the LIHC data set from the GEPIA web server for the AC133528.2 and SNHG30 genes.

Overall survival analysis of WAC-AS1 (A), AC133528.2 (B), MAPKAPK5-AS1 (C), ARRDC1-AS1 (D), and RP11-1094M14.11 (E) using GEPIA database. The high expression of lncRNAs was represented by red line, and the low expression of lncRNAs was represented by blue line.
Discussion
Increasing the transcriptome data generated by microarray and RNA-sequencing technology leads to variation of huge data set, which requires the comprehensive integration of transcriptomic data and its analysis.51,52 Here, CancerLivER database, the uniform RNA-sequencing data, and user-friendly access platform for biomarkers related to liver cancer which integrated 115 annotated expression data sets with clinical data for 9611 samples were selected to identify the candidate lncRNAs using several classifier algorithms after SMOTE technique. Our results showed in line with previous study that RF algorithm achieves the highest performance in classifying disease-related lncRNAs.
In this study, we found the issue of class imbalance arising from varying sample sizes across different stage of liver cancer. The SMOTE was applied to liver cancer data set in our study. This approach leverages the KNN algorithm to synthetically generate new data points for the underrepresented class. There are several research showed that the SMOTE methods can handle imbalanced biological data set.22,53
Throughout our research, the candidate potential lncRNAs were derived from various feature selection techniques in machine learning including CFS, 32 information gain, 33 and recursive feature elimination, 34 which differed from those used in previous studies that selected lncRNAs based on criteria including log2 fold change in RNA expression levels in TCGA database.54-57 These feature selection methods have the potential to enhance the identification of key discriminative features for disease classification, reduce computational expenses, and offer a better understanding of extensive data sets. 58
In total, we identified 23 specific lncRNAs that differentiated cancer and non-cancer tissues from this pipeline. In subgroup analysis, 10 and 7 lncRNAs could discriminate the early (stage 1) vs late stages (stages 2-4) and stages 1 to 2 vs stages 3 to 4 of liver cancer, respectively. These results suggested that the lncRNAs reflect tumor progression in liver cancer. The complication of its function in cellular processes might be associated with tumorigenesis. However, some results differed from those in previous studies, potentially due to variations arising from the use of cell culture models, different databases, or the types of liver cancer.10,35,59 lncRNA HANR has been identified as significantly overexpressed in cholangiocarcinoma cell lines and related to the Notch signaling pathway. 35 However, in our study, this lncRNA was not observed, which may be attributed to the predominance of data sourced from HCC in CancerLivER database. lncRNA SNHG30 was significantly increased in patients with advanced stage of prostate cancer and associated with cancer recurrence. 60 In our study also observed lower level of SNHG30 in early than late stage in liver cancer. However, there have been no reported studies investigating the role of SNHG30 in cancer. Thus, SNHG30 should be further investigated in experimental and clinical studies. Alu-mediated p21 transcriptional regulator gene was statistically different between early and late stage of liver cancer from our analysis. Alu-mediated p21 transcriptional regulator first identified in glioblastomas cell lines. 61 This research showed that the APTR gene was related to proliferative factor in cancer cell lines. Moreover, there is evidence that the APTR gene was related to liver fibrosis. 47
The expression level of WAC-AS1 was higher in tumor tissue in ovarian cancer, colorectal cancer, and HCC.44,62,63 WAC-AS1 was a competing endogenous RNA and regulated tumor glycolysis. 44 Moreover, patients with glioma who had high expression of WAC-AS1 had more progression of the disease when compared to patients with low level of WAC-AS1. 64 We also observed high expression of WAC-AS1 in patients with advance stage of liver cancer and correlated with short overall survival time. It was demonstrated that the overexpression of WAC-AS1 played a role in the progression of liver cancer.
The MAPKAPK5-AS1 lncRNA gene is the new lncRNA, which plays vital roles in carcinogenesis and is related to colorectal cancer. The first experimental study in 50 patients with colorectal cancers 65 showed that increased expression in the MAPKAPK5-AS1 gene was related to an advanced pathological stage and a larger tumor size. Furthermore, data from an in vitro study showed that the MAPKAPK5-AS1 gene was related to invasion and proliferation processes in HCC cell lines 66 and related to the development of HCC in vivo and in vitro studies via binding with miR-429 to promote Zinc finger E-box binding homeobox 1 (ZEB1) expression and induce epithelial-mesenchymal transition (EMT) of the cells. 45 Moreover, high expression of MAPKAPK5-AS1 was associated with shorter overall survival in our study, which in line with previous studies. 66
From our data analysis, the expression of ARRDC1-AS1 was significantly higher in late stage than early stage of liver cancer. The higher expression of ARRDC1-AS1 was associated with shorter overall survival in patients with liver cancer. These findings were in accordance with findings reported by Li et al. They demonstrated that ARRDC1-AS1 overexpression was associated breast cancer by sponging miR-4731-5p and subsequently upregulated AKT1 expression resulting in tumor growth and proliferation48,67 and sponging miR-432-5p and activated PRMT5 expression in glioma, which related to the proliferation, invasion, and poor prognosis of the disease. 68
In our study, lncRNA HEIH exhibited significant differences between the early and late stages of liver cancer. This result is in line with previous studies that reported high expression of lncRNA HEIH in multiple cancers. 50 lncRNA HEIH has been shown to involve in cell proliferation, invasion, and drug resistance of cancer cells through various underlying mechanisms. 50 However, significant challenges remain as there is a lack of suitable animal models before translating to clinical trials, particularly the studies of HEIH that might have a discrepancy between species in pre-clinical experiments. However, our study has some limitations including the unbalancing of liver cancer samples in RNA-seq expression data set. This is the reason why the SMOTE technique was used to address the issue of sample imbalance in the liver cancer data set in this study. Our study mainly focuses on high-throughput lncRNA data sets, and these lncRNAs should be validated in clinical samples. Moreover, RNA-seq data of liver cancer patient are still required to analyze and find the insight of lncRNA expression profiles between Thai patients and TCGA patients’ data.
Conclusions
In this study, we used several feature selection techniques, including CFS, information gain, and ridge regression, to identify significant features. We then trained the RF algorithm on the liver cancer data set, using these significant lncRNA gene features, which achieved an AUC of 0.840 in classifying between early and late stages of liver cancer. Interestingly, WAC-AS1, MAPKAPK5-AS1, and ARRDC1-AS1 showed good diagnostic values and were associated with overall survival. These lncRNAs might be used as diagnosis and prognosis biomarkers for patients with liver cancers. In further study, it would be valuable to validate the significant lncRNAs that are found to be common among the feature selection techniques, as identified by the Venn diagram, in clinical samples. In addition, we plan to develop a web-based computational pipeline that will track and screen the risk of liver cancer from RNA-seq profiles.
Supplemental Material
sj-docx-3-bbi-10.1177_11779322241258586 – Supplemental material for Classification of Long Non-Coding RNAs s Between Early and Late Stage of Liver Cancers From Non-coding RNA Profiles Using Machine-Learning Approach
Supplemental material, sj-docx-3-bbi-10.1177_11779322241258586 for Classification of Long Non-Coding RNAs s Between Early and Late Stage of Liver Cancers From Non-coding RNA Profiles Using Machine-Learning Approach by Songtham Anuntakarun, Jakkrit Khamjerm, Pisit Tangkijvanich and Natthaya Chuaypen in Bioinformatics and Biology Insights
Supplemental Material
sj-jpg-1-bbi-10.1177_11779322241258586 – Supplemental material for Classification of Long Non-Coding RNAs s Between Early and Late Stage of Liver Cancers From Non-coding RNA Profiles Using Machine-Learning Approach
Supplemental material, sj-jpg-1-bbi-10.1177_11779322241258586 for Classification of Long Non-Coding RNAs s Between Early and Late Stage of Liver Cancers From Non-coding RNA Profiles Using Machine-Learning Approach by Songtham Anuntakarun, Jakkrit Khamjerm, Pisit Tangkijvanich and Natthaya Chuaypen in Bioinformatics and Biology Insights
Supplemental Material
sj-jpg-2-bbi-10.1177_11779322241258586 – Supplemental material for Classification of Long Non-Coding RNAs s Between Early and Late Stage of Liver Cancers From Non-coding RNA Profiles Using Machine-Learning Approach
Supplemental material, sj-jpg-2-bbi-10.1177_11779322241258586 for Classification of Long Non-Coding RNAs s Between Early and Late Stage of Liver Cancers From Non-coding RNA Profiles Using Machine-Learning Approach by Songtham Anuntakarun, Jakkrit Khamjerm, Pisit Tangkijvanich and Natthaya Chuaypen in Bioinformatics and Biology Insights
Footnotes
Acknowledgements
The authors would like to thank the Center for Excellence in Hepatitis and Liver Cancer for supporting them in this study.
Funding:
The author(s) disclosed receipt of the following financial support for the research, authorship, and/or publication of this article: This project was supported by Research Professor Grant, the National Research Council of Thailand (NRCT), the Center for Excellence in Hepatitis and Liver Cancer, Faculty of Medicine, Chulalongkorn University and the Ratchadapisek Somphot Fund for Postdoctoral Fellowship, Chulalongkorn University, Thailand, Bangkok. This research has received funding support from the NSRF via the Program Management Unit for Human Resources & Institutional Development, Research and Innovation (PMU-B, grant no. B36G660004).
Declaration of conflicting interests:
The author(s) declared no potential conflicts of interest with respect to the research, authorship, and/or publication of this article.
Author Contributions
SA, PT, and NC contributed to conceptualization of study; SA and JK contributed to data curation and preparation; SA contributed to data analysis; and SA, PT, and NC contributed to supervision and correction of draft. All authors read and approved final draft.
Supplemental Material
Supplemental material for this article is available online.
References
Supplementary Material
Please find the following supplemental material available below.
For Open Access articles published under a Creative Commons License, all supplemental material carries the same license as the article it is associated with.
For non-Open Access articles published, all supplemental material carries a non-exclusive license, and permission requests for re-use of supplemental material or any part of supplemental material shall be sent directly to the copyright owner as specified in the copyright notice associated with the article.