
Abstract
MicroRNAs (miRNAs) are small noncoding RNAs that act as negative regulators of gene expression at the post-transcriptional level, promoting mRNA degradation or translation repression. Despite the well-described presence of miRNAs in various human tissues, there is still a lack of information about the relationship between miRNAs and the translation regulation in human embryonic stem cells (hESCs) during cardiomyogenesis. Here, we investigate RNA-seq data from hESCs, focusing on distinct stages of cardiomyogenesis and searching for polysome-bound miRNAs that could be involved in translational regulation. We identify miR-6087 as a differentially expressed miRNA at latest steps of cardiomyocyte differentiation. We analyzed the coexpression pattern between the differentially expressed mRNAs and miR-6087, evaluating whether they are predicted targets of the miRNA. We arranged the genes into an interaction network and identified BLM, RFC4, RFC3, and CCNA2 as key genes of the network. A post hoc analysis of the key genes suggests that miR-6087 could act as a regulator of the cell cycle in hESC during cardiomyogenesis.
Introduction
The discovery of microRNAs (miRNAs) has changed our understanding of gene expression regulation. MicroRNAs are small noncoding RNAs ranging from 18 to 24 nucleotides (nt) in length that act as negative regulators of gene expression at the post-transcriptional level.1,2 Briefly, miRNA biogenesis occurs through the transcription of DNA sequences into primary miRNAs (pri-miRNAs), which are processed into precursor miRNAs (pre-miRNAs) and then form mature miRNAs. These mature miRNAs are complementary to specific regions of mRNA and exert their function by pairing their seed sequence (2-7 nt) with the 3′-untranslated region (UTR) of their target mRNA, causing mRNA degradation or translation repression.1,3-5
It is well described that miRNAs can be found in various human tissues. 6 MicroRNAs control various processes in cardiac tissues, including proliferation and differentiation of human embryonic stem cells (hESCs) and cardiac progenitors, growth and contractility of cardiomyocytes, maintenance of cardiac rhythm, and angiogenesis, among others.7-13 The importance of miRNAs in the cardiovascular system became even more evident in a study in which the deletion of essential genes for miRNA biogenesis (eg, Drosha, DGCR8, Ago2, or Dicer) resulted in premature death due to severe cardiac defects in a mouse model. 7
Despite all efforts in studies about the correlation of miRNAs with hESCs, there is still not much information on the mechanism of action, function, and miRNA-specific targets in this context. A suggested way to identify the action of these miRNAs is to analyze their association with polysomes, that is, translationally active ribosomal complexes, because it is known that miRNAs act by regulating the translation of mRNAs when bound to these complexes. 14
This association with polysomes is known as a mechanism of control of hESC differentiation once mRNA gene expression is strongly regulated during cardiac commitment. Also, it has already been described that other noncoding RNAs are also involved in post-transcriptional regulation, contributing to the determination of cardiac phenotype.15-17
Here, we explore previously published data from our group that sequenced polysome-bound RNAs from hESCs. We focus on distinct stages of cardiac differentiation (mesoderm, cardiac progenitor, and cardiomyocyte) 18 and search for miRNAs in polysomal fractions probably involved in post-transcriptional regulation of cardiomyogenesis. In addition, we investigated potential targets for selected miRNAs, estimated their centrality concerning a possible gene network, and thus inferred a potential mechanism of action–based in silico analysis of protein-coding genes.
Methods
Data analysis and miRNA candidate choice
To evaluate the temporal differential expression of miRNAs during cardiac differentiation, we have performed an analysis of the transcriptional data previously published by our group. 19 We evaluated the fastq files using FastQC 20 to check the quality of the raw sequence. Next, we used HISAT2 21 to map the RNA-seq reads to protein-coding genes and miRDeep2 mapper 22 to map the trimmed reads to the reference human genome (GRCh38 release) and to identify all known miRNAs in the samples. The counting was performed using the annotation of Ensembl (GRCh38) with Htseq 23 package. Counts were normalized with trimmed mean of M-values (TMM) from the Bioconductor R package edgeR for gene expression analysis. 24
We choose miRNAs of interest, which fulfills the following requirements: being differentially expressed during cardiac differentiation according to the sequencing data, having at least 1 normalized count (TMM) in the mean of samples, and not having reports in the literature regarding its participation in cardiomyogenesis or its association with polysomes.
Coexpression analysis of differentially expressed genes
To understand the coexpression pattern between the differentially expressed genes and the miRNA chosen, we perform the coexpression analysis from the protein-coding data 19 using normalized read counts. 25
The normalized data were submitted to k-means clustering 26 to analyze possible groups containing the same gene expression pattern. The gene expression counts were clustered considering distinct k values in a range of k ∈ [2, 10], and the associated inertia for each variation was plotted. The inertia represents the sum of the squared distances of each gene expression to their closest cluster center (or centroid). By that, it was possible to use the elbow method 27 to search for the inflection point of the plotted inertia curve, which hit a plateau with k = 4.
After that, we searched for coexpression patterns inspecting the adherence of the raw data to the cluster centroids retrieved by the k-means method, resulting in 4 distinct patterns/clusters whose gene expression levels rise and fall similarly between the days of differentiation.
In silico analysis of miRNA-mRNA target predictions
After choosing the miRNA candidate and knowing its coexpressed genes, we searched for its target genes using 3 well-known miRNA target prediction tools, that is, TargetScan,28,29 DianaTools, 30 and mirDIP. 31 Then, we compared all the predicted targets returned from these tools with the protein coding data from Pereira et al 19 to know which predicted genes are differentially expressed during cardiac differentiation and have a coexpression pattern opposite to that of the miRNA candidate. This resulting group of genes represents the union between the above-described sets, and it is hereafter referred to as Clustered Genes Dataset. The Clustered Genes Dataset is described in section “In silico analysis of miRNA-mRNA target predictions.”
Gene interaction network
We used the Human Protein Atlas 32 to acquire data regarding gene expression of detected protein-coding genes filtered by the heart muscle tissue. Then, we filtered these genes to exclude samples with “not detected” levels and “uncertain” reliability. The level filter guarantees genes with a cutoff value of 1 nTPM as a threshold for detection across all tissues or cell types. The reliability filter assures genes with enhanced, supported, or approved scores based on the available characterization data from Human Protein Atlas and UniProtKB/Swiss-Prot database, 33 including detection at the RNA level.
The Clustered Genes Dataset was arranged into a gene interaction network represented by an undirected graph, where genes are depicted in nodes and the molecular interactions of their protein products, retrieved from the STRING Database, 34 act as the edges of the graph. The gene interaction network was implemented using miRNET, 35 built under the NetworkX package on Python. 36 Each node/gene in the gene interaction network has a centrality defined as the additive sum of their betweenness and degree centralities, according to the protocol provided by Osmak et al 35 and Peláez and Carthew. 37 The betweenness centrality of a node/gene g is the sum of the fraction of all-pairs shortest paths that pass through g, while the degree centrality for g is the fraction of nodes that g is connected to.
After that, a set of key nodes/genes can be obtained from the gene interaction network by analyzing the behavior of the largest connected component (LCC) of the network when nodes/genes with the highest centrality are removed one by one, and the LCC eventually loses its connectivity and disintegrates. This step results in a list of pairs in the format (|LCCn,|CCn), where n stands for the number of highest centrality nodes/genes removed,|LCCn| for the cardinality of LCC concerning n, and CCn for the number of connected components (CC) in the network. 35 Then, we iterate the list of pairs to retrieve the minimal n, nmin, considering the derivative of the function equal to zero (stationary point). The set of key nodes/genes, thus, comprehends all nodes with indexes less than or equal to nmin.
Both key and LCC component genes were analyzed concerning their biological processes, that is, the gene ontology (GO; performed using ShinyGO 0.76.3) 38 and gene interaction network, and discussed regarding the function of the miRNA candidate during cardiomyogenesis. Also, we predicted miRNA-binding sites in the mRNA’s coding sequence (CDS), 5′-UTR and 3′-UTR of the key genes using the STarMir application module of the Sfold RNA package,39,40 which uses evolutionary conservation information for improved predictions. Each predicted site is evaluated regarding the type of mRNA-miRNA binding (seed or seedless) and assigned a logistic probability as a measure of confidence (0.75 or higher means a high probability).41,42
Results
Data analysis and miRNA candidate choice
Data analysis resulted in 38 differentially expressed miRNAs during the cardiomyogenesis in the polysomal RNA fraction. Among them, miR-6087 was the most expressed when compared with the other miRNAs found. The miRNAs were filtered by 1 TMM as a threshold for detection across the days of differentiation. Figure 1 presents a list comprising all the 38 miRNAs and their expression profiles in a hierarchical clustering heatmap. The heatmap depicts high (red), average (black), and low (blue) Z-scores of normalized TMM values obtained by the miRNAs. The hierarchical clustering was performed considering the average linkage method and the Pearson correlation as the distance metric. We provide the matrix containing the raw and normalized miRNA TMM values and Z-scores used to generate the hierarchical clustering and the heatmap in Supplementary Tables 1 and 2.

Hierarchical clustering miRNAs on polysome-bound fraction heatmap. The 38 differentially expressed miRNAs during hESC cardiomyogenesis in polysome-bound fraction are shown in a hierarchical clustering heatmap. The heatmap depicts high (red), average (black), and low (blue) Z-scores of normalized TMM values obtained by the miRNAs related to their expression level. The hierarchical clustering was performed considering the average linkage method and the Pearson correlation as the distance metric. The x-axis shows the days of differentiation (D0, D4, D9, and D15); on the y-axis, each line represents a miRNA clustered according to their hierarchy, shown in the dendrogram on the left.
To define the miRNA candidate, we conducted a literature search to comprehend the correlation between the most differentially expressed miRNAs and cardiomyogenesis and polysomes. MiR-6087 seems to be an unexplored post-transcriptional regulator of cardiomyogenic differentiation as there are no studies comprehending this miRNA and polysomes or cardiomyogenesis together.
In addition to polysomal RNA samples, we also evaluated polysome-free RNA samples to ensure that miR-6087 is involved in cardiomyogenesis regulation due to its association with polysomes. Thus, miR-6087 was not detected in the polysome-free fraction, demonstrating that it may be acting directly on cardiomyogenesis regulation when associated with these complexes. All miRNAs detected in the polysome-free fraction can be seen in Figure 2.

Hierarchical clustering miRNAs on ribosome-free fraction heatmap. The 187 differentially expressed miRNAs during hESC cardiomyogenesis in ribosome-free fraction are shown in a hierarchical clustering heatmap. The heatmap depicts high (red), average (black), and low (blue) Z-scores of normalized TMM values obtained by the miRNAs related to their expression level. The hierarchical clustering was performed considering the average linkage method and the Pearson correlation as the distance metric. The x-axis shows the days of differentiation (D0, D4, D9, and D15); on the y-axis, each line represents an miRNA clustered according to their hierarchy, shown in the dendrogram on the left.
To validate that the increase in miR-6087 expression between D0 and D15 is inherent to the cardiac differentiation process and not exclusively related to the cell line (hES-NKX2–5eGFP/w) or the differentiation protocol used, we evaluated the expression of miR-6087 by real-time quantitative polymerase chain reaction (RT-qPCR) in H1 cell line–induced differentiation using a monolayer-based protocol. We evaluated the Quantification cycle (Cq) on both days of differentiation and value correlated with the initial concentration of miRNA, and confirmed that miR-6087 expression is higher at D15 than at D0 (Figure 3).

RT-qPCR validation of miR-6087 expression in the H1 cell line. Validation of miR-6087 expression based on the Cq detected in the samples. This value is correlated with the initial miRNA concentration, that is, the higher the miRNA concentration, the earlier fluorescence is detected and the lower the Cq value. In this sense, the x-axis shows the days of differentiation (D0: dark gray bar; D15: light gray bar). On the y-axis, we have the Cq values, with the standard deviations between replicates next to the bars.
Coexpression analysis of differentially expressed genes
A coexpression analysis of the 4726 differentially expressed genes present in the data from Pereira et al 19 was performed (Figure 4). The central line marks the cluster average, and the shaded area portrays the standard deviation considering the square root (SQRT) of the normalized read counts (median of ratios). As previously described, we found 4 different expression patterns of mRNAs. In the first cluster c1 (Figure 4A), the mRNA expression increased at the beginning of the differentiation and continued to increase in the later cardiac stage. In the second cluster c2 (Figure 4B), the gene expression increased from day 4 to day 9, but decreased on the last part of the differentiation. The third cluster c3 (Figure 4C) represents a pattern opposite to the second one, with decreasing gene expression levels at the beginning of the differentiation and increasing gene expression levels at the cardiac stage. Finally, the fourth cluster c4 (Figure 4D) comprises mRNAs with a consistent decrease in their expression level throughout the differentiation. The genes represented in each of these clusters can be found in the Supplementary Material (Supplementary Table 3).

Coexpression patterns (clusters) found on the differentially expressed genes. The 4 graphs demonstrate the different DEG coexpression patterns. The central line marks the cluster average, and the shaded area portrays the standard deviation considering the values on the y-axis concerning the SQRT of the normalized read counts (median of ratios). The x-axis shows the days of differentiation. Four different miRNA expression patterns were found: (A) up pattern (cluster 1), (B) up-and-down pattern (cluster 2), (C) down-and-up pattern (cluster 3), and (D) down pattern (cluster 4).
Here, we highlight cluster 4, with a down pattern throughout days 4, 9, and 15 of the differentiation. Note that this pattern is inverse to the pattern presented by miR-6087 (cf. Figure 1), an expected characteristic in genes regulated by miRNAs, as will be discussed in section “Discussion.”
In silico analysis of miRNA-mRNA target predictions
After analyzing the target prediction tools, we created a list of predicted target genes. The comparison of this list and data from protein coding genes resulted in 2700 Predict Target Genes of miR-6087 expressed during cardiomyogenesis. Note that we made the union between the data of the target prediction tools once the intersection between them would make the input for the next steps infeasible due to the low number of genes. Then, we evaluated the coexpression pattern of all the genes included in the predicted target gene list, and 669 predicted target genes were included in cluster 4 previously described. We referred to this group of 669 genes as Clustered Genes Dataset.
Gene interaction network
As previously described, the dataset containing the clustered genes was used as input in the construction of the gene interaction network and in the definition of the key genes/nodes by analyzing the behavior of the LCC of the network. Figure 5 shows the LCC and CC (see section “Gene interaction network”) with the successive removal of the highest centrality genes/nodes. The solid blue line represents the LCC cardinality and the double green line the number of CC with regard to n removed genes/nodes.
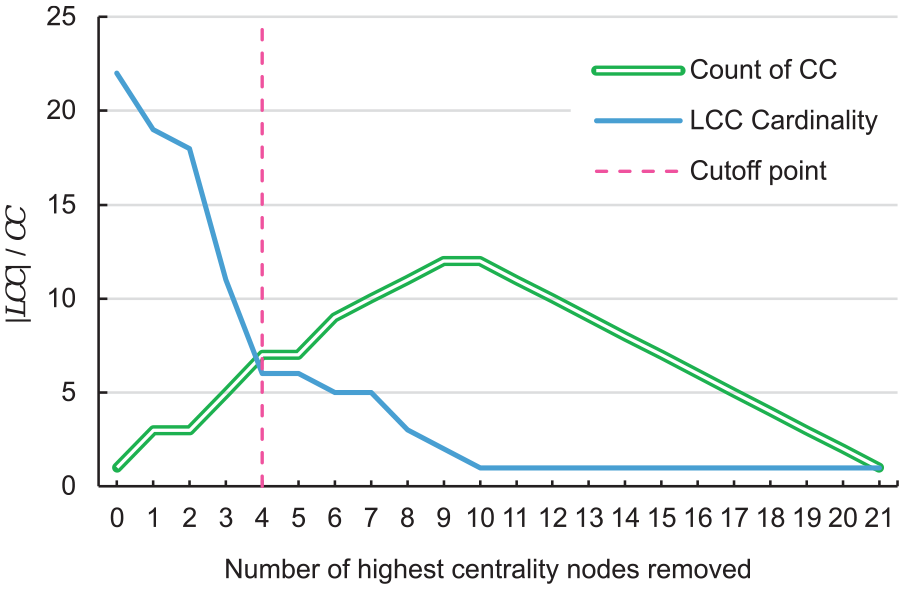
Definition of the cutoff point of key genes via LCC disintegration. The lines show the LCC and CC with the successive removal of the highest centrality genes/nodes. In the y-axis, the solid blue line represents the LCC cardinality (|LCC|), and the double green line is the count of CC. The dashed pink line marks where both LCC and CC cross, and LCC hits a plateau establishing a cutoff point. The x-axis shows the number of the highest centrality nodes removed.
Before the first removal, the entire LCC comprises 22 nodes/genes. When removing the highest centrality genes/nodes, the LCC cardinality decreases by losing its connectivity, and the CC increases, causing the disintegration of the LCC. The dashed pink line marks the point (n = 4) where both LCC and CC cross and LCC hits a plateau. This point is used as the cutoff point for the key gene selection.
Figure 6 shows the gene components of the LCC in an interaction network (Figure 6B) and in a histogram of their centralities (Figure 6A). The LCC comprises 22 genes with varying centralities, and the 4 key genes with the highest centrality are, in ascending order, CCNA2, RFC3, RFC4, and BLM.

LCC gene overview. (A) Histogram of gene centralities and (B) gene interaction network. The figure describes gene components of the LCC in a histogram of their centralities (A) and an interaction network (B). In (A), the y-axis indicates the frequency of gene components of the LCC, categorized according to their centrality (x-axis). The red bars show the 4 key genes with centralities comprised of the last 3 populated intervals. In (B), the interaction network of the LCC genes highlights the 4 key genes where the circle sizes correspond to the centrality of the genes.
Specifically, Figure 6A portrays the histogram of the gene centralities. The graph shows the number of gene (frequency) components of the LCC categorized in centrality intervals in the range [0, 1.0]. Note that 4 key genes are shown on the red right bars with centralities comprised of the last 3 populated intervals, with centralities, in ascending order, 0.4821, 0.5702, 0.5833, and 0.8060.
Figure 6B shows the interaction network of the LCC genes. The circle sizes correspond to the centrality of the genes. We provide a full list comprising all the genes of the LCC and their centralities in the Supplementary Material (Supplementary Table 4).
We performed a global analysis regarding the GO of the 22 members of the LCC, suggesting an action of these genes within biological processes such as cell cycle and mitosis (Figure 7).
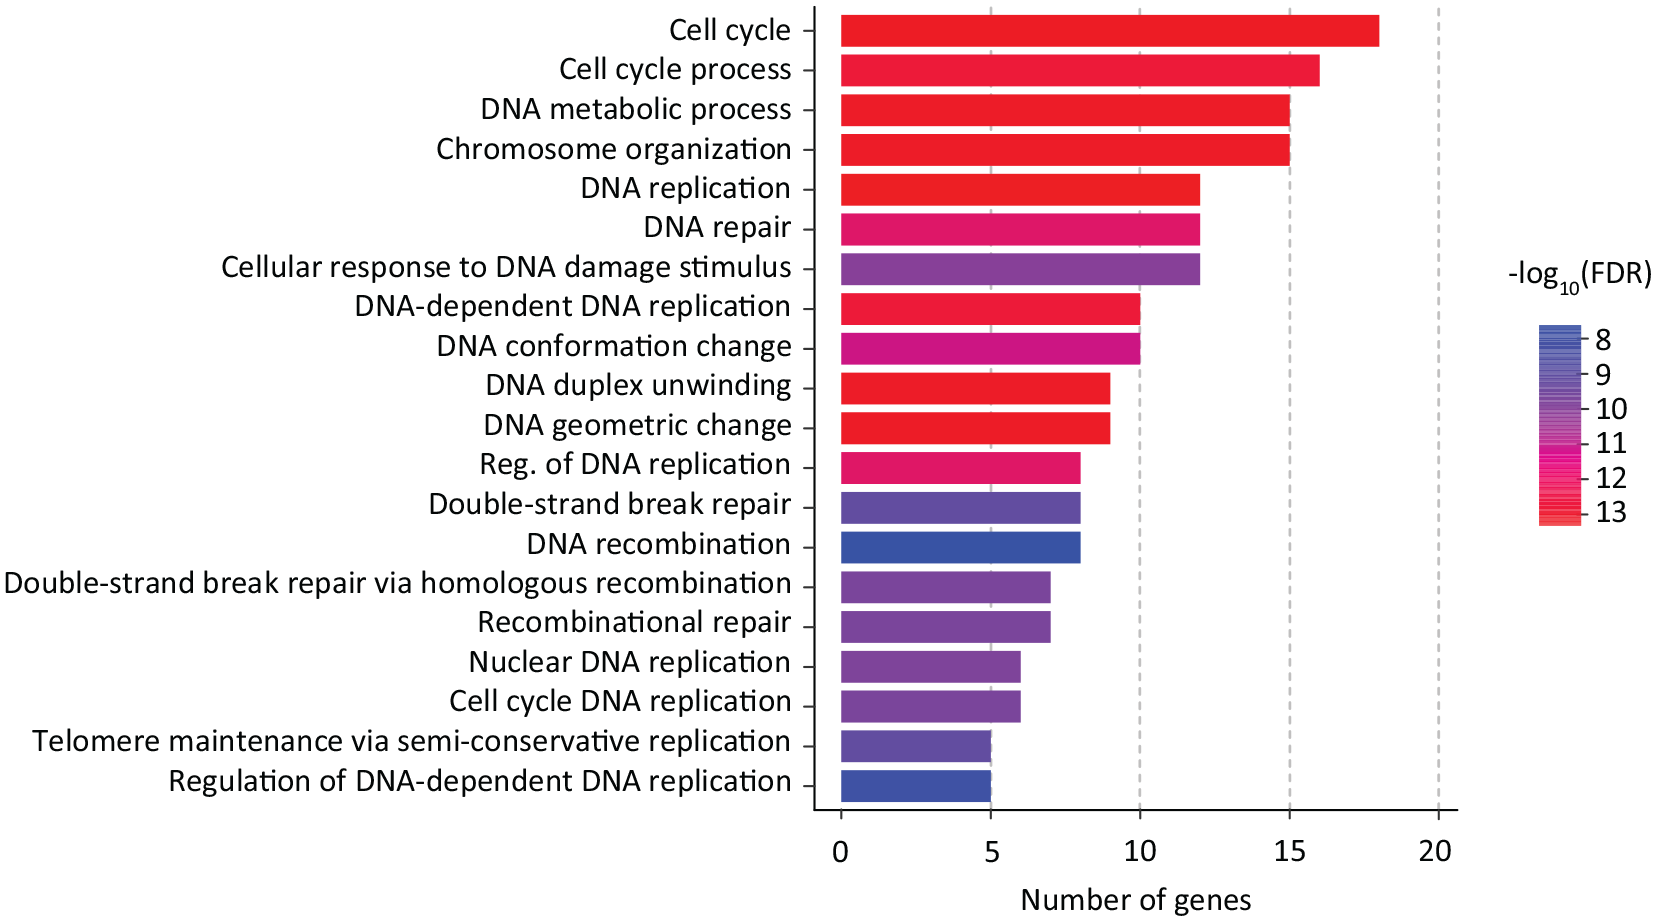
Gene ontology of the 22 members of the LCC. The graphic shows the gene ontology concerning the biological processes in which the genes of the LCC are involved. The terms are categorized according to the number of genes (x-axis, size of the bars) related to each process. The color scale refers to the negative logarithm (base 10) of the expected rate of false positives (-log10(FDR)).
Figure 8 shows the predicted binding sites of the 4 key genes. Circles represent each of the binding sites inside an mRNA region (delimited by the dashed lines) of the gene. Spheres are positioned regarding the middle point of the binding site indicated in the nucleotide axis.

Predicted binding sites of the 4 key genes. Predicted miR-6087-binding sites for key genes BLM, RFC4, RFC3, and CCNA2. Each circle represents a binding site within an mRNA region of the gene (delimited by the dashed lines). Note that miR-6087 has binding sites in both the canonical action region (3′-UTR) and the CDS region, and all of these binding sites represent partial bindings.
Data were filtered considering a logistic probability equal to or greater than 0.75 to ensure high connection reliability. Note that all data refer to the seedless binding type, that is, regions that do not perfectly match the miRNA but can also lead to target repression. Although partial sequence pairing acts less efficiently in target repression, studies have shown that when seed and seedless sites are present in the same 3′-UTR, seedless sites may have a stronger regulatory role than seed sites. 43
We also highlight that the 4 key genes present binding sites in the CDS region. Note that this region, a priori, is not a canonical binding site for miRNAs. Studies have already reported that the mechanisms of recognition and regulation are distinct when the miRNA acts on 3′-UTR or CDS. Furthermore, CDS-binding sites would be responsible for weaker regulation than 3′-UTR binding but could effectively inhibit translation, whereas sites located in the 3′-UTR would be more effective in degrading target mRNA.44-46
Discussion
Many miRNAs already have a well-described role in hESCs, 47 regulating processes such as maintenance of pluripotency, proliferation, and self-renewal48,49; the early stages of hESC differentiation50,51; and cardiomyocyte differentiation.51,52 In this sense, Garate et al 53 described the miRNAs involved in the cardiac lineage commitment during stem cell differentiation based on their families and cluster organization. Also, Alfar et al 54 highlighted the principal miRNAs described in cardiomyocyte differentiation and maturation, including miR-208a expressed in our data at D15 and known as highly expressed in the adult heart. Despite this, there is not much information about the association of these miRNAs with polysomes.
Finding miRNAs with a high expression level in sequencing data gives evidence of the importance of these miRNAs during cardiomyogenesis. In this sense, miR-6087 stands out for the higher expression level among the other miRNAs (see Figure 1). Note that miR-126 and miR-302a also stand out regarding their expression levels. miR-126 has already been described as a regulator of cardiomyocyte hypertrophy as its knockdown significantly reduces the size of cardiomyocytes.55,56
Also, Kren et al 57 correlate miR-126 with polysomes during liver regeneration. Similarly, Spangenberg et al 58 found miR-302a in the polysomal fraction of stem cells isolated from adipose tissue. Besides, miR-302a is widely described as a highly expressed miRNA in pluripotent cells, targeting cell cycle regulatory genes with its highest expression in the S phase.59-61
Cardiac differentiation is a complex and dynamic process regulated at multiple levels that involves different stages, such as commitment of undifferentiated ESCs, mesoderm patterning, cardiac progenitors, and cardiomyocyte. 62 Molecular regulation during cardiomyogenesis depends on precise control of gene expression at transcriptional and post-transcriptional levels. 63
Different cell lines induced to cardiac differentiation have already been studied, and their transcriptome has been characterized. Analysis of the data published by Szabo et al 64 for RUES2 hESCs performed by Wang et al 65 provides information about 4868 differentially expressed genes (DEG), a number close to the 4726 DEG found in the analysis of data from Pereira et al 19 (see section “Data analysis and miRNA candidate choice”). This difference in DEG values can be explained by the use of different analysis methods between our work and the one mentioned above and also by the variability that occurs between the different hESC lines with different genetic backgrounds, which leads to the expression of receptors, transcription factors, and growth factors in different levels. 66
The organization of DEG in coexpression clusters is used to find correlation patterns between genes in different conditions to identify functional relationships between the genes that present a pattern of coordinate expression within a sample group.67-69 We searched for the target genes that expressed an opposite trend to miR-6087, suggesting that they might be regulated by this miRNA.
As described previously, we evaluated the centrality of the components of the Clustered Genes Dataset, creating an interaction network between the miR-6087 target genes expressed in the heart muscle according to the Human Proteome Atlas (see section “Gene interaction network”). Evaluating the GO of the 22 components of the LCC, we observed an enrichment of GO terms related to biological processes such as cell cycle, DNA replication, and mitosis. Here, it is essential to highlight that the cell loses its ability to undergo mitosis when differentiated, and cardiomyocytes have a low proliferation capacity. Thus, the heart becomes highly inefficient in replacing the cardiomyocytes in case of diseases such as myocardial infarction.70,71
Next, we identified BLM, RFC4, RFC3, and CCNA2 as key genes in the miR-6087-regulated network. The gene with the highest centrality, BLM, is a helicase whose expression is tightly regulated in the cell cycle, presenting high levels in S and G2 phases, suggesting a possible function of BLM in the replication (S phase) and/or post-replication (G2 phase) process.72-75 It is interesting that the expression of this gene reaches high levels in proliferating and undifferentiated cells, indicating that BLM may be involved in the control of cell differentiation by suppressing differentiation markers.75,76
The RFC4 and RFC3 genes, second and third in order of centrality, are part of the RFC (replication factor C) family, a highly conserved multimeric protein consisting of 5 distinct subunits. The genes of this family are mainly involved in telomere maintenance, nuclear DNA replication, mismatch repair, and nucleotide excision repair. 77 RFC3 commonly interacts with other genes to induce cell division and proliferation, 78 whereas RFC4 is essential for DNA replication initiation, maintenance, and cell proliferation in eukaryotic cells. 79
The fourth gene in decreasing order of centrality, CCNA2, is one of the principal regulators of the cell cycle, acting in the control of S phase and mitosis through the activation of kinases.80,81 CCNA2 is essential for embryonic development and is the only cyclin silenced when cardiomyocytes exit the cell cycle in the postnatal mammalian myocardium. However, the reactivation of CCNA2 at more advanced stages of development can cause cardiomyocyte proliferation and increased cardiac contractile function in an infarcted model.82-85
Finally, it is important to highlight 3 aspects concerning the relationship between miR-6087 and its target genes. First, once miR-6087 is overexpressed in cardiomyocytes (D15), it is expected that their targets will have reduced expression at this time. It is known that differentiated cardiac cells have low capacity for self-renewal,83,86,87 which supports the fact that miR-6087 target genes remain expressed at lower levels in differentiated cardiomyocytes.
Second, the predicted function of miR-6087 as a regulator of the cell cycle in hESC is interesting once the processes of self-renewal and maintenance of pluripotency are closely related to this mechanism, 88 corroborating the lower miR-6087 expression in the early days of differentiation. On the other hand, the action of miR-6087 on the target genes during the final steps of cardiomyogenesis may promote a decrease in the function of these genes in the cell cycle, allowing the cell to differentiate. Furthermore, researchers have been putting considerable effort into identifying novel and relevant factors in the cell cycle regulation of cardiomyocytes. 89 Thus, understanding how miR-6087 acts in the post-transcriptional regulation of cardiac differentiation could provide insights into how this regulation works and relates to cardiac self-renewal, promoting tissue regeneration in several diseases, such as myocardial infarction.
Conclusion
In this study, we have analyzed miRNAs in polysome-bound fractions during cardiac differentiation from hESC. This analysis may help to improve the understanding of the mechanism of miRNAs involved in the regulation of cardiomyogenesis, especially by describing which key genes are regulated by miRNAs and the impact of this regulation on the cardiac differentiation process.
Furthermore, we have provided a more comprehensive understanding of the role of miR-6087 and its increased expression pattern during cardiac differentiation. We notice that miRNAs differentially expressed during cardiomyogenesis with a high number of read counts, highlighting miR-6087, the most expressed when compared with the other miRNAs found. In this sense, it was possible to analyze the coexpression between miR-6087 and differentially expressed genes with expression patterns inverse to miR-6087, allowing the creation of a gene interaction network. Thus, we determined the key genes of this network and predicted the miR-6087 function as a regulator of the cell cycle in hESC.
For further research, we intend to confirm the association of miR-6087 with polysomes. We will evaluate cells previously treated with puromycin that disassembles the polysomes. We expect a decrease in miRNA expression in puromycin-treated cells compared with cycloheximide-treated cells. Furthermore, we also plan to evaluate the influence of miR-6087 on the 4 key genes, that is, BLM, RFC4, RFC3, and CCNA2, by knocking down miR-6087 during cardiac differentiation. To do this, we can use well-established techniques for knocking down miRNAs, such as the anti-miR oligonucleotide-based mechanism, 90 which acts by base-pairing with the target miRNA sequence. Also, it is possible to use the CRISPR/Cas9 system, 91 an emerging technique for editing miRNA sequences. After the knockdown, it will be possible to evaluate with RT-qPCR the expression change of the key genes in the absence of miR-6087.
Supplemental Material
sj-xlsx-1-bbi-10.1177_11779322231161918 – Supplemental material for miR-6087 Might Regulate Cell Cycle–Related mRNAs During Cardiomyogenesis of hESCs
Supplemental material, sj-xlsx-1-bbi-10.1177_11779322231161918 for miR-6087 Might Regulate Cell Cycle–Related mRNAs During Cardiomyogenesis of hESCs by Hellen Cristine Machado, Saloe Bispo and Bruno Dallagiovanna in Bioinformatics and Biology Insights
Footnotes
Funding:
The author(s) disclosed receipt of the following financial support for the research, authorship, and/or publication of this article: CNPq – National Center of Science and Technology for Regenerative Medicine/REGENERA grant number 465656/2014-5 and CNPq PROEP/ICC grant number 442353/2019-7. H.C.M. received fellowship from CAPES (Coordination for the Improvement of Higher Education Personnel), S.B. from Fiotec (Foundation for Scientific and Technological Development in Health), and B.D. from CNPq (National Council for Scientific and Technological Development).
Declaration of Conflicting Interests:
The author(s) declared no potential conflicts of interest with respect to the research, authorship, and/or publication of this article.
Author Contributions
H.C.M. performed the bioinformatic analyses. H.C.M., S.B. and B.D. wrote the manuscript. B.D. conceived and coordinated the work.
Supplemental Material
Supplemental material for this article is available online.
References
Supplementary Material
Please find the following supplemental material available below.
For Open Access articles published under a Creative Commons License, all supplemental material carries the same license as the article it is associated with.
For non-Open Access articles published, all supplemental material carries a non-exclusive license, and permission requests for re-use of supplemental material or any part of supplemental material shall be sent directly to the copyright owner as specified in the copyright notice associated with the article.