
Abstract
Previously, we showed that novel histone deacetylase (HDAC) inhibitors, N1-hydroxy-N8-(4-(pyridine-2-carbothioamido)phenyl)octanediamide (Jazz90) and [chlorido(η5-pentamethylcyclopentadienyl)(N1-hydroxy-N8-(4-(pyridine-2-carbothioamido-κ2N, S)phenyl)octanediamide)rhodium(III)] chloride (Jazz167), have cytostatic and anti-angiogenic effects in androgen receptor-negative prostate cancer cells and are also non-toxic in BALB/c mice. However, only univariate statistical analysis was carried out to determine the role of individual proteins. In this study, multivariate statistical analyses (MVAs) and data mining procedures were carried out with the objective of determining the molecular networks that explain the growth inhibitory potential of Jazz90 and Jazz167 in PC3 cells and to determine potential inhibitors that can be used in combination with these HDAC inhibitors. Lasso regression revealed that angiogenic factors, vascular endothelial growth factor-A (VEGF-A), and vascular endothelial growth factor receptor-2 (VEGFR-2), alongside HDAC inhibition, predicted the reduction in cell number with an adjusted R2 value of 0.99 following Jazz90 treatment, whereas VEGFR-2, acetylation of histone-3, and HDAC inhibition predicted cell number with an adjusted R2 value of 0.84 following Jazz167 treatment. These results were further followed up with ridge regression, hierarchical cluster analysis, random forest classification (RFC), and support vector machines. RFC and support vector machines also predicted the treatment groups with a 100% accuracy. MVAs also revealed that Jazz90 should be examined in combination with epithelial to mesenchymal transitioning inhibitors, such as simvastatin and olaparib, whereas Jazz167 should be examined with venetoclax or navitoclax. Future studies should also address the roles of VEGF-A and VEGFR-2 in cellular proliferation, whereas p27 function should be examined for its role in PC3 cell migration.
Keywords
Introduction
Multivariate statistical analyses (MVAs) have routinely been used in proteomic studies of cancer in humans and animals but have rarely been used for in vitro studies.1,2 In this study, MVAs and data mining procedures were used to understand which mechanistic pathways are key to the action of novel HDAC inhibitors, N1-hydroxy-N 8 -(4-(pyridine-2-carbothioamido)phenyl)octanediamide (Jazz90), [chloride(η 5 -pentamethylcyclopen-tadienyl)(N1-hydroxy-N 8 -(4-(pyridine-2-carbothioamido-κ 2 N, S)phenyl)octanediamide)rhodium(III)] chloride (Jazz167) and suberoylanilide hydroxamic acid (SAHA), in androgen receptor-negative (AR-) prostate cancer (PC3) cells. Previously, we examined the effects of Jazz90 and Jazz167 on cell survival and migration proteins3,4 (Table 1). The broader objectives of our previous studies were to identify efficacious drugs for AR-prostate cancer because this cancer variant does not have a viable drug treatment and has a poor prognosis. 3 However, only univariate statistical analysis was used on this data set. 2
Effect of Jazz90, Jazz167, and SAHA on protein levels in PC3 cells.

Abbreviations: ↑ upregulation; ↓ downregulation; NC, no change in protein expression; SAHA, suberoylanilide hydroxamic acid; VEGF-A, vascular endothelial growth factor-A; VEGFR-2, vascular endothelial growth factor receptor-2.
MVA and data mining analyses are specifically useful to elucidate the mechanisms of action of novel HDAC inhibitors. HDACs are a complex family of molecules that contain 18 different types of HDAC isoenzymes, out of which 11 are zinc-dependent and 7 are NADPH-dependent. 5 HDACs, via deacetylation of histones and non-histone proteins, downregulate tumour suppressors in processes, including proliferation, survival, angiogenesis, and epithelial to mesenchymal transitioning 5 (Table 1). As Jazz90 and Jazz167 were synthesised using SAHA as a parent compound, these drugs contain a hydroxamate moiety capable of interacting with zinc ions. However, Jazz90 and Jazz167 have different cap regions in comparison to SAHA. Previous studies report that altering the cap regions on HDAC inhibitors can shift their HDAC isoenzyme inhibitory potential. 6 In turn, a shift in the processes regulated by HDAC inhibitors is observed. The shift in the regulated processes can be evaluated by MVA and data mining analyses, which in turn indicate the potential mechanism of action via which Jazz90 and Jazz167 function. Importantly, MVA and data mining analyses not only highlight potential drug-mediated mechanisms of action but they also elucidate the mechanism by which the drug might not act. Thus, an additional role for their use is to determine possible compound specific combination treatments to increase efficacy.
Various MVA and data mining analyses, such as hierarchical cluster, lasso and ridge regression, random forest classification (RFC), and support vector machine (SVM) analyses, were conducted. Cluster analysis (CA) was used to identify the associations between different proteins, whereas lasso and ridge regression were used to identify the combination of variables that could predict drug-mediated changes in cell number. RFC and SVMs were used to determine whether treated samples could be classified as drug- or control-treated while simultaneously ranking the proteins in their order of importance. The combination of proteins involved in the prediction of cell number and drug treatment not only provides an insight into their mechanism of action but may also aid in the development of biomarkers for cancers and their drug responsiveness. Although there are a multitude of different data mining procedures, 2 in our other studies, we have found RFC to be particularly useful, 2 and, in any case, the aim here was to explore the use of these kinds of methods for this data set, rather than conducting a systematic comparison of multiple data mining procedures.
Methods
The MVAs and data mining analyses conducted here use experimental results reported previously.3,4 The results obtained from standard assays to assess HDAC inhibition and expression levels of acetylation of histone-3, cell cycle (cyclin D, cyclin B, p21, and p27), apoptotic (bcl-2), epithelial to mesenchymal transitioning (E-cadherin and vimentin), angiogenic (VEGF-A and VEGFR-2), proliferative (pErk/Erk), and survival (PI3K/Akt) proteins in PC3 cells following Jazz90, Jazz167, and SAHA treatment at 0.05, 0.1, 1, 4, 6 and 8 µM, were used in the analyses. Results used were the means obtained from experiments carried out in triplicate.
MVAs and data mining analyses
Lasso and ridge regression
Lasso and ridge regression were used to predict PC3 cell number based on the other variables studied. 7 Limitations of overfitting and multicollinearity were avoided using these multiple regression techniques. 7 Lasso regression is an example of multiple linear regression which conducts variable selection and regularisation to increase the prediction accuracy of the model. Regularisation involves adding a penalty to the coefficients of variables. In the case of lasso regression, it can shrink the coefficients to 0, and regularisation eliminates unimportant variables and makes the models sparser. 7 Adjusted R 2 and root mean square error (RMSE) values were generated. Lasso and ridge regression were carried out, and graphs were generated using the following code in R4.0.3:
library(readr)
df <-read_csv("Jazz90 PC3 cell MVA (1) updated.csv")
library(caret)
set.seed(1985)
index <- createDataPartition(df$Cell_Number, p=0.5, list=FALSE, time=1)
df<-as.data.frame(df)
train_df<-df[index,]
test_df<-df[-index,]
ctrlspecs<-trainControl(method="cv", number=2, savePredictions="all")
lambda_vector<-10^seq(5, -5, length=500)
set.seed(1985)
model1<-train, Cell_Number~.,data=train_df,preProcess=c("center","scale"), method="glmnet", tuneGrid=expand.grid(alpha= 1, lambda=lambda_vector), trControl=ctrlspecs,na.action=na.omit)
round(coef(model1$finalModel, model1$bestTune$lambda), 3)
varImp(model1)
ggplot(varImp(model1))
predictions1 <- predict(model1, newdata=test_df)
mod1perf<- data.frame(RMSE=RMSE(predictions1, test_df$Cell_Number), Rsquared=R2(predictions1, test_df$Cell_Number))
View(mod1perf)
As 2-fold cross-validation was used, the data were first partitioned into training (50%) and testing (50%) data sets. For lasso regression, alpha = 1, whereas alpha = 0 for ridge regression. 8 Before the analysis, cell number was determined to be normally distributed using the D’Agostino–Pearson normality test. Cell number was then predicted based on the identified variables in the testing data set. Root mean squared deviation (RMSD) and adjusted R 2 values were then determined.
Random forest classification
RFC is a supervised learning algorithm, which can be used to predict categorical variables. 9 Generally, it consists of 2 data sets, a training and a test data set, and therefore, the data have to be partitioned. 9 The training data set is used to train the model, and the model is then applied to a test data set to predict the categorial variable. 9 RFC trains the model by applying a flow-like series of questions to the variables (proteins) and constructs trees. RFC can construct hundreds or thousands of trees. Each of the trees generates its own decision and predicts whether the sample fits into a certain category. 9 The model from the training data set can then be cross-validated using the test data set, predicting, for example, whether the cells have been drug-treated or not. This confirms whether changes in the levels of the variables can or cannot predict an outcome. As different variables are used to construct the trees, RFC also reports the mean decrease in a Gini coefficient and mean decrease in accuracy. The higher the values of the mean decrease in accuracy or the mean decrease in Gini score, the greater the importance of the variable in the model. 9 Of note is that RFC is largely assumption-free, and therefore, it is a useful method if the data do not fit the General Linear Model (GLM) assumptions. Furthermore, simulation studies show that RFC can provide robust results even with high-dimensional data and small sample sizes.10,11
In our study, 500 trees were generated using a 3-variable split. The reason for using 500 trees was that the error decreased at around 200 trees, and therefore, 500 trees were considered sufficient. A 3-variable split was used because previous studies suggest that √(number of variables) is optimal. 11 The data set was split into a training data set (70% of the samples) and a test data set (30%). All RFC analyses were performed using R and Rattle, an R package. 12 In R, graphs of error as a function of the number of trees, ‘out-of-bag’ (OOB) receiver operating characteristic (ROC) curves and a list of predictor variables of importance were plotted.
Support vector machines
SVMs are a supervised learning model that can be used for classification analysis, which we have used in some of our previous studies. 13 Here, 2 forms of SVM include linear and non-linear. Linear SVMs can be used for data that can be described using a straight line, whereas non-linear SVMs can be used for data that cannot be separated using straight lines and require kernel factors. 14 Linear SVM was used to classify samples based on whether they were treated or not, as the data could be separated via a straight line into treated and untreated groups. To ensure that the model was effective, cross-validation was carried out. Therefore, the data were split into training (70%) and test (30%) sets, and the SVM model generated using the training data set was tested on the test data set. An advantage of SVM is that it does not make distributional assumptions except for the independence and similar distribution of the groups of data. 13 Therefore, even small sample sizes can provide accurate estimates even if there are a large number of variables. All SVM analyses were performed using R and Rattle.
Cluster analyses
CA is an example of a non-parametric statistical method that is used to assess the associations between independent variables without a predetermined dependent variable. 15 No assumptions about normality or homogeneity of the covariance matrices are made in CA. It uses measures of distance between variables, grouping them according to their degree of association. A hierarchical, Ward minimal linkage algorithm was used, along with the squared Euclidean distance, 15 based on our previous experience with CAs. 2 Thus, the clusters were formed based on the Minimisation of variance. 15 As the data for different variables were measured on different scales, the data were first converted to z scores. The results of CA can be represented on a dendrogram, in which variable similarity increases if the distance between them decreases. 15 SPSS 27 was used for CA.
Results
The association between different variables was tested using a Pearson’s Product Moment correlation coefficient, an example of a bivariate analysis (Figure 1). This test also determined the degree of multicollinearity between the variables. As expected, a significant positive correlation coefficient (r) of 0.99 (P < .001) was observed between HDAC inhibition and cell number for all of the drugs. In the case of Jazz90, cell number also correlated with acetylation of histone-3 (r = −0.75 [P < .01]), cell cycle p21 (r = −0.83 [P < .003]), p27 (r = −0.83 [P < .01]), cyclin D (r = 0.85 [P < .001]), pErk/Erk (r = 0.92 [P < .001]) and angiogenic (VEGF-A) (r = 0.83 [P < .01]) and (VEGFR-2) (r = 0.92 [P < .001]) proteins. Jazz167 correlation analysis showed that cell number also correlated with acetylation of histone-3 (r = −0.8 [P < .01]), cell cycle p27 (r = −0.87 [P < .001]), EMT transitioning (E-cadherin) (r = −0.81, [P < .01]), and angiogenic (VEGF-A) (r = 0.84 [P < .01]) and (VEGFR-2) (r = 0.91 [P < .001]) proteins. Results from SAHA, in comparison, showed that cell number was significantly correlated with acetylation of histone-3 (r = −0.95 [P < .001]) and cell cycle p21 (r = −0.95 [P < .001]), p27 (r = −0.86 [P < .01]), and cyclin D (r = 0.82 [P < .01]) proteins (Figure 1).
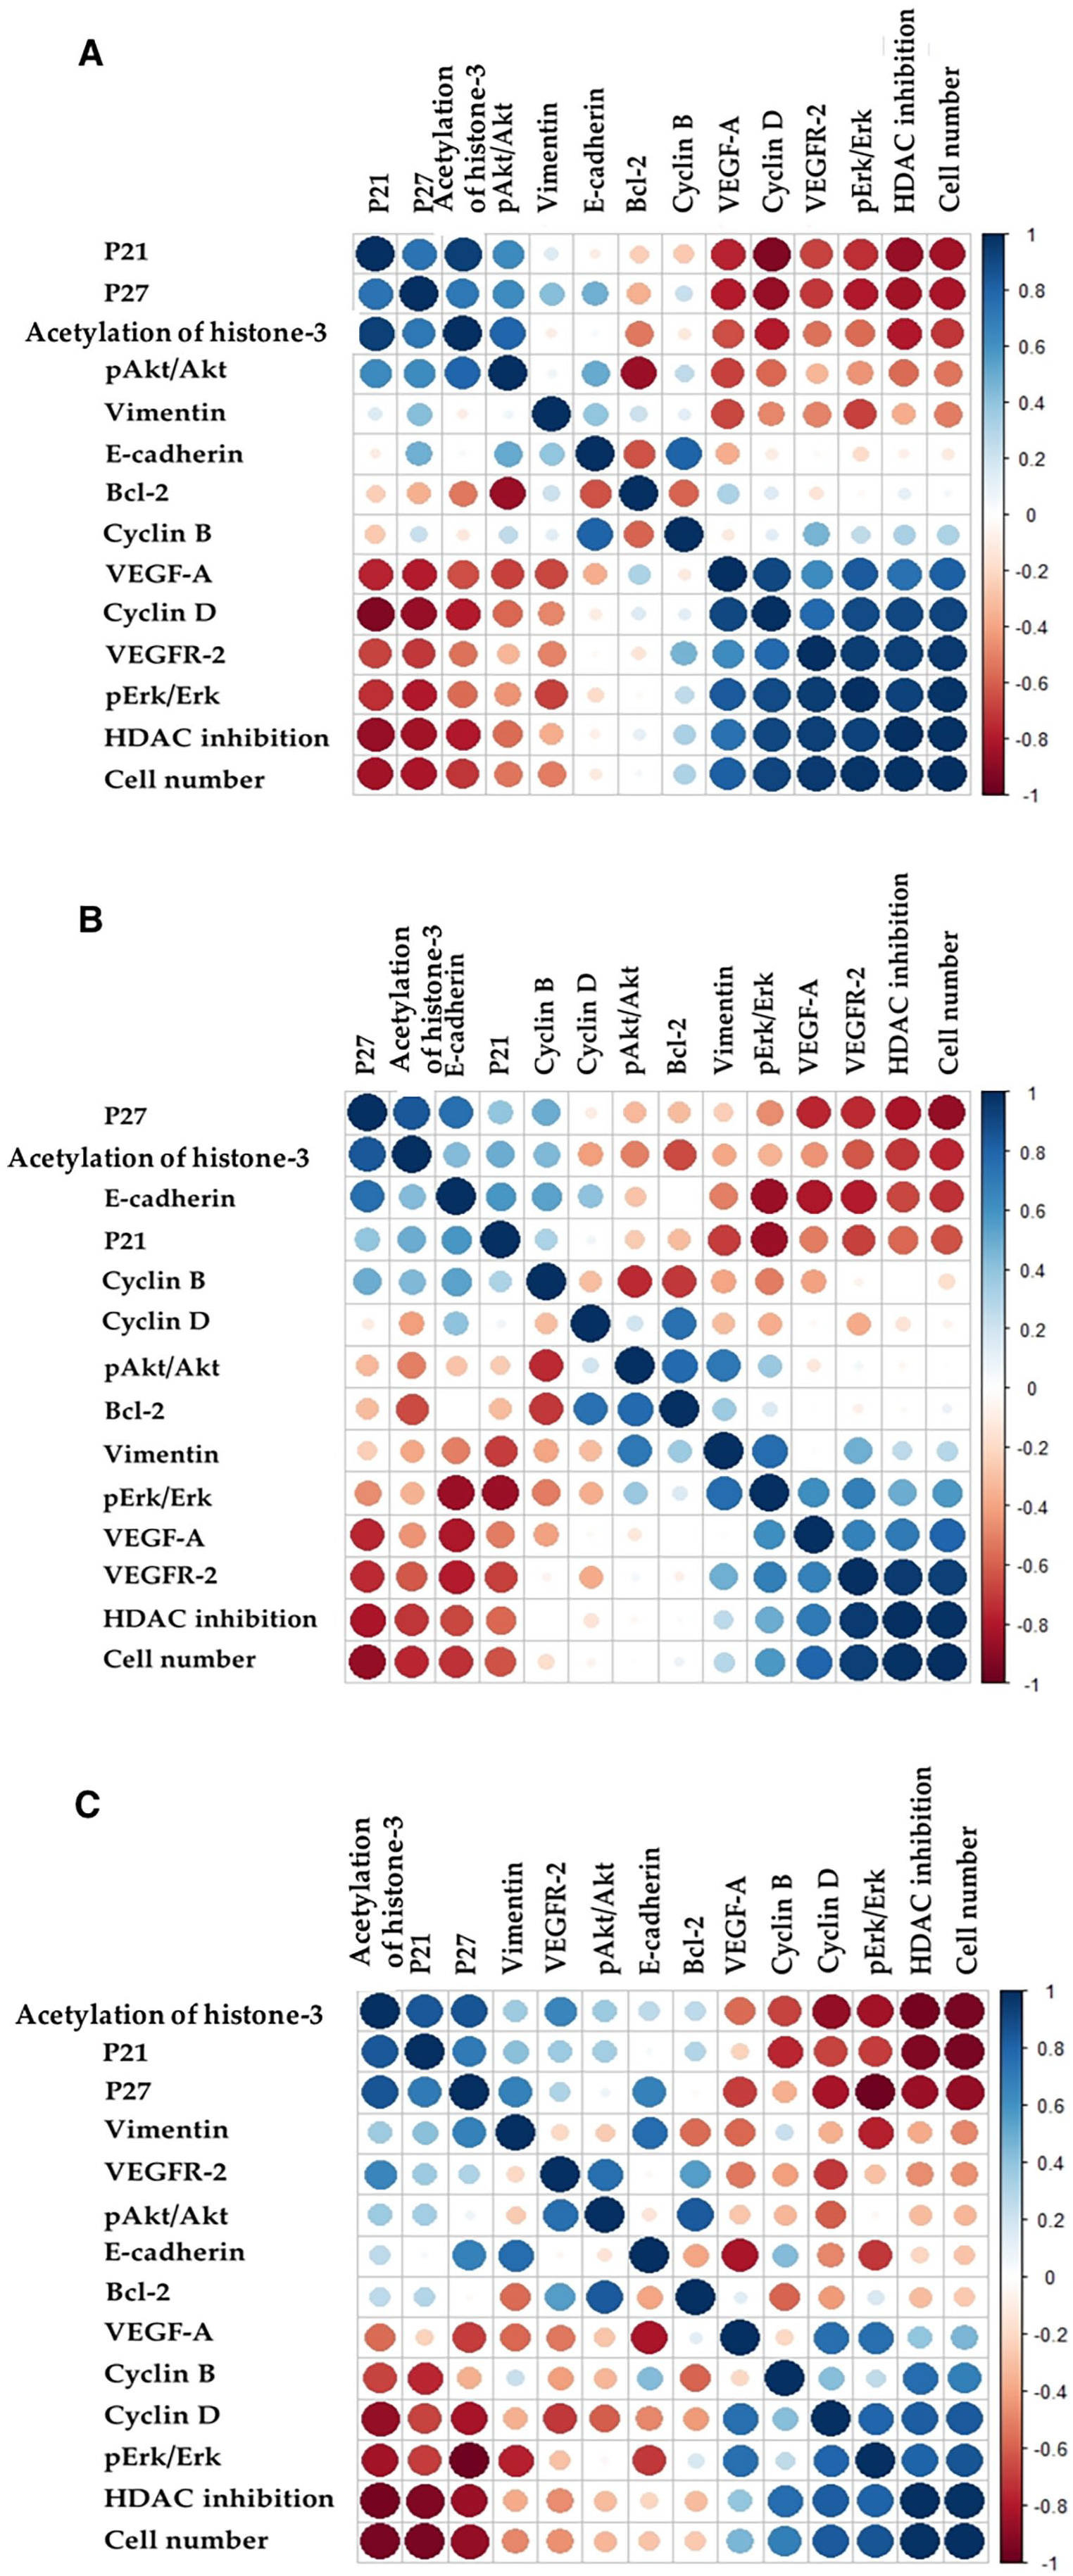
A Pearson Product Moment Correlation Coefficient matrix showing the relationship between variables relating to (A) Jazz90, (B) Jazz167, and (C) SAHA treatment. Positive correlations are shown in blue, negative correlations in red, and the size of the circle indicates the degree of the correlation.
As multicollinearity between the variables was high, lasso regression was used instead of general multiple linear regression to identify predictors for cell number, which were normally distributed. Lasso regression indicated that HDAC inhibition was the strongest predictor of cell number for all of the drugs (Figures 2, 3, and 4A). In the case of Jazz90, HDAC inhibition, VEGF-A, and VEGFR-2 predicted cell number with an adjusted R 2 value of 0.99, whereas VEGFR-2, HDAC inhibition, and acetylation of histone-3 predicted cell number with an adjusted R 2 value of 0.84 for Jazz167 (Figures 2 and 3A). In comparison, HDAC inhibition was the only predictor for cell number after SAHA treatment (Figure 4A). To determine the least important variables, ridge regression was used. In the case of Jazz90, E-cadherin was the least important followed by cyclin B and bcl-2, whereas for Jazz167, cyclin D and bcl-2 were the least important variables (Figures 2 and 3B). For SAHA, cyclin B followed by bcl-2 were the least important variables. The most important variables identified by ridge regression were similar to lasso regression (Figure 4B).

Lasso and ridge regression with 2-fold cross-validation for Jazz90. Plots depicting the importance of variables in predicting cell number were plotted for Jazz90. RMSE and adjusted R 2 values were generated from cross-validation used to test the model on a test data set.

Lasso and ridge regression with 2-fold cross-validation for Jazz167. Plots depicting the importance of variables in predicting cell number were plotted for Jazz167. RMSE and adjusted R 2 values were generated from cross-validation used to test the model on a test data set.

Lasso and ridge regression with 2-fold cross-validation for SAHA. Plots depicting the importance of variables in predicting cell number were plotted for SAHA. RMSE and adjusted R 2 values were generated from cross-validation used to test the model on a test data set.
To identify the importance of variables in predicting treated and untreated groups, RFC analysis was carried out (Figure 5). For Jazz90, acetylation of histone-3, cell cycle (p27, pErk/Erk, and p21), and angiogenic (VEGF-A) proteins were the most important variables as observed by the mean decrease in accuracy and Gini values. For Jazz167, angiogenic (VEGFR-2 and VEGF-A), and EMT (E-cadherin), proteins were identified as the most important proteins. In comparison, cell cycle proteins (p21 and p27) differentiated treated and untreated groups following SAHA treatment. RFC showed that EMT proteins were the least important variables for Jazz90 and SAHA treatment. For Jazz90 and SAHA, anti-apoptotic (Bcl-2 and pAkt/Akt) proteins were also identified as less important. Cell cycle proteins, cyclin D, and cyclin B, were the least important variables for Jazz167 treatment. Further analysis of the testing data set revealed that the model differentiated between the treated and untreated groups with 100% accuracy (Figure 5G to I) for all of the drugs. The RFC results were further supported by SVM analysis, which also predicted the treated and untreated data sets with 100% accuracy.

Rank order of the specific proteins critical to splitting data sets into treated and untreated groups. RFC of protein expression was conducted using R. Plots for mean decrease accuracy, which is the average measure of the decrease in accuracy in classifying groups if the variable is removed from the model, were plotted for (A) Jazz90, (D) Jazz167, and (G) SAHA. Plots for mean decrease Gini, a measure of the difference in split nodes over trees in the model for an individual variable, were computed for (B) Jazz90, (E) Jazz167, and (H) SAHA. OOB classification matrix for (C) Jazz90, (F) Jazz167, and (I) SAHA is shown.
The results of the hierarchical CA also showed that HDAC inhibition was closely associated with cell number for the drugs (Figure 6). However, CA also identified additional variables closely associated with cell number. For Jazz90, cell cycle proteins (cyclin D, cyclin B, and pErk/Erk) were identified in addition to angiogenic proteins, whereas angiogenic (VEGFR-2 and VEGF-A), cell cycle (pErk/Erk), and EMT (vimentin) proteins were identified for Jazz167. For SAHA, cell cycle proteins clustered closely with cell number. In the case of Jazz90 and SAHA, EMT proteins formed the most distant cluster from cell number and HDAC inhibition. In comparison, anti-apoptotic (pAkt/Akt and bcl-2) proteins formed a distant cluster from cell number for Jazz167 (Figure 6).
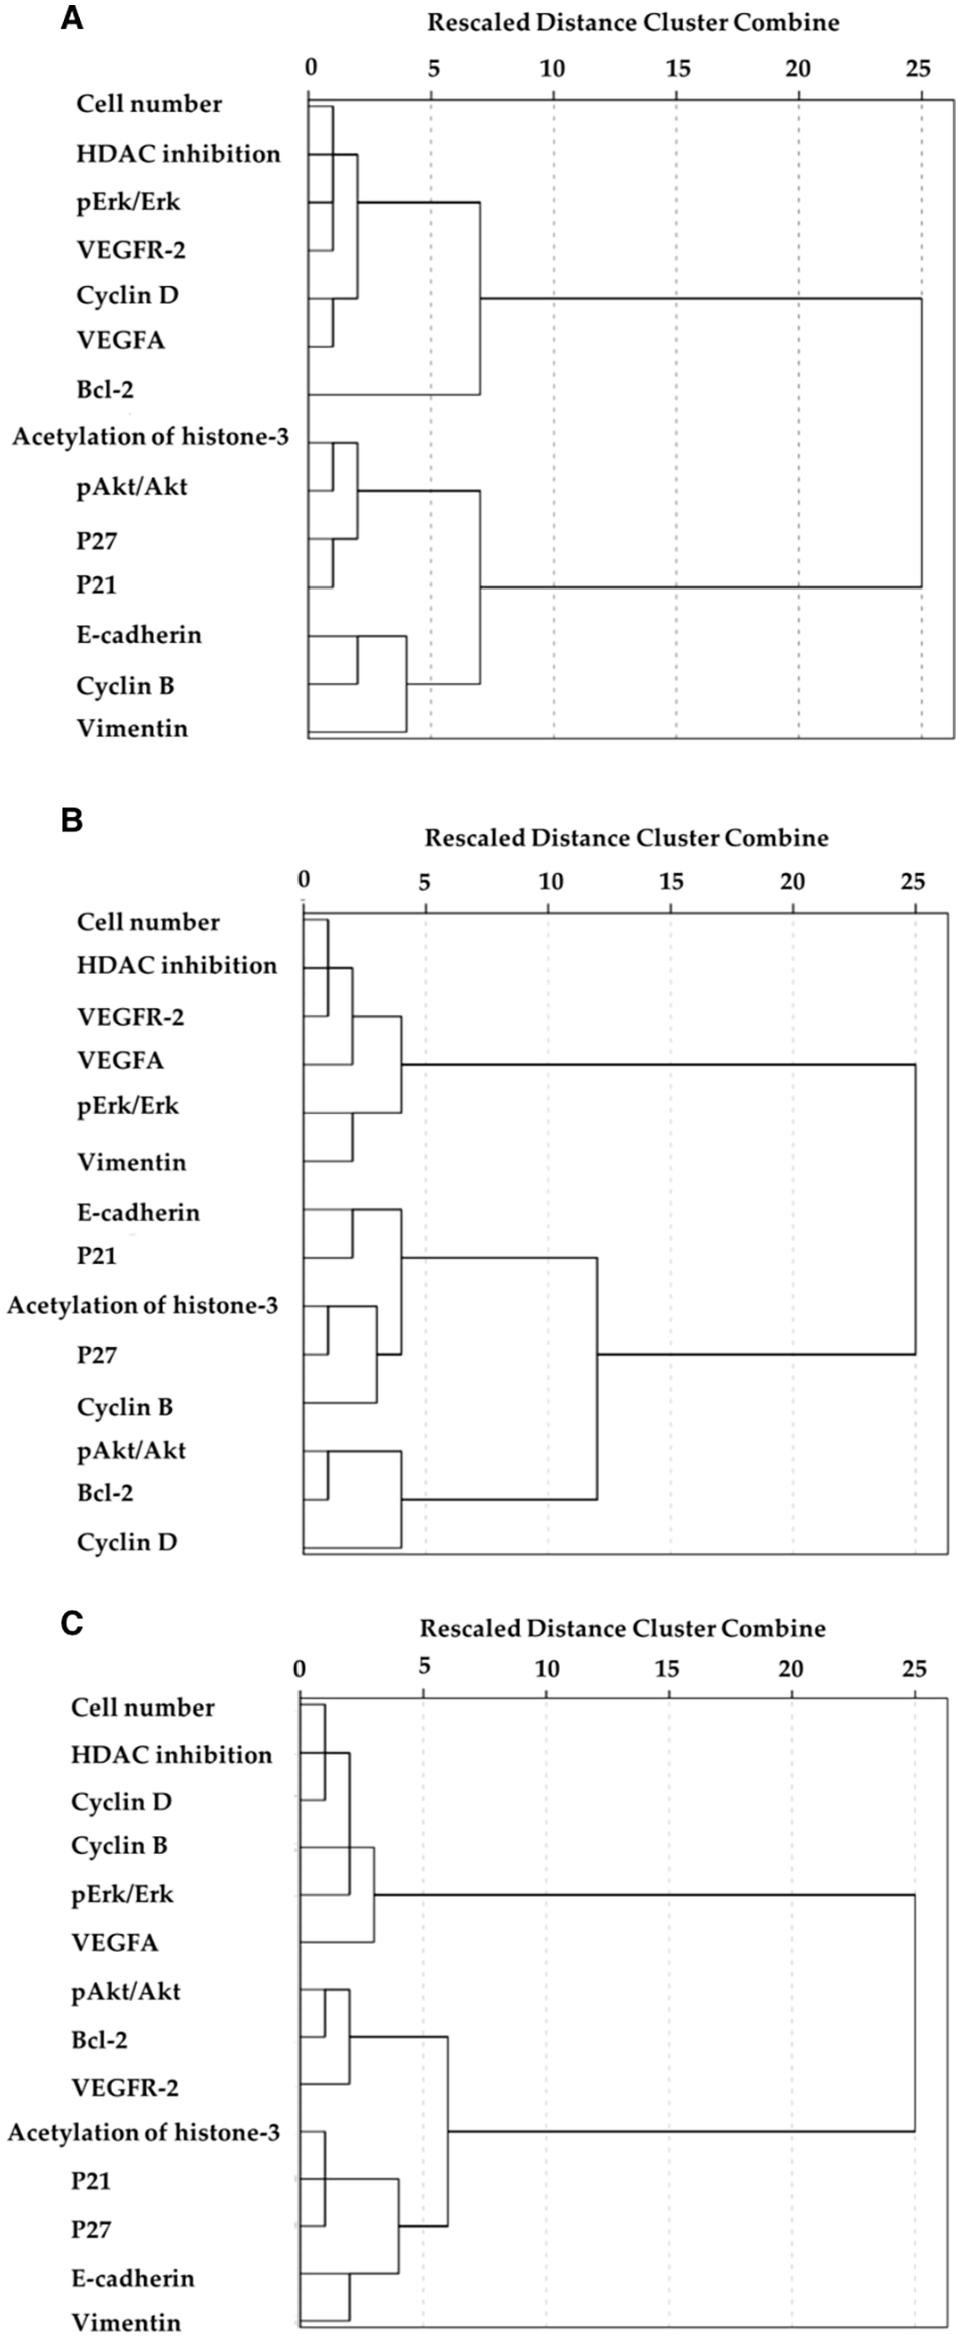
A dendrogram showing the clustering of variables following (A) Jazz90, (B) Jazz167, and (C) SAHA treatment. The hierarchical clustering of variables method was determined using the agglomerative Ward’s method and squared Euclidean distance.
Discussion
MVAs and data mining procedures are useful to study the interactions between systems of proteins and to develop biomarkers in cancers. This is possible because MVAs and data mining analyses determine the importance of a variable within a network of variables and how it may change relative to the other network components. Various other studies have used MVAs to identify the protein signatures of cancers. For example, Martey et al 2 used a variety of multivariate statistical methods to determine a protein signature (Ki67, PKC-α, PP2AA-β, and CaD1) that could be used to predict tumour growth in mice in response to a curcumin derivative encapsulated in a nanoparticle. Similarly, De Marchi et al 1 predicted tamoxifen response in breast cancer patients using 4 proteins (programmed cell death 4, cingulin, ovarian carcinoma immune-reactive antigen domain containing protein 1, and Ras-GTPase-activating protein-binding protein 2 proteins) identified by MVA analyses.
Recently, we showed that Jazz90 and Jazz167 are cytostatic HDAC inhibitors with an effect on angiogenic pathways in addition to inhibiting cell cycle arrest. MVAs were carried out to identify a protein signature that could predict cell number or whether the cells had been treated and drug efficacy. Despite inhibiting the same molecules, these drugs had different signatures. Lasso regression showed that HDAC inhibition, VEGF-A, and VEGFR-2 inhibition predicted cell number for Jazz90, whereas HDAC inhibition, VEGFR-2, and acetylation of histone-3 predicted it for Jazz167. In the case of SAHA, only HDAC inhibition was found to be predictive. RFC and CA further confirmed the importance of these angiogenic proteins in Jazz90- and Jazz167-treated prostate cancer cells. The anti-angiogenic effect of Jazz90 and Jazz167 may be attributed to their selective inhibition of HDAC6. 16 HDAC6 does not function via a histone-mediated pathway, instead it acts directly on non-histone proteins, such as VEGFR-2. On HDAC6 inhibition, acetylation of VEGFR-2 increases. This in turn degrades VEGFR-2 by a clathrin-dependent internalisation process. 17 Jazz90 and Jazz167 are 4-fold more potent at inhibiting HDAC6 in comparison to SAHA. 16 High expression of VEGF-A and VEGFR-2 is also associated with a poor prognosis in prostate cancer; therefore, inhibition of these molecules may be associated with a better outcome for patients. 18 Of note, no VEGF-A and VEGFR-2 inhibitors are available for prostate cancer treatment. 18 Despite undergoing clinical trials, VEGF-A and VEGFR-2 inhibitors, such as bevacizumab and sunitinib, have exhibited toxicity. 18 Since Jazz90 and Jazz167 were not toxic in BALB/c mice, they may be useful candidates for further efficacy testing for angiogenic pathways in vivo.
Acetylation of histone-3 was identified as the strongest predictor of cell number in response to Jazz167 treatment using lasso regression. Previously, Hanif et al 16 also showed that Jazz167 was 10-fold more potent at inhibiting a nuclear HDAC (HDAC1) in comparison to SAHA. Therefore, a genome-wide chromatin immunoprecipitation analysis needs to be conducted to understand the interactions between different acetylated regions of histone-3 and promoters of tumour suppressor genes, such as p21 and p27. 19 This is critical because prostate cancer is marked by hypoacetylation at sites, lysine 9 (H3K9), lysine 14 (H3K14), lysine 18 (H3K18), and lysine 23 (H3K23), on histone-3. 20 In turn, the inter-relatedness of the different genes identified can then be evaluated using the Ingenuity Pathway Analysis (IPA) software tool. Thus, these experiments will yield additional targets.
MVAs and data mining analyses are also useful to identify interactions between different signalling pathways. Cancers, in particular, involve interactions between a complex network of signalling pathways. For example, pathways involved in angiogenesis, EMT, proliferation, and survival have been linked together. The complexity is further increased by proteins assuming dual roles.21-23 For this reason, the correlation of VEGF-A and VEGFR-2 with cell number is a surprising finding because these angiogenic markers are generally associated with endothelial tube formation and migration. 24 However, their role in proliferation and survival has been assessed in other cancers, such as ovarian and colorectal cancer, but they have not been tested in PC3 cells. 23 Therefore, the results from MVAs indicate that knockdown studies of VEGF-A and VEGFR-2 to elucidate their role of proliferation in PC3 cells should be conducted. Previous reports have also suggested that p21 and p27 are involved in migration in addition to regulating the cell cycle.21,22 Although p21, p27, acetylation of histone-3, and cyclin B clustered closely with E-cadherin in Jazz167-treated cells, the Pearson’s correlation analysis and RFC showed that p27 and E-cadherin were closely linked. Therefore, the interaction between p27 and E-cadherin needs to be investigated further in Jazz167-treated cells, especially because p27 has been linked to migration in the past.22,25
Another benefit of using MVA is the potential to identify viable drug combinations. Combination treatments are critical in cancer because proliferating cancer cells can acquire resistance to single target agents. 26 Previously, we showed that Jazz90 and Jazz167 are cytostatic drugs and were non-toxic in BALB/c mice at doses as high as 75 mg/kg 3 and, therefore, are good candidates for use in combination with other agents. Since all the proteins analysed in the study significantly predict the prognosis in prostate cancer patients and function in different pathways,18,27,28 the least important proteins in our analyses should be targeted in combination with Jazz90 and Jazz167. For Jazz90, EMT transitioning proteins did not associate with cell number or treatment. Various FDA approved drugs, such as simvastatin and olaparib, have been shown to inhibit the EMT transitioning process. 29 Thus, further investigation should be carried out for these drugs in combination with Jazz90. In contrast, anti-apoptotic (bcl-2 and pAkt/Akt) and cell cycle proteins did not associate with cell number or treatment for Jazz167. Therefore, Jazz167 should be tested in combination with venetoclax or navitoclax, inhibitors of anti-apoptotic proteins, in PC3 cells. 30
One limitation of this study is that it was restricted to only 1 cell line, PC3 cells. However, we do not believe that this limitation undermines the demonstration of the utility of using MVAs and data mining analyses in an effort to understand the interaction of different cell signalling pathways in the development of cancer. First, very recently, others have shown that some of the same or similar methods that we used, such as CA, multiple regression, and linear discriminant analysis, can be useful in studying hepatocellular carcinoma cell lines, 31 head and neck squamous cell carcinoma (HNSCC) cell lines, 32 and nasopharyngeal carcinoma cell lines. 33 Therefore, based on these studies, and the general principles of MVAs and data mining procedures, it is very unlikely that these methods are applicable only to PC3 cell lines. Second, the aim of this study was not to investigate the utility of these analytic methods across a multitude of cell lines, but to illustrate how they might be used to discover how cell signalling pathways interact and form a protein signature in response to certain drug treatments.
Conclusions
Overall, our study shows the usefulness of MVAs and data mining analyses in highlighting the key mechanisms via which drugs act, in determining combination treatments and predicting the dual roles via which proteins act in different signalling pathways in in vitro cancer studies. MVAs and data mining analyses identified a protein signature and suggested combination treatments for Jazz90 and Jazz167 in PC3 cells. Jazz90 and Jazz167 were found to act via an angiogenic marker (VEGFR-2), which predicted cell number with adjusted R 2 values of 0.99 and 0.84, respectively. Based on the results from MVA, further studies in PC3 cells can be used to understand the role of VEGF-A and VEGFR-2 in the proliferation of PC3 cells, as the role of these markers in proliferation remains unclear. MVAs also suggested that the combination of Jazz90 with EMT inhibitors, such as olaparib and simvastatin, may be useful, whereas Jazz167 can be tested in combination with bcl-2 inhibitors, such as venetoclax or navitoclax.
Footnotes
Funding:
The author(s) received no financial support for the research, authorship, and/or publication of this article.
Declaration Of Conflicting Interests:
The author(s) declared no potential conflicts of interest with respect to the research, authorship, and/or publication of this article.
Author Contributions
Project conception: RR; Collection of original data: ZR; Formal statistical analyses: ZR and PFS; Writing of manuscript: ZR and PFS; Manuscript editing: ZR, PFS and RR; Approval of final manuscript: all authors.
Data Availability Statement
The data that support the findings of this study are available from the corresponding author on request.