
Abstract
Neutrophils are a type of white blood cell essential for the function of the innate immune system. To elucidate mechanisms of neutrophil biology, many studies are performed in vertebrate animal model systems. In Danio rerio (zebrafish), in vivo imaging of neutrophils is possible due to transgenic strains that possess fluorescently labeled leukocytes. However, due to the relative abundance of neutrophils, the counting process is laborious and subjective. In this article, we propose the use of a custom trained “you only look once” (YOLO) machine learning algorithm to automate the identification and counting of fluorescently labeled neutrophils in zebrafish. Using this model, we found the correlation coefficient between human counting and the model equals r = 0.8207 with an 8.65% percent error, while variation among human counters was 5% to 12%. Importantly, the model was able to correctly validate results of a previously published article that quantitated neutrophils manually. While the accuracy can be further improved, this model notably achieves these results in mere minutes compared with hours via standard manual counting protocols and can be performed by anyone with basic programming knowledge. It further supports the use of deep learning models for high throughput analysis of fluorescently labeled blood cells in the zebrafish model system.
Introduction
Neutrophils play a critical role in an organism’s immune response following bacterial infections, phagocytosing invaders, and initiating more complex immune responses. 1 However, the complete mechanism of neutrophil production, homeostasis, and functional regulation remains largely enigmatic. To gain further insight, scientists use Danio rerio (zebrafish) to study neutrophils. This animal model is used for several reasons. First, zebrafish embryos are transparent and develop ex utero, allowing manipulation and visualization of early embryonic processes like hematopoiesis (blood development). Zebrafish are also extremely fecund, allowing large sample sizes to be obtained for studies very quickly. Finally, their genome has been well characterized, and zebrafish share many essential molecular pathways with other vertebrates like humans. Importantly, many transgenic lines of zebrafish exist, whereby blood-specific promoters drive fluorescent protein expression in different cell populations. One example of a widely used transgenic zebrafish model is the mpx: EGFP (enhanced green fluorescent protein) line that has the neutrophil-specific myeloid-specific peroxidase promoter driving green fluorescent protein (GFP) expression in neutrophils allowing real-time visualization under a fluorescent microscope.2-4 However, neutrophils are the most common leukocyte, so the quantification process is laborious and error prone. Therefore, we sought to develop a machine learning algorithm to offer an unbiased, consistent method to perform counting neutrophils.
The use of deep learning models in biomedical research has grown over the past years. Prior studies have applied convolutional neural networks (CNNs) and related artificial intelligence frameworks for tasks ranging from breast cancer tumor size prediction 5 to pathology detection from radiograph chest images. 6 Using these methods to rapidly identify phenotypes in zebrafish would be useful for researchers in many fields. Convolutional neural network models were previously developed to classify zebrafish defects following exposure to toxic substances. 7 Similarly, a deep learning classifier was used on a mere 84 whole-body image (pre-augmentation) for high-throughput classification of zebrafish bodily deformations. 8 However, very little research has been performed to rapidly quantify fluorescently labeled blood cells. Typical methods include photo/video processing combined with binary thresholding, 9 but these attempts are limited in cases of images with background artifacts or unfavorable lighting conditions. In addition, they require significant algorithmic parameter tuning which can lead to varying results depending on the observer and data collection method. While other procedures such as flow cytometry exist to accurately quantitate these cells, that process is time-consuming if the cells are tissue-resident, because the animals must be made into single-cell suspensions through chemical or physical means before being quantitated on a flow cytometer, 10 which is an expensive piece of equipment for many laboratories. That process is also somewhat difficult to automate, so it is not optimized for large-scale screening methodologies. As such, automated machine-aided counting methodologies should allow for rapid, consistent, and accurate cell counts.
While neural network–based methods exist, most of the programs are either too restrictive or overly general. For example, software packages such as “CellProfiler” use deep learning methods for cell counting and segmentation tasks. 11 However, these models restrict users to the pretrained dataset so they limit application of such methods in niche fields such as zebrafish fluorescent blood cell counting. A more general framework recently developed is an encoder–decoder style “U-Net” fully deep-learning framework that performs both cell detection and segmentation. 12 While it can be adapted to work with the ImageJ plugin, a widely used biological image processing software, it still is too general for use for most applications. Due to these issues, there is a need for deep learning models to be specifically developed for laboratory niche–specific purposes such as enumerating fluorescent blood cells.
To address these issues, we trained a “you only look once” (YOLO) deep learning framework to detect and count fluorescently tagged mpx: GFP cells in zebrafish. The reasons for this were multiple. We hypothesized that we could build a user-friendly framework and it would count cells quickly, consistently, and in an unbiased manner. We also hypothesized that once trained, the framework could look at images from different microscopes, at different magnifications, with different image quality and backgrounds, of different tissues, and still accurately identify fluorescent cells. In this article, we validate that the model is able to accurately count fluorescent cells by comparing counts with that done by multiple humans. Importantly, we used it to verify the results of a prior published study. 13 Finally, we show that this technique can be used on images obtained from different microscopes, different cameras, and different tissues of zebrafish, indicating that it is widely useful for multiple different assays. In short, the modified YOLO framework presented here should help laboratories that routinely quantitate fluorescently labeled blood cells perform their work more accurately and quickly. This development would especially help those trying to automate and perform large-scale screens on zebrafish.
Materials and Methods
Zebrafish husbandry and care
Zebrafish were mated, staged, and raised as described 14 and maintained in accordance with California State University, Chico (CSUC) Institutional Animal Care and Use Committee (IACUC) guidelines. All procedures were approved by the CSUC IACUC before being performed. Personnel were trained in animal care by taking the online Citi Program training course titled “Working With Zebrafish (Danio rerio) in Research Settings” (https://www.citiprogram.org). mpx: EGFP 2 fish were used for these studies. Zebrafish were housed in a 700 L recirculating zebrafish aquarium system (Aquatic Enterprises, Seattle, WA) regulated by a Profilux 3 Outdoor module that regulated salinity, pH, and temperature (GHL International, Kaiserslautern, Germany) 24 hours a day. The facility was illuminated on a 14 hour light/10 hour dark cycle. Zebrafish were fed once a day with hatched brine shrimp (Brine Shrimp Direct, Ogden, UT) and once a day with Gemma micro 300 (Skretting, Westbrook, ME). After experiments were performed, all animals were returned to the aquarium system to be used for further research.
Data collection and labeling
Due to the novelty of this task, we had to create a custom-labeled dataset. We used a Leica FireCam camera (Leica, Wetzlar, Germany) to capture 110 images of zebrafish with fluorescent mpx: GFP+ cells. Imaging occurred over several days so these zebrafish images varied in lighting conditions and orientation. This probable sampling method reflects the limited data availability required for the training of this model. Following data collection, individual mpx: GFP+ cells in the zebrafish were labeled using labeling software (lablelimg; https://pypi.org/project/labelImg/1.4.0/) by multiple independent undergraduate laboratory students to reduce bias. In addition, 20 images of zebrafish without mpx: GFP+ cells were also imaged to include negative controls (images with no bounding boxes) in the training process. For training purposes, all images had standard image quality and conditions to observe mpx: GFP fluorescent cells in zebrafish. As such, no outliers were included in our dataset.
Data augmentation
Object detection performance improves with a larger dataset. However, due to limited data availability as described above, we used image augmentation software to artificially increase the training sample size. We implemented vertical and horizontal flips, 90° rotations, hue increases, and average blurring. 15 The final dataset size was 770 images, with 700 images in the training set and 70 images in the test set. These training and test sets were augmented separately to ensure that no test images were used for training. A similar augmentation process was also done for mpx: GFP– zebrafish images; in total 200 negative image samples were used.
“You only look once”
Our model uses the preexisting YOLO framework; YOLO is an object detection algorithm that can predict bounding boxes and class probabilities of objects (“cell”) in an image in a single forward propagation step. The version 3 (YOLOv3) trained in this experiment consists of a 53-layer feature extractor (Darknet-53) followed by 53 layers of functions that upsample, concatenate, and resize images for detection at 3 different scales.
The algorithm begins by dividing the input image of mpx: GFP zebrafish into S × S grid cells. Each grid cell must predict “B” number of bounding boxes and “C” number of class probabilities if an object center falls inside that grid cell. After this process is complete, a 3-dimensional (3D) tensor of shape (S, S, [B × 5 + C]) is output. In this shape, S represents the number of grid cells the image is divided into; with an image of size 416 × 416 pixels, this value is 13, 26, and 52. There are 3 values because YOLOv3 performs detections at 3 scales to detect objects of varying sizes. B depends on the number of bounding boxes predicted per cell; in this case, B = 3. 5 refers to the 5 values associated with each bounding box: bx (x coordinate of counting box), by (y coordinate of the bounding box), bh (height of the bounding box), bw (width of the bounding box), and a confidence value (the algorithm’s confidence that an object exists within a particular box). The last value C refers to the number of classes (ie, “cell”), which equals C = 1. With detections at 3 different scales and 3 bounding boxes detected per grid cell, the final tensor output is of shape ([13 × 13] + [26 × 26] + [52 × 52], [3 × 5 + 1]).
Model performance evaluation metrics
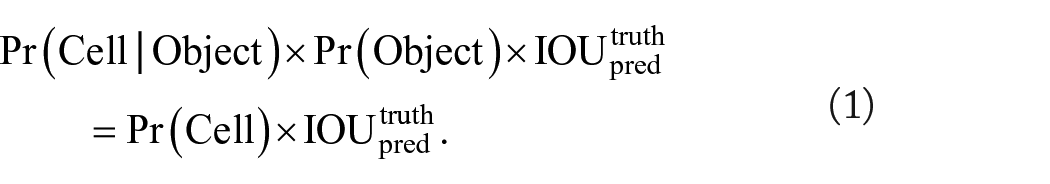
Although YOLO produces a large tensor output, not every single prediction represents a correct bounding box. To address this issue, YOLO uses the idea of confidence thresholding (Equation 1) and non-max suppression (NMS) to determine the most probable bounding box encompassing the object (ie, “cell”). The ideal NMS threshold for this model was set via precision/recall curve analysis on the testing dataset across a multitude of thresholds.
In addition to NMS thresholding, we further manipulated the final boxes that were displayed and counted by adjusting the model’s Intersection Over Union (IOU) threshold. This allowed for the retention of non-overlapping bounding boxes for a single cell. If the threshold is set too high, then the model risks artificially lowering the number of detections, or vice versa if the threshold is too low. To find the ideal threshold value, correlation coefficient analysis was performed comparing human counts with the model’s predictions of total cell counts across various thresholds (Table 1).
Optimal threshold determination via correlation coefficient analysis.
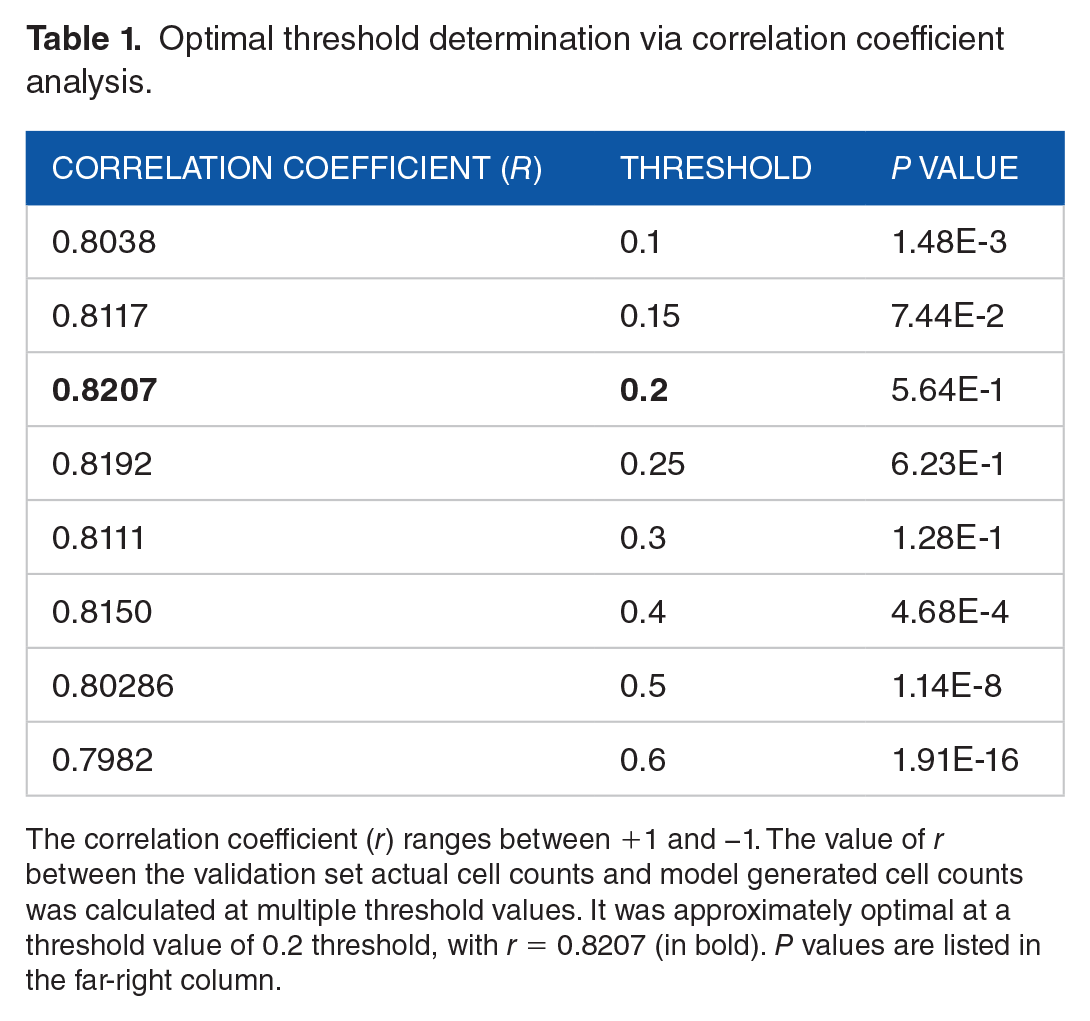
The correlation coefficient (r) ranges between +1 and −1. The value of r between the validation set actual cell counts and model generated cell counts was calculated at multiple threshold values. It was approximately optimal at a threshold value of 0.2 threshold, with r = 0.8207 (in bold). P values are listed in the far-right column.
The standard machine learning metric values for true positive, false positive, recall, precision, F1, Average Precision (AP), and percent error, were calculated to find this ideal threshold NMS and IOU and evaluate to its subsequent performance (see “Results”).
Training YOLO
The YOLOv3 algorithm was initially configured to predict 80 different classes. For the purposes of this study, we only wanted to detect 1 class (“cell”). To make this change, we had to modify the configuration file in the following manner:
The [YOLO] layers had “classes” set to 80; we changed this value to 1.
In changing the class value, we also had to adjust the filter value on the convolutional layers that preceded each [YOLO] layer The number of filters equals the product of the number of anchor boxes and number of classes plus 5, as explained in the original YOLO implementation manuscript.
16
In this case, anchor boxes = 3, classes = 1, and number of filters = 18 (Equation 2).
To train the model, 700 mpx: GFP+ zebrafish images were used as previously described. This implementation of YOLOv3 does not require the 70 testing dataset images during the training period. Weights were adjusted based on the Adam optimization stochastic gradient descent algorithm with momentum (SGDM) and backpropagation. The learning rate hyperparameter was set to 1E-3 for the first 1000 training iterations and lowered to 1E-5 following 2000 iterations to improve model convergence. The weights from 3000 iterations were used for the final model as loss failed to decrease beyond 10.46. Adjustment of parameters, NMS threshold, and IOU for final output occurred following training.

All training of the neural network occurred on a web-based Google Colab server with a single 12 GB NVIDIA Tesla K80 GPU over a timespan of approximately 12 hours.
Statistical methods
Statistical analyses were performed in Microsoft Excel for Mac, version 16.49. To discern statistical difference, data were analyzed using an unpaired 2-tailed Student’s T test assuming unequal variance. All raw data from these studies are supplied in Supplemental Material.
The YOLO framework
The full YOLO framework explained in this article can be found at https://github.com/sthapa320/darknet
Predicting optimal threshold
The YOLO framework outputs the final bounding boxes around the objects (ie, “cell”) based on the confidence score equation described earlier. In short, boxes with low confidence were removed and those with high confidence were displayed. In addition, one can further manipulate what is finally displayed by adjusting the model’s threshold. However, if the threshold is set too high, then the model may artificially lower the number of detections or vice versa if the threshold is too low. To find the ideal threshold value, we used the correlation coefficient equation to compare human counts with the model’s predictions of total cell counts and selected the final threshold to be 0.20, in which r = 0.8512. (Table 1).
Results
To evaluate our model and its ability to detect and enumerate mpx: GFP+ cells, we first uploaded 70 unseen images (images not used to train the model) with fluorescent cells (Figure 1A) to serve as the validation dataset. We used the trained YOLO model to detect neutrophils on images with no prior preprocessing (Figure 1B), and recorded the total number of neutrophils in each image for further analysis (Figure 1C).
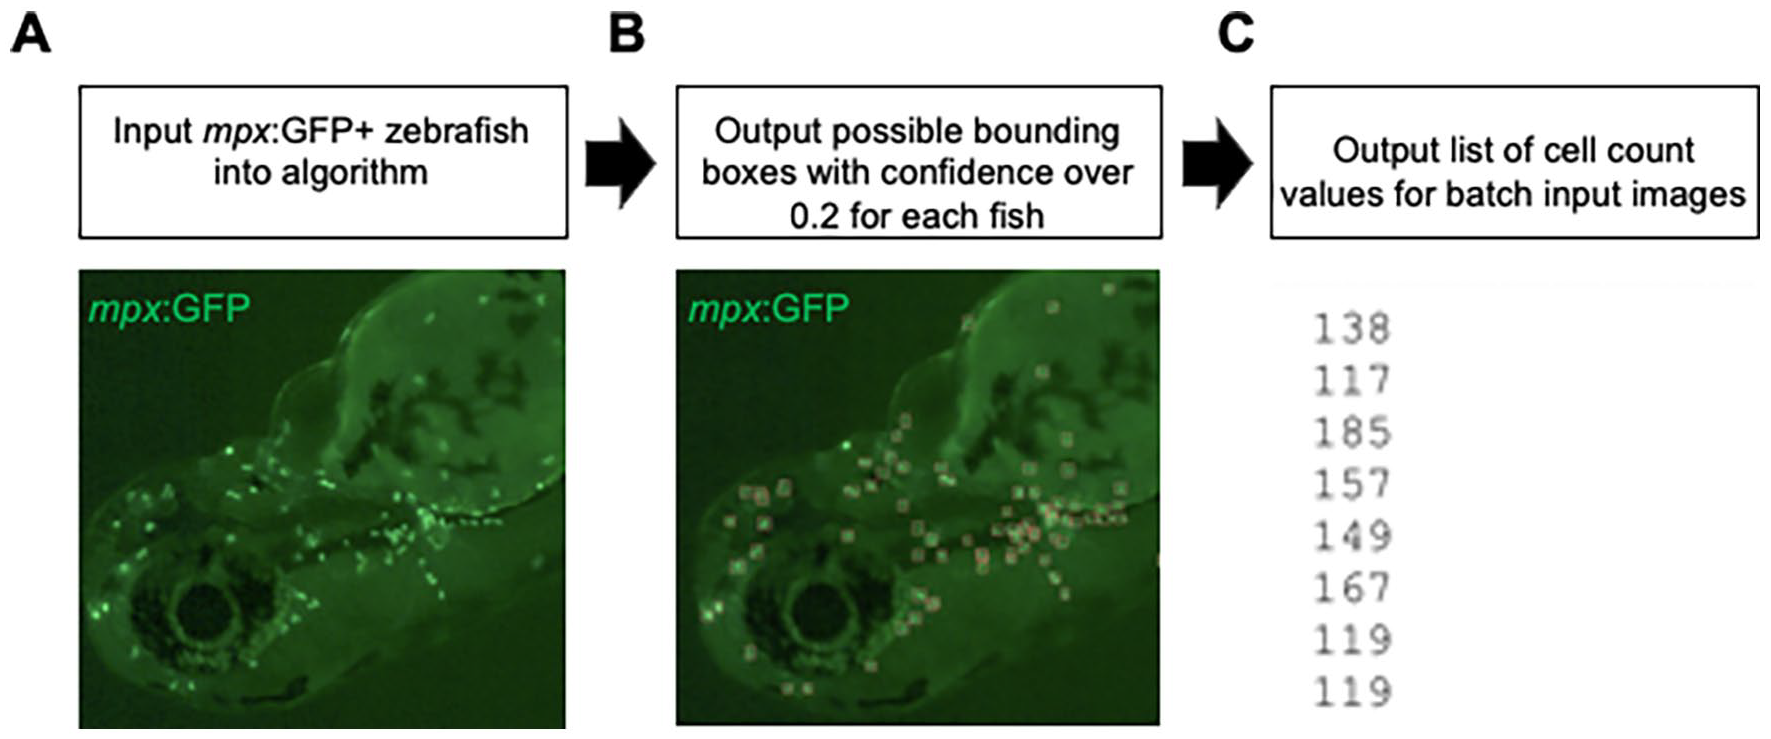
Neutrophil detection and enumeration workflow. (A) Batch images of zebrafish with mpx: GFP+ cells are uploaded. (B) Each image is processed through the custom-trained YOLO model with a threshold confidence of 0.2 for detection. (C) The total cell count per fish is output in a text file for further analysis via other statistical software. A folder containing all labeled images is also available for manual verification of the model’s output.
We measured the performance of our model in 3 ways. First, we determined the model’s ability to classify and identify objects based on standard machine learning metrics of precision and recall at a threshold of 0.20 under ideal NMS and IOU thresholds (Figure 1). Second, we determined percent error between model and human labeling in counting the total number of cells in the validation dataset. Finally, we confirmed the model’s robustness by processing images from a previously published study and comparing the results. We also processed various images from external sources.
Standard machine learning metrics
Through precision-recall curve analysis, we determined NMS confidence threshold to be optimal at 0.30 (Figure S1 in the Supplemental Material). In addition, we used correlation coefficient analysis to determine the optimal IOU thresholding level, which yields the fewest false positives and removes duplicating bounding boxes for the same cell (Table 1). This optimal IOU value was 0.20, with a correlation coefficient of 0.8207 between the human-labeled and computer-labeled data. In addition, the P value at this IOU threshold is 5.64E-1 for a 2-tailed T test assuming unequal variance. The null hypothesis assumes no difference between the computer-generated values and true human-determined values, with a significance level of .05. With the P value of 5.64E-1 at the IOU of 0.20, we fail to reject the null hypothesis and conclude the computer counts and human-determined count values have no statistical difference. Lower IOU thresholds (0.1-0.15) and higher IOU thresholds (0.2-0.6) yield correlation coefficient values around 0.8 (comparable with our optimal value of 0.2), but the calculated P values for these thresholds indicate statistical difference (Table 1).
Summarized in Table 2, at the confidence threshold of 0.30 and IOU of 0.20, the precision was 0.80, which means that when the model predicts a cell bounding box, it is correct 80% of the time (Equation 3). The recall value was 0.87, indicating that the model accurately identifies and bounds 87% of all cells in the validation image dataset (Equation 4). The harmonic mean (F1), a single number summary statistic of precision and recall, was 0.84 (Equation 5). The overall average precision for recall value over 0 to 1 was 85.52% (Table 2). Given these parameters, it is clear our YOLO model effectively marks neutrophils and can count the numbers present in each fish (Figure 1).


Model performance.

The confidence threshold was set at 0.3 and the IOU threshold was set at 0.2, allowing for calculations for percent error, number of true positive/negative cell counts, and other standard machine learning metrics for model performance. Abbreviations: AP, average precision; FP, false positive; IOU, Intersection Over Union; TP, true positive.
Standard accuracy
Using the confidence threshold value of 0.30 and IOU threshold of 0.20 as described above, we calculated the counting accuracy of our model by comparing the total number of ground truth cells (labeled cells) and the total number of estimated cells in the validation dataset; the model counted 8579 cells total, while humans counted 7896 cells total across 70 images. The percent error of the model, in comparison with true labels, measured 8.65% (Table 2). At first, there appeared to be an overestimation of cell count occurring. However, on closer observation, it was determined that the model advantageously counted some cells originally missed or miscounted by humans (Figure 2).
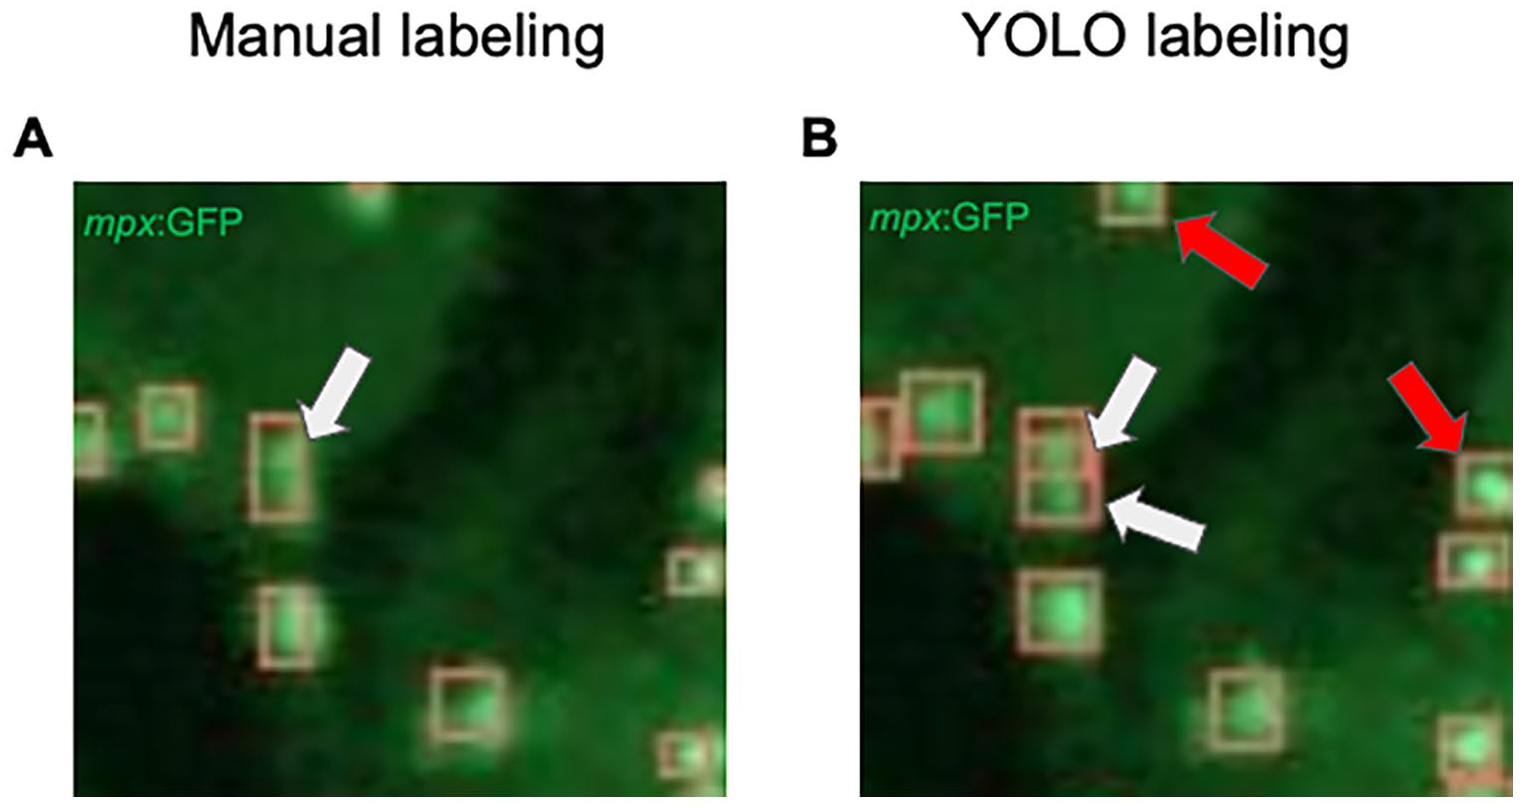
Model advantageously “overestimates” the number of mpx: GFP+ cells. (A) mpx: GFP cells in 48 hpf embryos were manually labeled by students in the laboratory. The white arrow points to a box which indicates a single cell when 2 actually exist. (B) These cell detections were output by the YOLO model. The white arrows indicate 2 boxes that separate 2 cells. The YOLO model detects cells in blurry regions and separates them into multiple individual cells, rather than a large single cell, leading to differences in cell count. Also note that YOLO detects cells not identified manually (red arrows).
General robustness
Finally, we predicted our model could validate a previous study in which only human observers manually counted the total number of mpx: GFP+ cells per zebrafish. In that study, single-cell-stage embryos were either left to develop normally or injected with a morpholino against the transcript for ism1. Rescuing this knockdown with the addition of the gene’s mRNA is a common way to rescue that reduction. That study determined that reduction in ism1 caused a reduction in neutrophils in the developing embryo. 13 At 48 hours post fertilization (hpf), mpx: GFP cells were enumerated manually for each experimental setup (Figure 3A). Applying our model, we saw similar trends (Figure 3B). The exact count values differ, but the trend is upheld. In addition, the data are still statistically significant, although the P values vary. Importantly, the data are still significant, and it appears that the model is even more stringent than human counting. Of interest is that the model performed the counting of the same images in minutes, while the data obtained for Figure 3A took hours. To validate the data in Figure 3A, usually multiple students would count the data blinded to the experimental setup. In this way, the model really reduced our time to interpret data from days to minutes. And, there was no need to “blind” the computer; it was not biased in its neutrophil detection.
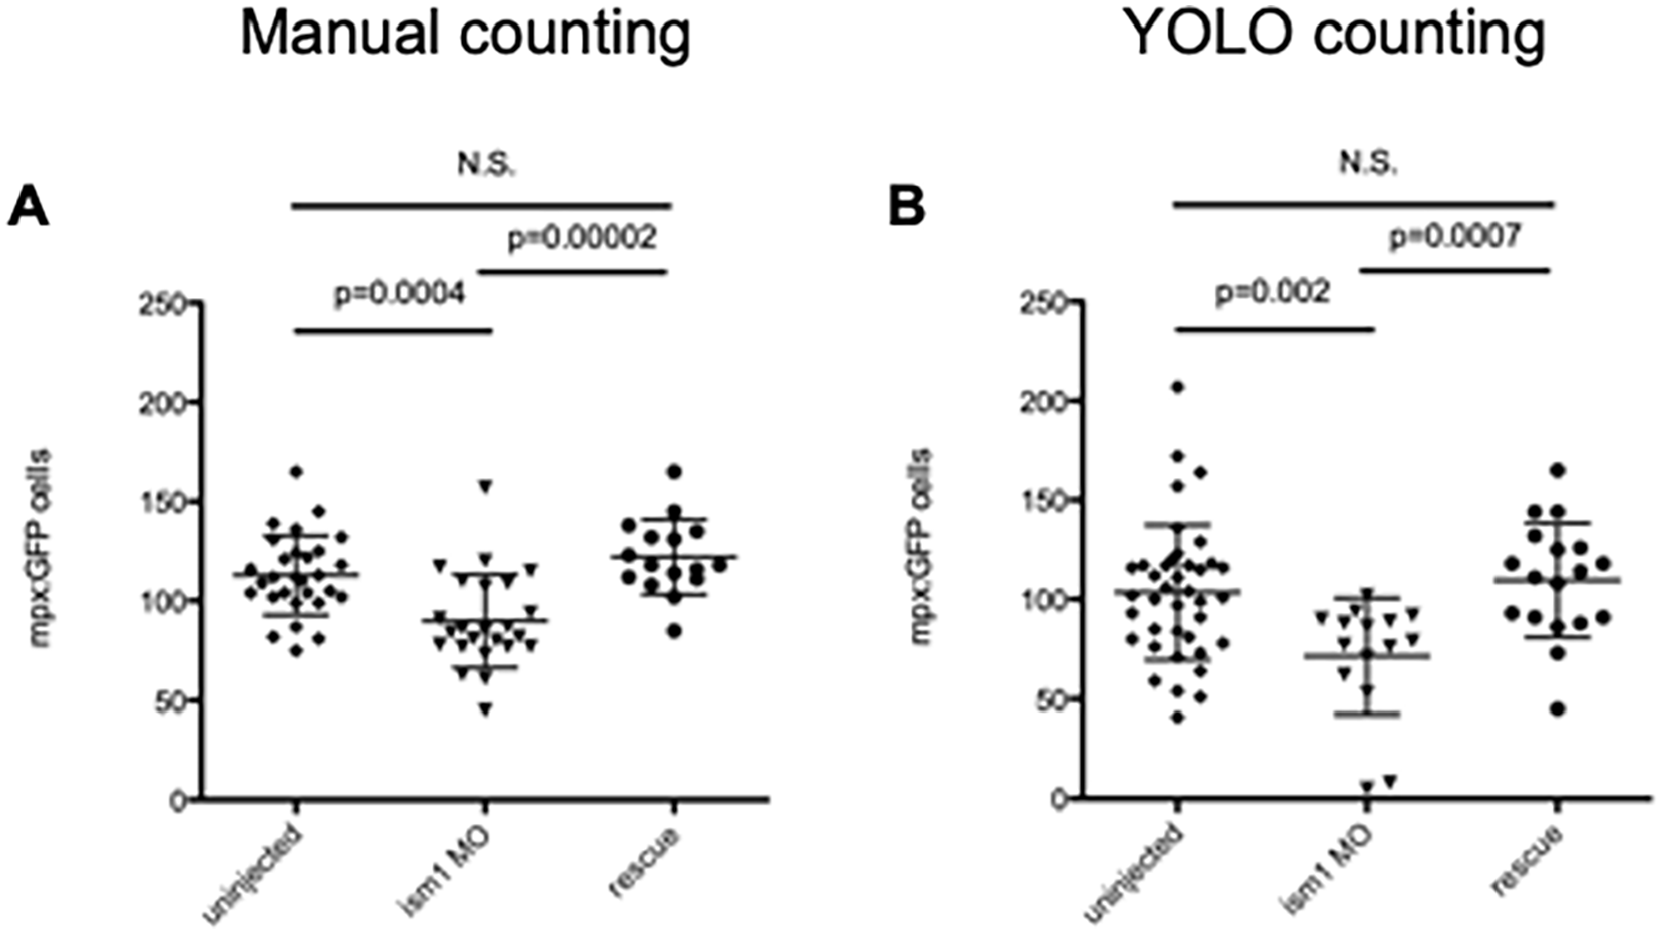
The YOLO model output matches manual cell count data trends. (A) mpx: GFP single-cell-stage embryos were injected with 7 ng ism1 MO (triangles), or 7 ng ism1 MO and 17.88 ng of ism1 mRNA (rescue; circles); uninjected embryos served as controls (diamonds). Developing 48 hpf zebrafish were visualized, and individual mpx: GFP+ cells were enumerated by manual counts. Each data point represents total amount of mpx: GFP+ cells present in 1 zebrafish. ism1 MO reduced mpx: GFP counts, and adding mRNA rescued that reduction. Data originally from Berrun et al. 13 (B) Images from (A) were then examined with the YOLO model. Although there are differences in the counts, the trends are consistent across the human and YOLO automated cell counter. Lines represent average, and error bars represent SD. The P values listed in images, N.S. represents no significance.
To view the general robustness of the model, we also tested its performance with images taken outside of our laboratory and with different microscopes and computers. We also wanted to see if it could identify cells in regions of the zebrafish that it had not seen before, such as in older embryos and the adult tail (we trained the model on 48 hpf embryos). To answer this question, we first acquired 72 hpf mpx: GFP zebrafish images from a laboratory in the Czech Republic. Figure 4 displays an example output for an image taken on a different microscope (a Zeiss AxioZoom V.16 microscope was used instead of our Leica) and at a later stage of development; the model had no issues extrapolating how many cells were present. More notably, Figure 5 shows a picture of an adult zebrafish tail from a laboratory in Belgium with mpx: GFP+ cells correctly labeled, despite our training model data containing no similar images. Overall, these data indicate that once the model is trained, it can easily identify mpx: GFP+ neutrophils in a multitude of different situations.

The YOLO model can be used to quantitate mpx: GFP+ cells in images taken with different microscopes, in different laboratories, and at different times. (A) 72 hpf mpx: GFP embryos imaged with a Zeiss AxioZoom V.16 microscope. Head of embryo is to the left of image. (B) Cell detections calculated by the YOLO model. Images courtesy of Petr Bartunek.

The YOLO model can be used to quantitate mpx: GFP+ cells in the adult zebrafish tail. (A, B) Adult zebrafish had their caudal fins amputated and imaged 4 days later to observe recruitment of mpx: GFP+ neutrophils. (C, D) Even though the YOLO program had never seen adult zebrafish images, it accurately identified mpx: GFP+ cells. Images courtesy of Valerie Wittamer.
Discussion
One of the benefits of using the zebrafish is that it allows investigation of complex developmental processes like hematopoiesis that occur in utero for other vertebrate species. One of the most advantageous tools that exist for zebrafish are transgenic animals whereby specific cells are labeled with fluorescence and can be enumerated. In our laboratory, we study the hematopoietic system, and use mpx: GFP animals extensively; they have GFP+ neutrophils. Altering gene expression in the fish allows us to see differences in neutrophil production, proliferation, and homeostasis, depending on the time of development that we examine. However, these experiments are prone to human error and take a considerable amount of time, especially if large amounts of animals are being examined.
In most laboratories, much of the data analysis following experimentation relies on human counting. This is problematic in several ways. First, the person counting may be biased to the outcome of the experimental procedure. Either blinding the subjects to the experimental condition or validating findings with another viewer has to be performed. Second, the whole process is time-consuming. Images must be taken and then manually counted. These counts can take hours, especially when there are hundreds of events per zebrafish. Theoretically, the model we developed could be automatically performed when an image is taken, allowing near instantaneous results in the laboratory. This would speed up data collection and allow new experiments to be performed much faster and more efficiently.
It is also important to note that a huge benefit of zebrafish is its high-throughput screening potential. With the dawn of deep learning and computer vision, many biologists have sought to use computational methods to remove some biases and perform data analysis more efficiently. Studies done by Tyagi et al 7 and Ishaq et al 8 used deep learning CNNs to phenotype zebrafish deformity for toxicology screening purposes. We began this project with the goal of using deep learning methods to effectively, efficiently, and easily count myeloid cells in mpx: GFP animals. It could easily be used to quantitate neutrophil counts after exposure to toxins or application of drugs with therapeutic potential.
In this study, we presented the use of a YOLO machine learning algorithm trained on 900 images (700 GFP+ images and 200 GFP– images) total following augmentation to quantitate myeloid cells in mpx: GFP zebrafish. The current method of quantitation requires 1 to 4 hours of manual human counting, which can be biased due to the subjective nature of the task. When comparing our model performance with manual human myeloid cell counts, we found the percent error to be 8.65% and correlation coefficient to be r = 0.8207. We noted the training dataset had some images in which some cells lacked labels, as human observers at times cannot differentiate cells in blurry sections of images; thus, the values of the correlation coefficient might be higher for our model and the percent error much lower. Typically, validation of machine learning algorithms benefit from an external labeled data source. However, due to the novelty of this project, we had to verify via other means; we obtained data from a previously published project that found ism1 knockdown resulted in less neutrophils. Processing that project’s data through our model, we were able to reach the same conclusion with statistical evidence of similar trends, validating the usefulness of the model.
To put our algorithm performance into perspective, we must discuss the significance of the percent error value and the model’s generalization across different image types. In addition to the calculation of 8.65% error for the model, we also estimated the general variability between researchers in manual cell counting. By comparing cell counts for the same zebrafish image across 3 manual human counters for the validation dataset, we found the total cell count to vary by 5% to 12%. This indicates that the model’s error falls within the range of variability found between human cell counters for the same task. Furthermore, it brings up an additional strength of the model; as the training data were labeled by multiple human cell counters, the model should not have any particular bias allowing for a neutral observation and counting of experimental and control data for future research experiments.
The cell counting process, especially with abundant cell types, is a time-consuming process hounded by many confounding factors. With our model, we demonstrate that a deep learning model can be adapted for the purpose of detecting and counting mpx: GFP myeloid cells and replace hours of manual (and potentially biased) human work. Future directions include the counting of other fluorescently labeled cell types and use of other object detection models to improve the accuracy of this task. However, a possible hindrance for future work is the data collection process and the limited number of deep learning model options. Zebrafish have an abundance of cells and the training of deep learning models requires that each object is labeled in each image, which in our case meant every cell in each fish must be labeled manually. Thus, for our task, the labeling process was laborious due to the sheer number of fluorescent myeloid cells. Related to this issue, zebrafish fluorescent imaging often results in low-quality images which is difficult for object detection models to handle. To deal with this issue, we used the YOLOv3 model due to its performance in small object detection, which it achieves by making detections at multiple scales. Other deep learning model options were considered for this task, but the issue of detecting small-sized objects limited us to using different versions of YOLO.
Our study also addresses the issue of a lack of accessibility and increasing complexity when it comes to using deep learning tools in a practical setting. In other words, the average biologist does not have these tools at their disposal. We considered using algorithms such as U-Net, which is available as an ImageJ plugin. 12 However, despite its availability and use on the easily accessible ImageJ image analysis platform, we note there are difficulties in downloading the additional U-net plugin, remote server setup requirements, and the lack of familiarity of basic science researchers with artificial intelligence tools. In this article, we demonstrate the benefits of implementing biocomputational tools in easily accessible cloud-based servers; the training and implementation of our model was done fully in the cloud-based Google Colab server. As a result, our model requires no additional software downloads and can be used by anyone with access to basic google drive services (see https://github.com/sthapa320/darknet). This approach narrows the gap between beneficial biocomputational analysis tools and laboratory researchers. We believe that further tools must be developed that assist in biological analysis that also allow increased user accessibility.
Conclusion
In this article, we showed that deep learning models can detect fluorescently labeled myeloid cells in mpx: GFP zebrafish. This method addresses the biases that are associated with manual human counting and reduces analysis time by several hours. Further studies on zebrafish hematopoiesis will benefit greatly from this rapid deep learning-based model.
Supplemental Material
sj-xlsx-1-bbi-10.1177_11779322211037770 – Supplemental material for Deep Learning Approach for Quantification of Fluorescently Labeled Blood Cells in Danio rerio (Zebrafish)
Supplemental material, sj-xlsx-1-bbi-10.1177_11779322211037770 for Deep Learning Approach for Quantification of Fluorescently Labeled Blood Cells in Danio rerio (Zebrafish) by Samrat Thapa and David L Stachura in Bioinformatics and Biology Insights
Footnotes
Acknowledgements
We thank William Dowell, Aleeza Namit, Kristen Rueb, and Allen Benavidez for assisting in the image labeling process. We also thank Petr Bartunek and Valerie Wittamer for mpx: GFP+ images.
Funding:
The author(s) disclosed receipt of the following financial support for the research, authorship, and/or publication of this article: This research was supported by the NIH (R15DK114732-01 to D.L.S.). The funder had no role in study design, data collection and analysis, decision to publish, or preparation of the manuscript.
Declaration of conflicting interests:
The author(s) declared the following potential conflicts of interest with respect to the research, authorship, and/or publication of this article: D.L.S. is a scientific consultant and has received compensation from Finless Foods, Inc. and Xytogen Biotech, Inc. This does not alter our adherence to BBI policies on sharing data and materials. All other authors declare no competing interests.
Author Contributions
ST performed and designed the research. DLS wrote the manuscript based on a first draft from ST.
Supplemental Material
Supplemental material for this article is available online.
References
Supplementary Material
Please find the following supplemental material available below.
For Open Access articles published under a Creative Commons License, all supplemental material carries the same license as the article it is associated with.
For non-Open Access articles published, all supplemental material carries a non-exclusive license, and permission requests for re-use of supplemental material or any part of supplemental material shall be sent directly to the copyright owner as specified in the copyright notice associated with the article.