
Abstract
AutoAnalyze is a highly customizable framework for the visualization and analysis of large-scale model graphs. Originally developed for use in the automotive domain, it also supports efficient computation within molecular networks represented by reaction equations. A static analysis approach is used for efficient treatment-condition-specific simulation. The chosen method relies on the computation of a global network data-flow resulting from the evaluation of individual genetic data. The approach facilitates complex analyses of biological components from a molecular network under specific therapeutic perturbations, as demonstrated in a case study. In addition to simulating the complex networks in a stable and reproducible way, kinetic constants can also be fine-tuned using a genetic algorithm and built-in statistical tools.
Introduction
In systems biology, the computational analysis of molecular networks is an essential prerequisite to better understand their behavior at the system level and to gain insight into the functioning of complex biological networks. Computational simulation can reveal dysfunctional components in a signaling network during transduction processes for pathological states 1 ; or may reflect key energy and nutrient resources for sustaining vital cancer proliferation and development in a metabolic network.2,3 Examples for tools which support the dynamic simulation of molecular networks include biocellion, 4 BioNetCAD, 5 and COPASI 6 which use ordinary differential equation (ODE) systems. Quantitative simulations are impeded by meeting accurate setting criteria of systems due to variances in temperature, pH-value, salt concentration, and other environmental factors.
Packages such as Acorn, 7 BioMet Toolbox, 8 and FBA-SimVis (Grafahrend-Belau et al., 2009) 9 implement flux balance analysis (FBA) by simultaneously monitoring the hundreds or thousands of biochemical reactions that constitute the network. Due to the qualitative focus of FBA, it cannot make full use of signaling network features such as feedback control mechanisms or transcriptional and translational regulation mechanisms. A number of modeling and simulation frameworks apply Petri nets (PNs) to investigate properties of biological systems such as crosstalk between signaling pathways and gene regulatory networks. 10 While various extensions make PNs suitable for the definition of qualitative and quantitative models, 11 networks with a high grade of complexity can pose a challenge due to performance issues and difficulties in managing the order of firing.
AutoAnalyze is a new powerful and modular visualization/analysis tool with applications in systems biology. It has been successfully deployed in the automotive domain to evaluate the integrity of critical timing aspects in large-scale embedded software systems 12 based on the industry standard AUTOSAR (www.autosar.org) and is part of the tool chain of the BMBF-funded ARAMIS II project (www.aramis2.org). Simulation relies on data-flow analysis (DFA), a generic and highly scalable static analysis technique commonly applied in the area of compiler construction to approximate the runtime behavior of program code by evaluating its control-flow graph.
Extensions to AutoAnalyze add support for biological molecular networks. Mappings to graphical literals such as nodes, ports, and connectors along with a set of predefined filters and wizards enable users to visualize and navigate the network, perform basic editing, and create reports. In a case study, a prediction of treatment response of cell lines and overall survival of patients from different types of cancers yielded satisfactory results. 13
Technology and Method
Principles from kinetic equation–based simulation approaches (ODE, PN, and others) have been adapted into a data-flow framework by encoding the kinetic rate laws for different reaction types as data-flow rules (if not specified otherwise, the applied kinetic law corresponds to the mass action law). For instance, a transcription which when involves gene A, is regulated by a transcription factor B and produces an mRNA concentration C, this can be described by the following formula
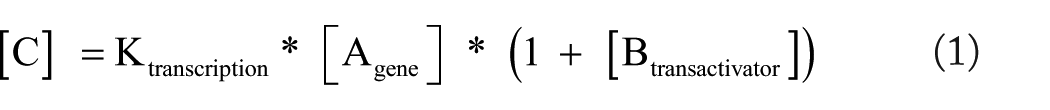
Here, A is the expression level of gene A, which is set by some provided or previously computed input. The protein concentration B has been computed by the corresponding translation and transcription related to gene B. The kinetic parameter Ktranscription is specified according to the type of reaction as described in our previous study. 14
Molecular networks are specified in a simple XML-based format which can, for example, be exported using SimCell, COPASI, CellDesigner, or other systems biology–related software. A network model defines a list of reactions and reaction objects. The latter comprise the inputs and outputs of the reactions and are assigned different roles in the context of each reaction in which they take part, depending on the reaction type and the respective rate law. For example, for reactions of the transcription type, a list of objects which are categorized as genes will be expected, along with an (optional) set of objects which are classified as transactivators and transrepressors. Cell line or patient data (gene expression profiles) containing initial concentration values for specific components are also provided in a simple XML-based format (Supplemental information).
From these inputs, a combined network model is constructed, which is then subjected to an analysis to derive final concentration values. The simulation is carried out using the model analysis framework (MAF), 15 a model-based implementation of the DFA technique. For this purpose, kinetic rate laws have been implemented as declarative and parametrizable data-flow rules which, in this application scenario, compute concentration values at network elements. First, the implementations of the kinetic rate laws are assigned to the respective reactions in the model, and the concentration values at the reaction objects are set to their initial values. This forms an (potentially cyclic) equation system, which is then evaluated using a demand-driven fixed-point algorithm: a kinetic rate law is selected and executed. Its implementation will then dynamically determine the required inputs and make a request to acquire their current values. This request is intercepted by MAF which records the dependency between input and output objects and schedules the evaluation of the corresponding rate laws. Due to cyclic paths, input values can change multiple times during the simulation in which case MAF automatically performs a repeated evaluation of the affected parts of the model. The dependency graph, which overlays the network model, allows the framework to derive an optimal optimized execution order, thereby greatly reducing the performance impact. Computation is aborted once concentration values stabilize in a fixed point. For non-stable paths, recomputations are limited to a predetermined number to reflect the effects of natural decay.
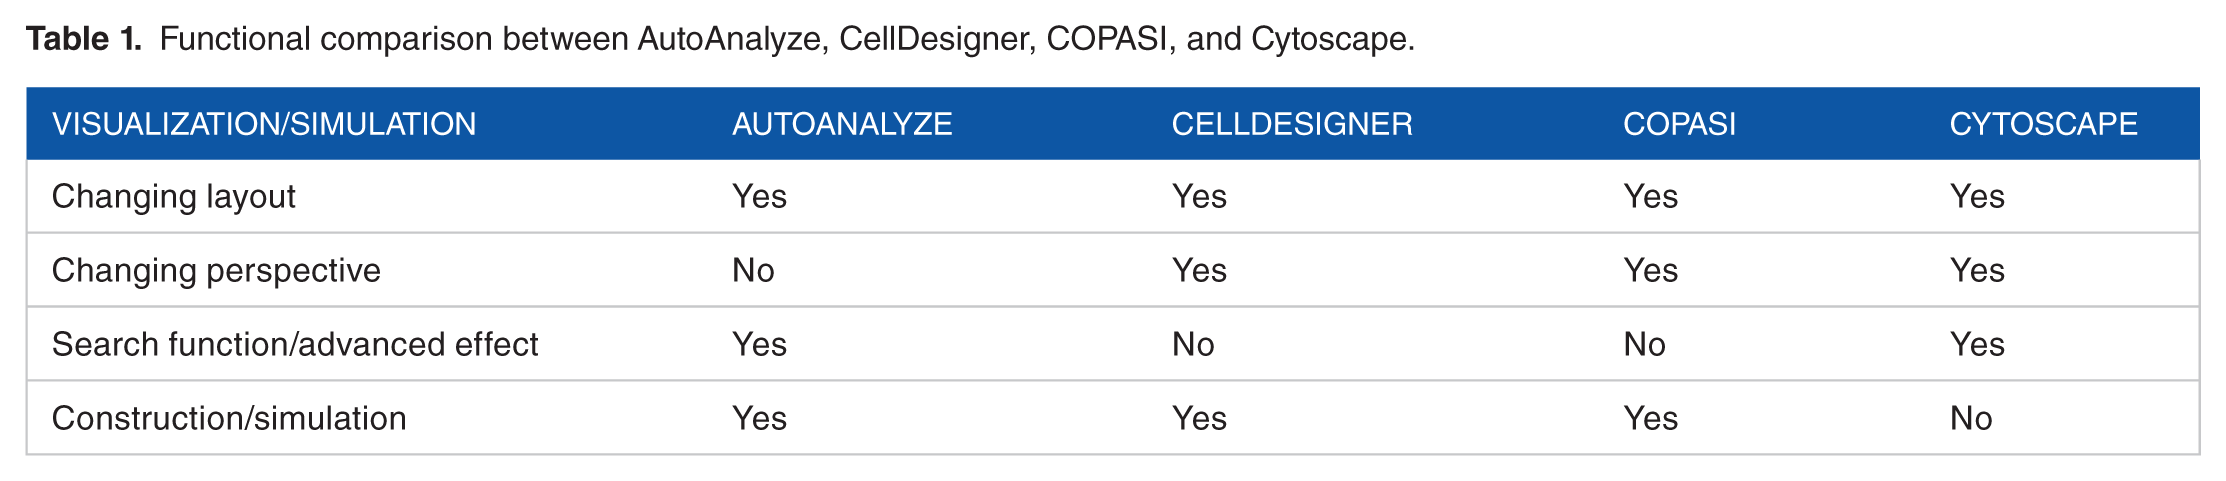
AutoAnalyze is built on top of Eclipse RCP (www.eclipse.org) technology and comprises a set of open service gateway initiative (OSGi) plugins which implement visualization, editing, and analysis functionality. Table 1 summarizes and compares functions of visualization and simulation between different tools. A modular architecture and dedicated extension points allow for extensive customization and support of arbitrary application domains via suitable connector plugins. Internal data representation relies on the eclipse modeling framework (EMF) which implements the meta-modeling standard MOF (http://www.omg.org/mof), while simulation capabilities are provided by the MAF. The distribution also includes the statistics library Waikato Environment for Knowledge Analysis (WEKA) and the genetic algorithm framework Jenetics. A dedicated optimization mode makes use of these components to automatically fine-tune kinetic constants by scoring analysis results for known outcomes. The installation package consists of a self-contained eclipse distribution and requires only JRE version 7 or newer to run.
Functional comparison between AutoAnalyze, CellDesigner, COPASI, and Cytoscape.
Key Functions
The AutoAnalyze package provides users with an extensive set of functions to customize the visualization, including different layouts and filters. Editing functions, for example, setting inhibitors and the import of meta and treatment data of patients can be accessed via context menu. Separate tabs of the editor provide tabular views with detailed information about patient data and computed concentration values, which can also be exported as CSV files for external processing. Table 1 summarizes and compares functions of visualization and simulation between different tools.
Using the preferences dialog (Window/Preferences), the user can manually adjust constants for concentration decay and kinetic rate laws as well as normalization properties. Since these values are based on approximations, AutoAnalyze also includes an optimization component which allows to fine-tune the analysis (Figure 1). The user can configure the exploration space by setting allowable ranges which are then explored using a genetic algorithm. A fitness function assesses the results for known treatment outcomes and scores the respective configuration. Recently published open-source software BioNetGen2.2 has functionalities similar to AutoAnalyze. 16 The goal of BioNetGen2.2 is to improve execute-power for functional kinetic laws, accelerate the stochastic simulation, and enable hybrid particle/population simulation. Since AutoAnalyze employs a DFA-centric approach, various functional kinetic laws including stochastic kinetics can be applied seamlessly during mode simulation. One of its main purposes is the application of flux-comparative-analysis (FCA), which usually requires users to simulate a genome-scale network with integration of large amount of genetic data such as NGS data to compare different states of individual objects, for instance, control versus treatment; and control versus mutation. To our knowledge, currently, only AutoAnalyze can fulfill this task. Furthermore, the software is able to take the morphology of input networks into consideration, which is normally neglected by other tools in systems biology. The final goal of AutoAnalyze is to support preclinical and/or clinical decisions. User-guidance for simulation network and visualization can be found in the Supplemental information.

(A) A large-scale metabolic network is visualized in the graphical editor in AutoAnalyze; (B) the statistical evaluation of components is showing the concentration distribution for the selected reaction; and (C) the enlarged detailed view of a single component and related two reactions from this network.
Case Study
We constructed a molecular metabolic network (MCPM: methionine cycle-based metabolic model) by combining information from literature (PubMed search with keyword “methylation cancer drug”) and publicly available databases such as KEGG (http://www.genome.jp/kegg/). The construction was performed by applying SimCell and obeying the role of basic cellular biology: gene→RNA→protein. 12 The MCPM was exported as an XML file (Supplemental information) and imported it into AutoAnalyze along with genetic data from the Cancer Cell Line Encyclopedia (CCLE). 17 These input data consist of gene expression profiles of all cancer cell lines from CCLE and follow the XML-format described above (Supplemental information). To integrate the data with the model network described above, each component of the input model requires a unique identifier . In this case, all gene components in the MCPM model were assigned their Ensembl ID. AutoAnalyze is then used as a computational machinery to simulate network states. The workflow of this case study is shown in the Figure 2. The output of AutoAnalyze comprises the simulation result for all reactions within the MCPM model in the form of concentration values. Activity states of specific network components were correlated with treatment response data (IC50) also available in the CCLE. Zhang et al did confirm that several components of the methionine cycle–based metabolism (MAT2A, ATP6V0E1, PIP4K2C, and others) show differential correlation with IC50 with respect to treatments applied. This result is in agreement with several independent studies and demonstrates the potential of computational simulation for the purpose of biomarker discovery within systems medicine. 13 Evaluation of gene expression data of 479 cancer cell lines from CCLE using AutoAnalyze took approximately 900 seconds. The simulation duration of CCLE data integrated into the model MCPM with 4750 reactions and 3755 components in AutoAnalyze was approximately 200 seconds. Consequently, the software allows bedside application of specific system-medical computations for treatment decisions on a small standard notebooks or tablets.

The application workflow of AutoAnalyze regarding the case study.
Supplemental Material
Supplementary_Info2_AutoAnalyze_in_Systems_Biology_xyz9915d07f2348 – Supplemental material for AutoAnalyze in Systems Biology
Supplemental material, Supplementary_Info2_AutoAnalyze_in_Systems_Biology_xyz9915d07f2348 for AutoAnalyze in Systems Biology by Christian Saad, Bernhard Bauer, Ulrich R Mansmann and Jian Li in Bioinformatics and Biology Insights
Footnotes
Funding:
The author(s) disclosed receipt of the following financial support for the research, authorship, and/or publication of this article: This work is funded by the German Cancer Consortium (DKTK), the German Cancer Research Center (DKFZ), and the project DIFUTURE from the Medical Informatics Initiative Germany (BMBF).
Declaration of Conflicting Interests:
The author(s) declared no potential conflicts of interest with respect to the research, authorship, and/or publication of this article.
Author Contributions
The conception and design of the study: CS, UM, JL. Acquisition of data: UM, JL. Analysis and interpretation of data: CS, BB, UM, JL. Drafting of the article or revising: CS, JL. Final approval: BB, UM.
Supplemental Material
Supplemental material for this article is available online.
References
Supplementary Material
Please find the following supplemental material available below.
For Open Access articles published under a Creative Commons License, all supplemental material carries the same license as the article it is associated with.
For non-Open Access articles published, all supplemental material carries a non-exclusive license, and permission requests for re-use of supplemental material or any part of supplemental material shall be sent directly to the copyright owner as specified in the copyright notice associated with the article.