
Abstract
Objective:
Colon cancer is associated with multiple levels of molecular heterogeneity. RNA processing converts primary transcriptional RNA to mature RNA, which drives tumourigenesis and its maintenance. The characterisation of RNA processing genes in colon cancer urgently needs to be elucidated.
Methods:
In this study, we obtained 1033 relevant samples from The Cancer Genome Atlas (TCGA) and Gene Expression Omnibus (GEO) databases to explore the heterogeneity of RNA processing phenotypes in colon cancer. Firstly, Unsupervised hierarchical cluster analysis detected 4 subtypes with specific clinical outcomes and biological features via analysis of 485 RNA processing genes. Next, we adopted the least absolute shrinkage and selection operator (LASSO) as well as Cox regression model with penalty to characterise RNA processing-related prognostic features.
Results:
An RNA processing-related prognostic risk model based on 10 genes including FXR1, MFAP1, RBM17, SAGE1, SNRPA1, SRRM4, ADAD1, DDX52, ERI1, and EXOSC7 was identified finally. A composite prognostic nomogram was constructed by combining this feature with the remaining clinical variables including TNM, age, sex, and stage. Genetic variation, pathway activation, and immune heterogeneity with risk signatures were also analysed via bioinformatics methods. The outcomes indicated that the high-risk subgroup was associated with higher genomic instability, increased proliferative and cycle characteristics, decreased tumour killer CD8+ T cells and poorer clinical prognosis than the low-risk group.
Conclusion:
This prognostic classifier based on RNA-edited genes facilitates stratification of colon cancer into specific subgroups according to TNM and clinical outcomes, genetic variation, pathway activation, and immune heterogeneity. It can be used for diagnosis, classification and targeted treatment strategies comparable to current standards in precision medicine. It provides a rationale for elucidation of the role of RNA editing genes and their clinical significance in colon cancer as prognostic markers.
Introduction
Colon cancer ranks third in morbidity and mortality among all cancer types mentioned in the 2020 Global Cancer Statistical Report, accounting for 6.0% and 5.8% of total cancer incidence and cancer-related deaths, respectively. 1 Local recurrence, chemotherapy resistance, lymph node metastasis, liver and lung metastasis are the key factors associated with poor prognosis in colon cancer. 2 Although, advances in systemic therapy have improved the overall prognosis of patients with colon cancer, significant differences in clinical outcomes exist among patients treated similarly. Current treatment decisions and prognoses are largely based on cancer cell-centric factors, such as TNM staging system. There is an urgent need to investigate a new classification protocol that provides comprehensive insights into the prognosis and treatment of colon cancer and improves the accuracy of traditional staging approaches such as TNM.
RNA processing genes are involved in mRNA transport, editing, and decay of messenger RNA. 3 RNA process is an intermediate step linking genotype and phenotype, and facilitates conversion of the original RNA transcript into mature RNA. 4 In both prokaryotes and eukaryotes, many RNAs require processing for functional maturation into RNA molecules. The processing of eukaryotic messenger RNAs is complex. Common processing events include: (1) The mRNA produced by polymerase II transcription undergoes a 5ʹ end capping before leaving the nucleus; (2) Except for histone mRNA, most type II transcripts undergo 3′ end processing. Coupled with a poly(A) tail measuring tens to hundreds of adenine nucleotides in length, the process entails cleavage of the 3ʹ end of the pre-mRNA and polyadenylation; (3) The transcript undergoes editing including spacer deletion and splicing to form a functional mRNA. RNA sequencing analysis shows that more than 95% of human genes are regulated via alternative splicing, thus ensuring that a gene can produce multiple pre-mRNA or protein subtypes with different functions. RNA processing is involved in several phenomena, including cellular apoptosis and maturation, tissue-specific expression, immune response, and tumor development and maintenance. 5
Cancer-related shifts in RNA modification, RNA editing, and expression of non-coding RNA species such as long non-coding RNAs and micro-RNAs have been reported recently.6-9 RNA processing genes can influence the prognostic response of patients diagnosed with cancer.10-21 Differential analysis of RNA editing genes in tumors based on RNA processing factors facilitates tumor grading and treatment, and can serve as an important complementary marker of TNM staging system. However, changes in RNA splicing and their functional role in colon cancer development and maintenance, a feature of RNA processing, urgently needs to be fully elucidated. The rapid development and standardisation of high-throughput and low-cost next-generation sequencing protocols has facilitated clinical prognosis of tumors. In our study, we acquired eligible colon cancer samples to delineate the differences in tumour RNA-editing gene phenotypes.22,23 We used transcriptome data to identify various heterologous RNA-processing gene phenotypes and further investigate the underlying mechanism of each gene.
Finally, a 10-gene RNA processing-related prognostic classifier involving FXR1, MFAP1, RBM17, SAGE1, SNRPA1, SRRM4, ADAD1, DDX52, ERI1, and EXOSC7 was identified in this study. As shown in the bioinformatics analysis above, the 10 genes not only suggest a significant impact on the prognosis of colon cancer, but several studies have also suggested that ten candidate RNA processing factors play important regulatory roles in the progression of colon cancer. For example, FXR1 is a member of the RNA binding protein family and is highly amplified in many cancers. 24 FXR1 can also stabilize target mRNAs such as MYC. 25 MFAP1 is a member of microfiber related proteins involved in microfiber assembly, elastin generation, and tissue homeostasis. 26 By combining this 10-gene RNA processing-related prognostic classifier with other clinical variables, a composite prognostic nomogram was constructed to facilitate clinical practice based on TNM stage and age. The study first explains changes in RNA splicing in cancer and their role in the initiation as well as maintenance of cancer. Further, it distinguishes tumour RNA editing phenotypes, combined with transcriptome data to explore differences in heterologous RNA processing genotypes.
Materials and Methods
Colon cancer patient databases
Transcriptome sequencing data involving 446 colon cancer samples were acquired from The Cancer Genome Atlas colon cancer (TCGA-COAD) database (https://portal.gdc.cancer.gov/). A total of 585 microarray transcriptome data (GSE39582) 27 were obtained from the Gene Expression Omnibus (GEO) database (https://www.ncbi.nlm.nih.gov/geo/). Clinical information and survival follow-up information was also accessed from the corresponding websites. The expression profile (fragments per kilobase million [FPKM] value) of TCGA-COAD database was transformed into transcripts per kilobase million (TPMs) similar to the microarray data. 28 The “ComBat” algorithm in sva R package 29 was adopted to reduce batch impact due to non-biological technical bias across various databases.29,30 This study is a bioinformatics analysis and can be broadly classified as a retrospective study. This study mainly involved data analysis, which lasted about 3 months. Because all clinical samples and follow-up data involved in this study were obtained from the TCGA and GEO databases, we included all study samples with complete information.
Acquisition of RNA processing factors
RNA processing factors are genes involved in conversion of primary RNA transcripts into mature RNA molecules. The factors were obtained from the Gene Ontology term (GO:0006396) in the AmiGO database 31 and 485 RNA processing factors were finally used for follow-up analysis. Gene expression data involving these RNA processing factors were obtained from the TCGA-COAD and GEO databases.
Unsupervised hierarchical cluster analysis for RNA processing factors
The study was carried out using an unsupervised clustering “Pam” method according to Euclidean and Ward chains and using “ConsensuClusterPlus” R package. 32 In order to ensure the stability of the classification, a total of 1000 replicates were performed. 33 Different RNA processing modes were employed according to the expression of RNA processing factors for future investigation. Gene expression clustering was carried out with 80% of the resampling items, 50 resampling times and a maximum K value of 10. 33 The optimal K value was evaluated from uniform heat map and cumulative distribution function (CDF). 33
Identification of prognostic characteristics related to RNA processing factors
We adopted univariate Cox regression analysis to identify prognostic genes and a combined database including TCGA-COAD and GEO data was generated. Subsequently, the target gene with the greatest prognostic weight was identified using R package “glmnet” with the minimum absolute contraction and selection operator (LASSO).34-36 Then, a multivariate Cox analysis based on the Enter method was used to measure the effect of gene expression on prognosis. Finally, the prognostic risk features were established using multivariate Cox analysis combined with the identified gene expression and matching regression coefficients (β values).33,37 Using the median risk score as the critical value, gastric cancer was divided into low- and high-risk groups. The R “survival” package was used to assess differences in overall survival between the 2 groups. 38 Kaplan-Meier survival curves were generated, and differences were detected via log-rank test.
Development and verification of complex RNA processing-clinical prognostic nomogram
Based on the results of multivariate analysis, we integrated prognostic characteristics associated with age, sex, TNM stage, and RNA-treated genes to generate a composite prognostic model using cox proportional risk regression analysis of the combined TCGA-COAD and GEO data. The corresponding coefficients in the combined database were used to further verify TCGA-COAD and GEO databases. We compared the prognostic value of the composite prognostic model with the consistency index (C-index) of the TNM staging system, as indicated by RMS curve. 39 The C-index was used for discrimination and the U test was used to determine the unreliability of the calibration curve. 40 We also used RMS package to draw the nomogram and calibration curve in R software. Decision curve analysis (DCA) was used to quantify the net benefit at various threshold probabilities in validation sets to identify the clinical usefulness of the nomogram.41,42 The net benefit was assessed as follows:

where n is the total number of patients and Pt denotes the probability of a given threshold.
The differences in restricted mean survival (RMS) based on the risk score between the 2 risk groups were assessed. 43 RMS represents 60-month life expectancy of patients with various risk scores. Eventually, based on model visualization and clinical indicator analysis (calibration time curve graph), a modal graph was generated utilising the clinical application performance indicator (calibration curve) and decision curve analysis.39,41
Bioinformatics analyses
We used principal component analysis (PCA) to identify the difference in expression between R package “extra factor” groups. 44 The gene set was annotated via GO and KEGG pathway enrichment analysis. GO and KEGG analyses were performed using clusterProfiler R Package. 32 The differentially expressed RNA processing factors were identified with a statistically significant difference of |log2FC| > 1 and a false discovery rate (FDR) < .05 among different clusters in the combined database (combined TCGA-COAD and GEO data). 33 We counted the nonsynonymous mutations in colon cancer to identify the mutational burden. Somatic changes in colon cancer driver genes were assessed as high or low risk scores, followed by identification of colon cancer driver genes using “maftool” R Package. 45 The 25 most frequent cancer driver genes were analysed. The mutant landscape was created using the maftools package, initially deleting 100 frequently mutated genes (FLAGS).45,46 The levels of infiltration of different immune cells in tcGA-COAD and GEO data were quantified using the “CIBERSORT” R package, 47 which carries an LM22 signature and 1000 permutations. The ESTIMATE algorithm can be used to estimate the immune and matrix contents (immune and matrix fractions) 48 of TCGA-COAD and GEO samples using the MCP counter package. 49 Different levels of immune cell infiltration are shown in heat maps and histograms. Gene Set Enrichment analysis (GSEA) was used to analyze the functional enrichment of genes related to risk score using cluster Profiler packages.32,50 The aforementioned data visualization uses Ggplot2 package. 51
Based on protocol recommendations, WGCNA is used to identify gene modules associated with prognostic signals associated with RNA processing.52,53 The scale-free topological fitting index (R2) > .85 was used as the threshold to build the weighted gene co-expression network. A minimum cluster size of 30 and a threshold of 0.25 were selected as the threshold for identifying co-expressed gene modules. 52 The two-weight intermediate correlation coefficient |R| ⩾ .15 and a P-value < .05 represent the thresholds to identify gene modules associated with prognosis. 52
Statistical analyses
Statistical tests were carried out using SPSS 24.0 (IBM, Chicago, IL, USA) and R statistical software (version 4.1.1; http://www.r-project.org/). Kruskal-Wallis test and Wilcoxon test were used for comparison of more than 2 groups. 37 Continuous data were tested with Mann-Whitney test, and classified data were tested using Fisher’s exact test. 37 Kaplan-Meier plots were used to generate survival curves of each subgroup in each database, and the log-rank test facilitated the evaluation of statistically significant differences. Univariate cox regression analysis was used to screen genes with prognostic value, and multivariate cox regression analysis was used to evaluate the weight of candidate gene expression based on prognosis. 37 Spearman analysis facilitated the analysis of the relationship between WGCNA module and clinical characteristics. 53 The relationship between 2 continuous variables was measured with Pearson correlation coefficient. 37 The RMS curve and RMS time differences were estimated using survRM2 software package.39,41,43 COX regression and correlation analyses were performed using SPSS 24.0. Other statistical analyses and visualization were mainly implemented using R 54 and ggploT2 R Package.51,55 Two-tailed P < .05 was considered statistically significant. The data processing flow chart is provided in Supplemental Figure 1.
Results
Acquisition of RNA processing genes and identification of 4 different RNA processing modes in colon cancer
A total of 1033 samples (TCGA-COAD and GSE39582) were included in the study and 982 RNA editing genes were obtained from the AmiGO database (GO:0006396). The expression data of RNA editing genes detected in public database is only 485 genes, so a total of 485 genes were included in the sample with gene expression data (Supplemental Table 1). Thus, the data of 485 genes expressed were finally included in the prognostic model construction. Unsupervised cluster analysis was used to perform hierarchical clustering of data related to RNA editing genes in patients with colon cancer, with a cluster coeffcient of K = 4. Finally, 4 different modes of RNA editing were identified as shown in the heatmap (Figure 1A). The principal component analysis (PCA) plot showed tremendous variation in the expression profile of the 4 modes (Figure 1B). Significant differences in survival prognosis were detected among the 4 modes (Figure 1C). Clusters A and D were associated with prognostic advantage, while clusters B and C were related to prognostic disadvantage.

Identification of 4 different RNA processing modes in colon cancer. (A) Heatmap of 4 distinctive RNA processing modes defined by an unsupervised cluster analysis. (B) The principal component analysis (PCA) of the 4 subtypes were shown by the heatmap. (C) Kaplan-Meier survival curve analysis of overall survival for the 4 modes.
Identification of prognostic features related to RNA processing
We adopted univariate Cox regression analysis to identify the genes associated with prognostic significance in the combined database. Among 458 RNA processing genes, 51 were associated with overall survival including 20 genes (HR > 1, P < .05) associated with risk and 31 with a protective role (HR < 1, P < .05, Supplemental Table 2). Kyoto Encyclopedia of Genes and Genomes (KEGG) and Gene Ontology (GO) functional enrichment analysis suggested the genes associated with prognosis were related to key biological functions such as spliceosome, RNA methyltransferase activity, U2-type precatalytic spliceosome, catalytic activity involving RNA, U2-type spliceosome complex, RNA splicing, and ncRNA processing via transesterification involving a bulged adenosine used as the nucleophile (Figure 2A). A total of 10 genes containing non-zero parameters were determined (Figure 2B and C). The LASSO regression algorithm was used to screen 51 genes in the combined database to conveniently and effectively stratify the RNA processing genes with increased prognostic accuracy (Figure B and C). The genes finally incorporated into the survival prediction model included FXR1, MFAP1, RBM17, SAGE1, SNRPA1, SRRM4, ADAD1, DDX52, ERI1, and EXOSC7 (Figure 2D). The effect of the selected genes on prognosis was measured via multivariate Cox analysis, based on the Enter method, visualized by dendrogram (Figure 2D). Prognostic risk profiles were established by combining the confirmed gene expression values with matching regression coefficients (β value) in multivariate Cox analysis. The corresponding risk scores for the databases were calculated based on the following formula: Risk score = −2.224*ADAD1-0.309*DDX52-0.325*ERI1-0.501*EXOSC7 + 0.405*FXR1 + 0.508*MFAP1 + 0.495*RBM17 + 0.514
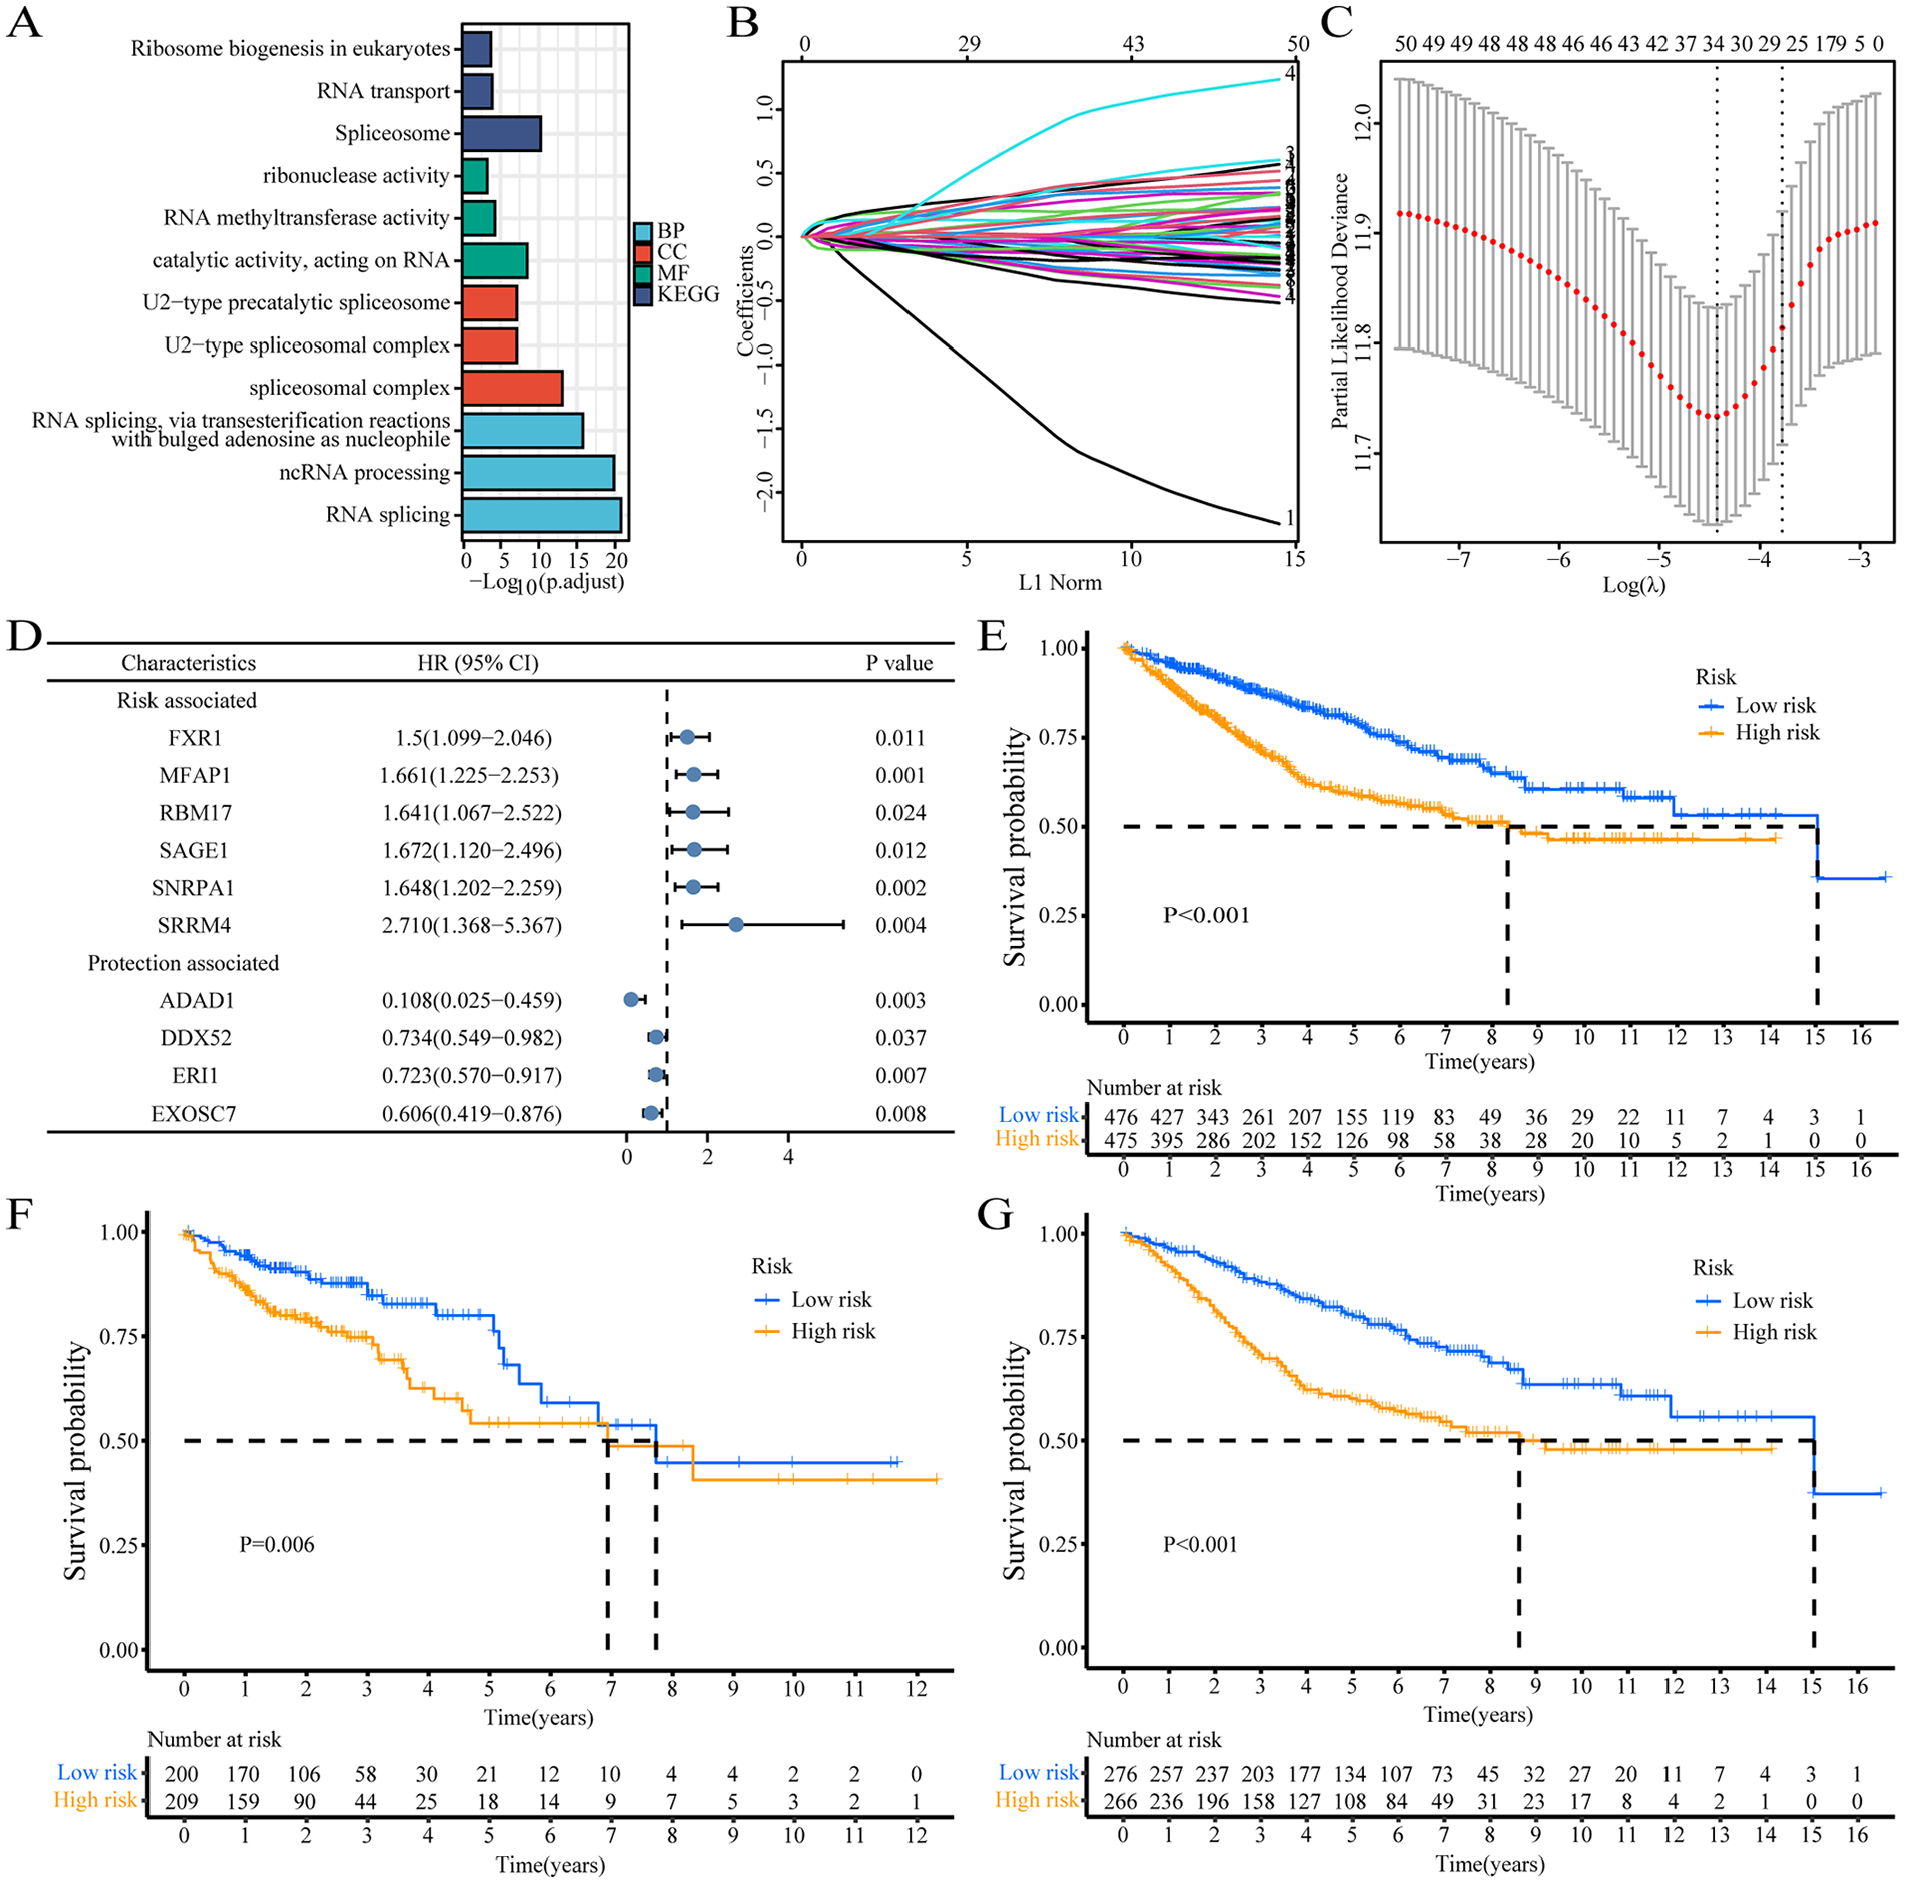
Identification of prognostic features related to RNA processing. (A) GO and KEGG functional enrichment analysis of differential genes among the 4 subgroups. (B) Lasso variable trajectory plot of prognosis-related RNA-processing genes. (C) Lasso coefficient filter plot of prognosis-related RNA-processing genes. (D) The corresponding hazard rations of the contained 10 genes in the signature represented by the dendrogram. (E-G) Kaplan-Meier survival curve analysis by log-rank test of high-risk and low-risk groups in combined database (E), TCGA database (F) and GEO database (G).
*SAGE1 + 0.500*SNRPA1 + 0.997*SRRM4. Using the median risk score as a cutoff, patients with colon cancer was divided into high-risk and low-risk groups (Supplemental Table 3). Kaplan-Meier survival curves showed that the survival time of patients in the high-risk group was less than that of patients in the high-risk group of the Union database (Figure 2E), TCGA (Figure 2F) and GEO databases (Figure 2G). Kaplan-Meier survival analysis showed that patients with low-risk scores showed significantly longer overall survival than those with high-risk scores. Multivariate Cox regression analysis showed the following hazard ratios for high-risk scores: combined database: P < .001, HR = 2.646, 95% CI: 2.096-3.34; TCGA database: P < .001, HR = 2.649, 95% CI: 1.835-3.825; GEO database: P < .001, HR = 2.663, 95% CI: 1.957-3.623 (Table 1). In addition, subgroup analysis was performed based on age, gender, and TNM staging to explore the interaction between RNA processing-related risk signatures and clinical features in the combined database. The outcomes indicated that the group with the high-risk score was a distinct element in the overall survival in different subgroups (Table 2). In addition, clinical features such as TNM stage and age were also distinct prognostic elements in colon cancer (Table 2).
Univariate and multivariate Cox analyses of the RNA processing-related signature in different databases.

Subgroup analysis of the RNA processing-related signature.

Construction of overall survival nomogram for colon cancer patients
A combined nomogram containing the RNA processing gene-based risk score signatures and the significant clinical variables (TNM stage, sex, and age) was established to further improve the prognostic accuracy of the combined data (Figure 3A) to facilitate model visualization as well as clinical application. Meanwhile, the restricted mean survival time (RMST) of the 2 groups in various databases was evaluated. Low risk group patients have better RMST at different time points in the combined database (Figure 3B), TCGA (Figure 3F) and GEO database (Figure 3J). Important differences in RMST between the high-risk and the low-risk groups were determined at various times; the difference in RMST increased with extended duration (Table 3). The differences in RMST between these groups were 0.427 (combined database), 0.552 (TCGA), and 0.231 (GEO) months for overall survival in the next year, reaching 7.816 (combined database), 7.601(TCGA) and 7.780 (GEO) in the fifth year.

The construction of nomogram for overall survival in patients with colon cancer. (A) Prognostic nomogram for 1-year, 3-year, and 5-year overall survival of patients with colon cancer. (B, F, J) The restricted mean survival time (RMST) between the high-risk group and the low-risk group in the combined database, TCGA and GEO. (C, G, K) Concordance index (c-index) plots of TNM stage model, Clinic model, Risk score model and Composite model at different time points in the in the combined, TCGA and GEO databases respectively. (D, H, L) The calibration curve of the observation and prediction probabilities of the nomograms in the combined, TCGA and GEO databases respectively. (E, I, M) Decision curve analysis plots of TNM stage model, Clinic model and Composite model in combined, TCGA and GEO databases respectively. TNM stage model: involved in TNM stage only; Clinic model: involved in age, sex and TNM stage; Risk score model: involved in risk score only; Composite model: involved in risk score, TNM stage, age, and sex.
RMST between the 2 risk groups at different time points.

The bold value means the outcome was statistically significant.
Restricted mean survival time (RMST), months.
RMST difference =RMSThigh risk-RMSTlow risk.
To validate the prognostic performance of the constructed nomogram, calibration curve, decision curve analysis (DCA), and concordance index (C-index) were used to test the prognostic performance of the combined database model, TCGA and GEO. Compared with the TNM stage model, the clinical models based on TNM stage, sex, and age and risk score, the composite model involving risk score, TNM stage, age and sex revealed a significant improvement in survival rates (Figure 3C, G, and K), which were assessed by C-index. The calibration curve showed the probabilities of observation and prediction of the nomograms in the combined database, TCGA and GEO (Figure 3D, H, and L). Eventually, we compared the net clinical benefits of the composite model with the models based on TNM stage, clinical and risk scores using the DCA curve. The nomogram based on the composite model showed higher net benefit (Figure 3E, I, and M). The foregoing results demonstrate the reliability, stability and enhanced prognostic performance of the nomogram-based composite model.
Functional enrichment analysis of RNA editing gene-related modules
RNA expression profiles were assessed based on prognostic features related to RNA processing considering that RNA processing genes control the life cycle of nuclear RNA. Using Pearson correlation analysis, we identified genes with expression levels related to trait risk scores, to establish a list ranked according to Pearson’s correlation coefficients. The gene set enrichment analysis (GSEA) of genes with strong risk score correlation was performed. The gene expression map showed that the genes positively associated with risk score were largely expressed in pathways associated with cell proliferation cycle markers, such as reactome cell mitotic, reactome cell cycle checkpoints, reactome cell cycle, reactome mitotic prometaphase and reactome M phase, which were significantly enriched in colon cancer samples expressing higher risk (Figure 4A). By contrast, genes inversely associated with risk score were largely expressed in pathways associated with metabolic markers, including reactome defensins, reactome class C 3 metabotropic glutamate pheromone receptors, keg allograft rejection, reactome antimicrobial peptides and kegg autoimmune thyroid disease in colon cancer samples (Figure 4A).
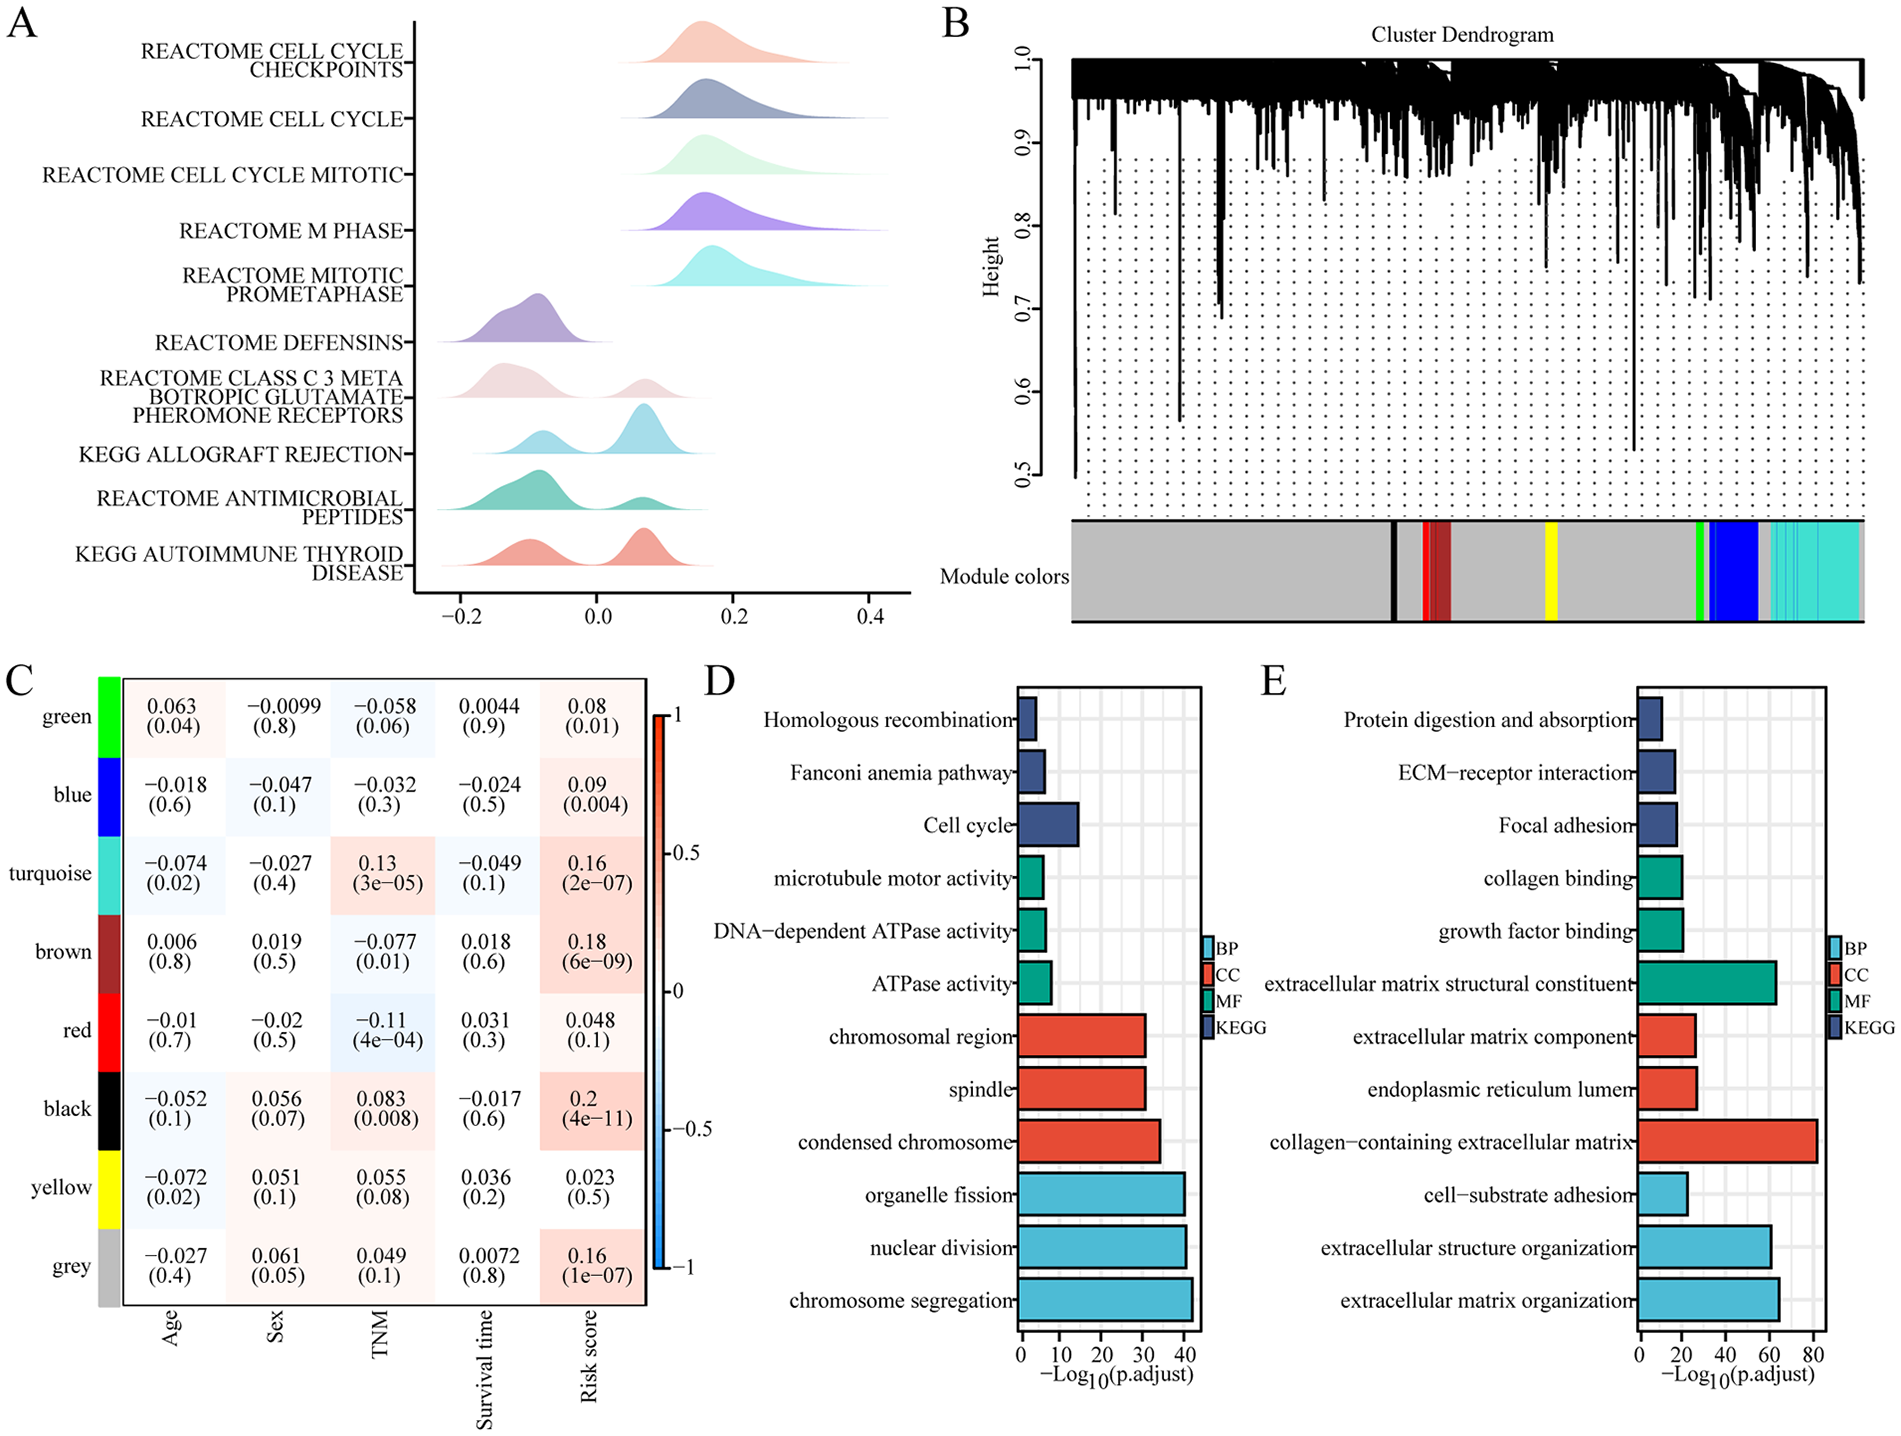
Functional enrichment analysis of RNA processing-based risk score-related genes. (A) Mountain map showed GSEA analysis results of genes associated with risk score. (B) The construction of a clustering dendrogram of the top 5000 most variable genes by an adjacency matrix. (C) Module-clinical traits relationship. Each column showed a module characteristic gene; each column corresponds to a clinical trait. Each cell contained the corresponding correlation (upper number) and P-value (lower number). (D) GO and KEGG functional enrichment analysis of genes in the brown module. (E) GO and KEGG functional enrichment analysis of genes in the turquoise module.
Next, we adopted weighted correlation network analysis (WGCNA) to obtain feature correlation modules based on approximately scale-free characters. The top 5000 most variable genes estimated via median absolute deviation (MAD) were used to perform WGCNA analysis. The optimal soft threshold power was selected to compute the adjacency matrix and the largest 20 adjacency matrices, the largest complement of 20. The adjacency matrix was used to construct the cluster dendrogram; 8 color modules (green, blue, turquoise, brown, red, black, yellow, and gray) were recognized (Figure 4B). Uninvolved genes were transferred to the grey module for downstream investigation.
The correlation analysis of clinical traits was performed using the modular features constructed via WGCNA analysis to assess the modular-trait relationship. The 3 modules (brown, black, and turquoise) were largely and positively related to the RNA processing gene-based risk score (|R| > .15, P < .05, Figure 4C), which suggests that the genes in these modules may perform basic biological roles associated with prognostic characteristics. Therefore, a gene functional enrichment investigation was performed in every module to determine the biological function of risk score-related modules. The most abundant terms in the brown module genes were homologous recombination, Fanconi anemia pathway, cell cycle, microtube motor activity, DNA-dependent ATPase activity, ATPase activity, chromosomal region, spindle, condensed chromosome, organelle fission, nuclear division, chromosome segregation, indicating the role of the brown module in the cell cycle (Figure 4D). The genes in the turquoise module were associated with protein digestion and absorption, ECM-receptor interaction, collagen-containing extracellular matrix, focal adhesion, collagen binding, extracellular matrix component, extracellular matrix structural constituent, growth factor binding, endoplasmic reticulum lumen, extracellular matrix organization, extracellular structure organization, and cell-substrate adhesion (Figure 4E). In the absence of sufficient gene enrichment in the black modules, no functional enrichment analysis was performed. These findings suggest that RNA-processing genes based on risk scores were involved in multiple and important mechanisms associated with tumour malignancy phenotypes (proliferation, cell cycle, and metabolism).
Expression and clinical features of RNA processing-related prognostic features
All 1033 colon cancer samples were combined to identify the clinical characteristics and expression of prognostic signals associated with RNA processing. The expression of all 10 prognostic gene markers identified via Cox regression analysis and LASSO varied significantly between the 2 risk groups (Figure 5A and B). Risk-related genes indicated higher levels of expression in patients with high risk score. In contrast, the expression of protective genes was higher in patients with low risk scores (Figure 5A and B).
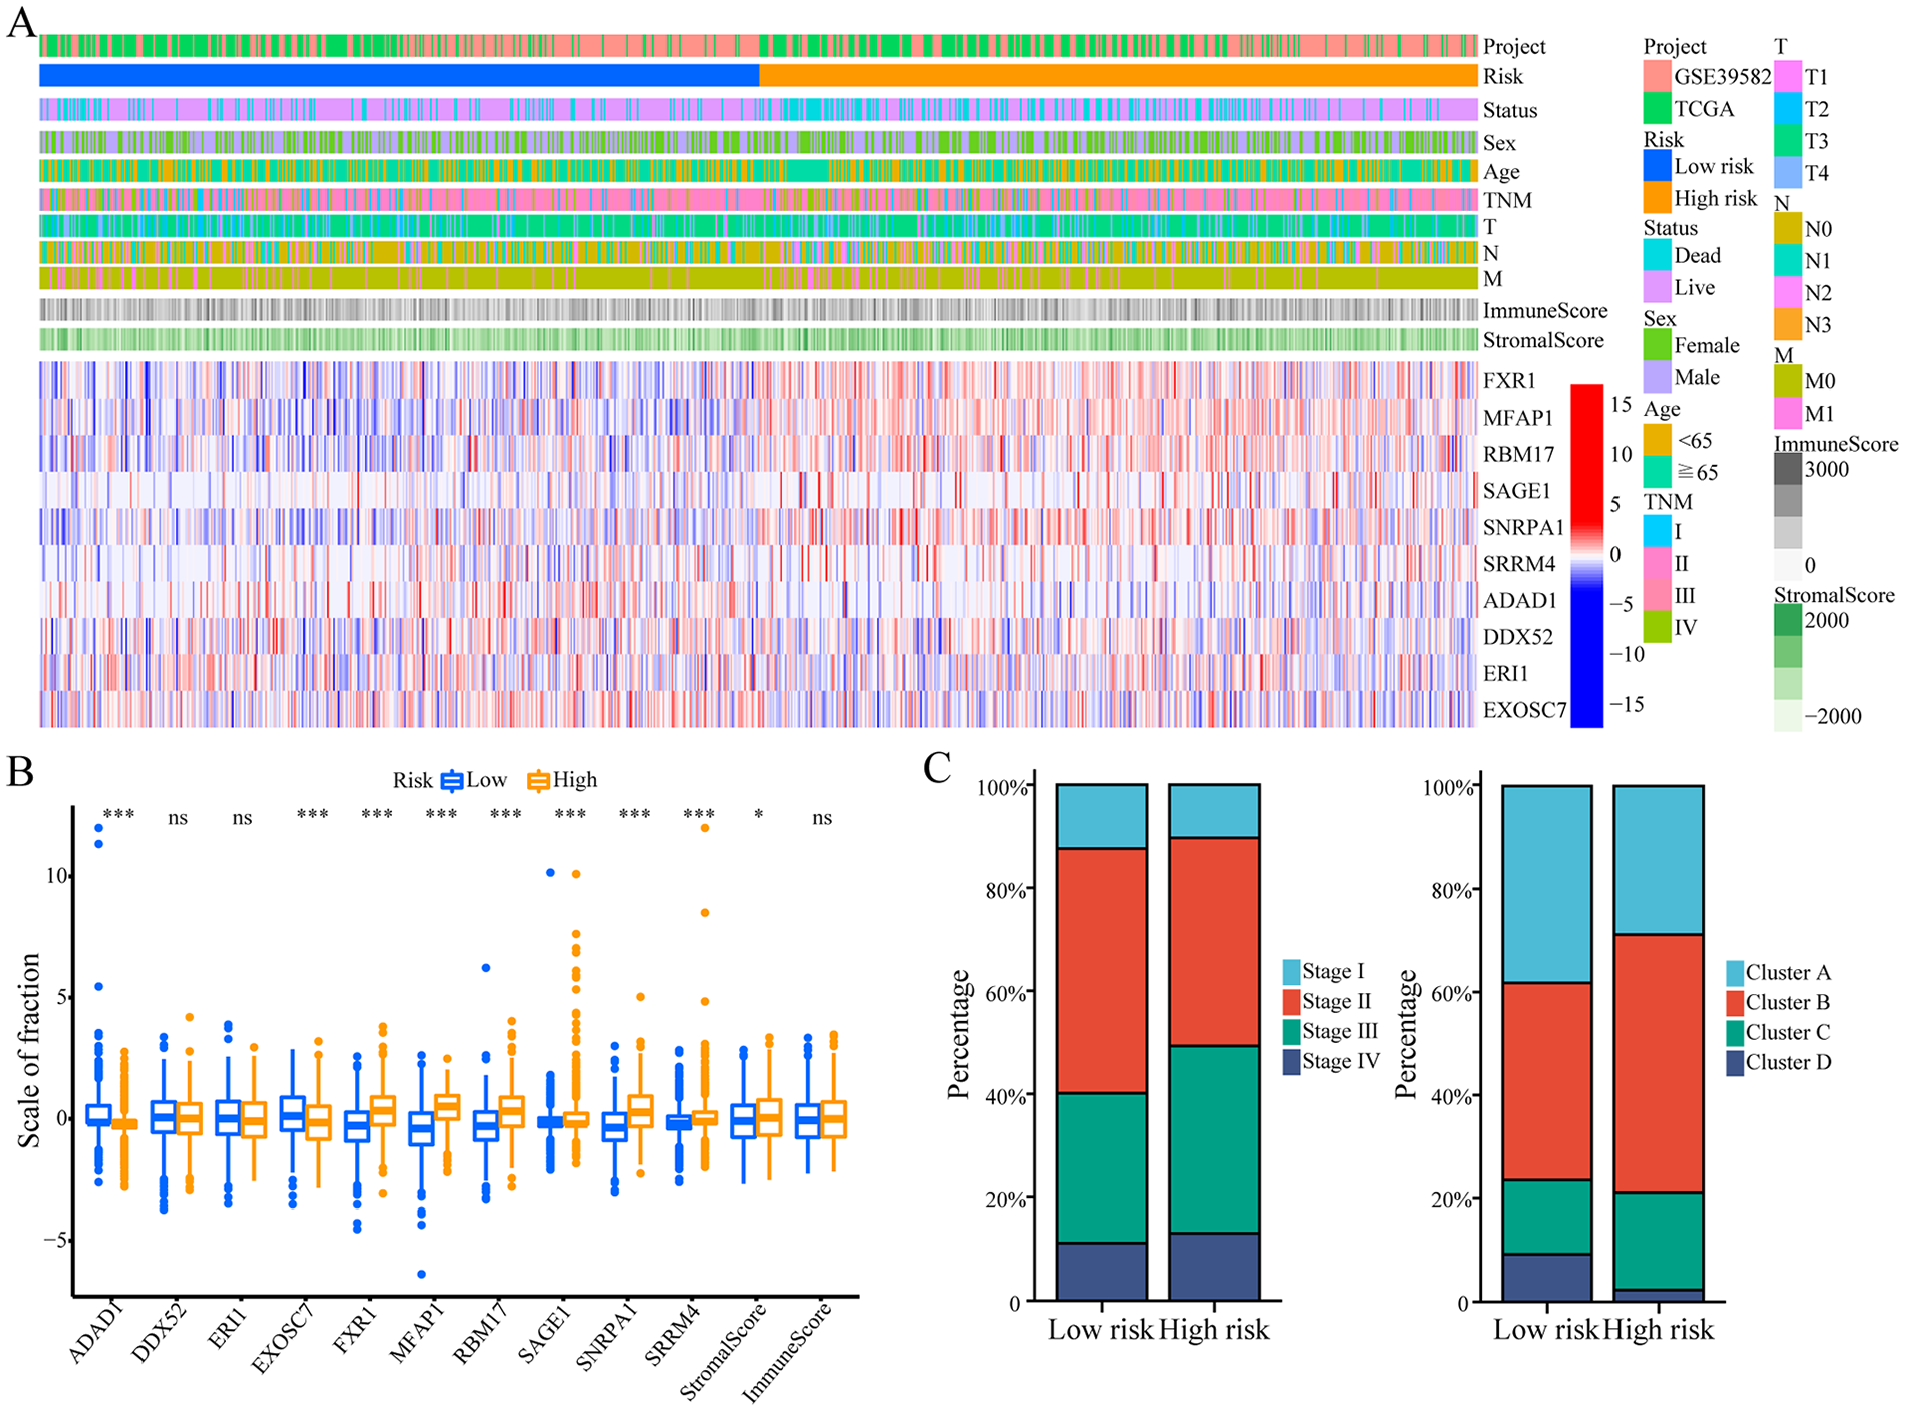
Expression and clinical features of RNA processing-related prognostic features. (A) The expression patterns of 10 prognostic-related RNA processing genes in the entire 1033 colon cancer samples shown by the heatmap. (B) The differential expression of 10 prognostic-related RNA processing genes between the low-risk group and the high-risk group. The P value was obtained by Mann-Whitney test. (C) The distribution of TNM stages and 4 different RNA processing modes between the low-risk group and the high-risk group shown by the histogram.
In addition, the high-risk group had a higher proportion of patients with advanced tumor stages (stage III and IV) (Figure 5C). The proportions of clusters A and D with poor prognosis as well as stromal activation were higher in the high-risk group (Figure 5C).
Genetic variation and immune heterogeneity in prognostic characteristics related to RNA processing gene
Tumour mutational burden (TMB) in the TCGA database was analysed to identify the extent of genomic changes in the low- and high-risk subgroups. Figure 6 shows the TMB in different risk subgroups. In Figure 6A, the TMB of the high-risk group was significantly higher than in low-risk group (P = .018). First, the genomic data, including tumour mutations in the TCGA-COAD dataset were analysed to identify potential mechanisms of RNA processing-related prognostic features. Additional mutations are related to higher risk scores (Figure 6B). Kaplan-Meier survival analysis suggested that patients carrying low TMB (L-TMB) showed better survival than those with high TMB (H-TMB, P = .043, Figure 6C).

Genetic variation in prognostic characteristics related to RNA processing gene. (A) Violin chart of the tumor mutation burden (TMB) between low-risk and high-risk groups. (B) Scatter plot of correlation analysis between tumor mutational burden risk scores. (C) Kaplan-Meier survival curve analysis combining high and low tumor burden mutations and high and low risk scores. (D) Kaplan-Meier curves analysis for low and high TMB groups of the TCGA database. (E) TMB analysis in the low-risk group. (F) TMB analysis in the high-risk group.
Next, the synergistic effects of TMB and risk scores were evaluated in TCGA-COAD prognostic stratification. Results indicated that TMB status did not influence prognosis based on risk score. Low- and high-risk subgroups showed enormous diversity in survival in both low- and high-TMB subgroups (P = .006; Figure 6D). Overall, the outcomes suggested that risk score stratification is a potential predictor distinct from TMB.
Furthermore, Maftools was used to access colon cancer driver genes. High-risk groups showed higher TMB in colon cancer. When genes were filtered out with low-frequency mutations (5% of colon cancer samples), the top 25 driver genes with the highest frequency of alteration were further analysed (Figure 6E and F). The mutation annotation file (MAF) analysis of the TCGA cohort showed that the altered frequency of PIK3CA, APC, TP53, TIN, KRAS, SYNE1, RYR2, OBSCN, MUC16, FAT4, ZFHX4, PCLO, FBXW7, LRP2, CSMD3, DNAH5, LRP1B, DNAH11, ABCA13, and USH2A was not similar in the subgroups with low and high risk scores (Figure 6E and F). These results may provide new insights into the prognostic mechanisms of tumour risk score as well as gene mutations.
The relationship between tumour microenvironment and risk based on genes associated with RNA processing was explored to characterise immune heterogeneity, given the abundance of stromal as well as immune activation pathways in high-risk populations. The heatmap in Figure 7A shows immune cell infiltration in low- and high-risk groups. The MCP inverse algorithm was adopted to identify the proportion of immune and stromal cells in different risk groups. No substantial difference was found in stromal, estimated, and immune scores between the two groups (Figure 7B). Additionally, differential analysis of cellular components revealed higher percentages of CD8+ T cells, plasma cells, and eosinophils in samples with a low risk score than in those with a high risk score (Figure 7C). The high-risk group had a higher percentage of M0 and M1 macrophages.

Immune heterogeneity in prognostic characteristics related to RNA processing gene. (A) Heat map showing immune cell infiltration between the high-risk and low-risk groups. (B) The differential expression of stromal score, immune score and ESTIMATE score between low-risk and high-risk groups. (C) Heat map showing immune cell infiltration between the high-risk and low-risk groups. The P value was obtained by the Mann Whitney test.
Discussion
Although advances in systemic therapy have helped the overall prognosis of patients diagnosed with colon cancer, significant differences in clinical outcomes exist among patients treated similarly. Current treatment decisions and prognosis are mainly based on cancer cell-centric factors, such as the TNM staging system. RNA processing is involved in tissue-specific expression, apoptosis and maturation, immune responses, and tumor development and maintenance. Rapid advances in genomics and transcriptomics have facilitated systematic exploration of the heterogeneity of colon cancer. In this study, we identified transcriptional heterogeneity of RNA-editing genes in colon cancer based on an open database. Cluster analysis of colon cancer samples successfully identified and validated 4 RNA-edited gene-based molecules with molecular heterogeneity. Subtypes in each cluster were compared with clinical data to identify the unique molecular features of each cluster. Finally, a 10-gene RNA processing-related prognostic classifier involving FXR1, MFAP1, RBM17, SAGE1, SNRPA1, SRRM4, ADAD1, DDX52, ERI1, and EXOSC7 was identified. By combining this feature with other clinical variables, a composite prognostic nomogram was constructed to facilitate clinical practice based on TNM stage and age. The study first explains changes in RNA splicing in cancer and their role in the initiation as well as maintenance of cancer. Further, it distinguishes tumour RNA editing phenotypes, combined with transcriptome data to explore differences in heterologous RNA processing genotypes. Concurrently, by obtaining gene-like labels, the risk assessment classifier can be used to stratify the survival prognosis of patients with colon cancer in specific TNM subgroups, predict new sample categories and identify cancer subtypes. It can be used to provide classification and targeted treatment plans for patients, disease diagnosis and treatment according to specific transcriptome data, reduce cancer mortality, improve cancer life expectancy, and meet the current criteria for precision medicine. This study identified the differences in the phenotypes of RNA-edited genes in colon cancer, combined with transcriptome data to identify various phenotypes of heterologous RNA-edited genes, and provided further theoretical standards associated with potential pathogenic mechanisms of each RNA-edited gene. The new classification method combined with RNA-edited gene expression data provide detailed prognostic insights into colon cancer to predict treatment response and improve the role of traditional staging methods such as TNM.
This study provides a standard of reference for the discovery of highly sensitive and specific biomarkers for colon cancer treatment, which can predict tumour prognosis and facilitate the development of more effective anti-tumour drugs. Currently, heterozygous mutations of RNA splicing elements U2AF1, SRSF2, and SF3B1 have been reported in chronic lymphocytic leukemia, myeloid leukemia, uveal and mucosal melanoma.15-21 The study provides candidates for future research and improved treatment for colon cancer, adding to the growing understanding of RNA processing gene. Several valuable studies investigated the ten candidate RNA processing factors. Fragile X-related protein 1 (FXR1), which is highly amplified in many types of cancer, 24 is a member of the fragile X-related (FXR) family of RNA-binding proteins (RBPs). It is widely recognized that FXR1 binds to AU-rich elements (AREs) within the 3′ untranslated region (3′UTR) and enhances the stability of tumour necrosis factor alpha (TNF-α) and COX2 mRNAs. 56 Several mechanisms of FXR1 have been shown to stabilise the target mRNAs, such as MYC. 25 Microfibrillar-associated protein 1 (MFAP1) is a member of microfibrillar-associated proteins (MFAPs), which are extracellular matrix glycoproteins involved in microfibril assembly, elastinogenesis and tissue homeostasis. 26 It is presumed to be an ortholog of the Saccharomyces cerevisiae tri-snRNP protein Spp381 involved in the regulation of mRNA splicing. 57 RNA binding motif protein 17 (RBM17) binds to spliceosome and participates in the alternative splicing of mRNAs. 58 It is widely accepted that the expression of RBM17 is correlated with malignant tumors. 59 RBM17 is directly bound by tiRNA-Gly and improves the malignant activities of cancer cells via RBM17-mediated alternative splicing. 60 Sarcoma antigen 1 (SAGE1) is expressed in different histological tumors. 61 As one of the cancer/testis antigens, male germ cell proteins are expressed ectopically in different malignant tumours. SAGE1 is an ideal target in cancer immunotherapy. 62 Small nuclear ribonucleoprotein polypeptide A1 (SNRPA1) is a protein-coding gene. It is associated with mRNA splicing-major pathway. 63 SNRPA1 plays an oncogenic role by interacting with RMRP to inactivate p53 in colorectal cancer. 64 Serine/Arginine Repetitive Matrix 4 (SRRM4) is generally acknowledged as a neural-specific splicing factor, with a very low basal expression outside of the brain. 65 Head et al. 66 reported that although SRRM4 expression is low in normal non-neural tissues, in malignant tumours, it is further silenced, leading to inhibition of normal microexon inclusion. Therefore, the SRRM4 splicing program acts as a proliferation inhibitor mediated via differentiation. Adenosine deaminase domain containing 1 (ADAD1) associated with CD4+ T cells was significantly related to the prognosis of colon cancer. 67 Dead-box RNA helicase 52 (DDX52) is involved in various RNA-based processes that bind to ATP. Previous studies have shown that DDX52 expression is down-regulated in prostate cancer, lung cancer and malignant melanoma 68 Its function is mainly mediated via c-MYC pathway. 69 Exoribonuclease 1 (ERI1) is an RNA exonuclease involved in binding histone mRNA, playing a role in the decay of histone mRNA after replication. It also acts as a regulatory RNA interference (RNAi).
Immune cells are an important part of tumour microenvironment, and their number and status are important in the genesis, metastasis, and invasion of tumor. Our findings revealed no substantial difference in immune cell types among different risk groups, suggesting that the diversity of immune cell infiltration may not be the primary factor underlying the difference in prognosis among high-risk groups.
This study has limitations. First, because of the lack of clinical sample detection data specific to our own research centre, we can only provide validated results of the RNA-edited gene-based prognostic prediction model in the future to determine the prognostic efficiency of the model. Second, the role of potential RNA-edited gene prognostic markers in tumourigenesis and maintenance requires additional experimental validation and in-depth study of related mechanisms. Our research group is conducting follow-up clinical study and related experiments.
Conclusion
We constructed an RNA-edited gene-based prognostic feature classifier of colon cancer to improve the prognosis of patients with colon cancer in well-defined TNM subgroups, and was characterised by immune heterogeneity, pathway activation, clinical outcomes, and genetic variation. The study provides a rationale for the elucidating the role of RNA-editing genes and suggests the clinical role of potentially meaningful colon cancer RNA-processing factors as prognostic markers.
Supplemental Material
sj-docx-2-bmi-10.1177_11772719241258642 – Supplemental material for Characterization of RNA Processing Genes in Colon Cancer for Predicting Clinical Outcomes
Supplemental material, sj-docx-2-bmi-10.1177_11772719241258642 for Characterization of RNA Processing Genes in Colon Cancer for Predicting Clinical Outcomes by Jianwen Hu, Yingze Ning, Yongchen Ma, Lie Sun and Guowei Chen in Biomarker Insights
Supplemental Material
sj-tif-1-bmi-10.1177_11772719241258642 – Supplemental material for Characterization of RNA Processing Genes in Colon Cancer for Predicting Clinical Outcomes
Supplemental material, sj-tif-1-bmi-10.1177_11772719241258642 for Characterization of RNA Processing Genes in Colon Cancer for Predicting Clinical Outcomes by Jianwen Hu, Yingze Ning, Yongchen Ma, Lie Sun and Guowei Chen in Biomarker Insights
Supplemental Material
sj-txt-3-bmi-10.1177_11772719241258642 – Supplemental material for Characterization of RNA Processing Genes in Colon Cancer for Predicting Clinical Outcomes
Supplemental material, sj-txt-3-bmi-10.1177_11772719241258642 for Characterization of RNA Processing Genes in Colon Cancer for Predicting Clinical Outcomes by Jianwen Hu, Yingze Ning, Yongchen Ma, Lie Sun and Guowei Chen in Biomarker Insights
Supplemental Material
sj-txt-4-bmi-10.1177_11772719241258642 – Supplemental material for Characterization of RNA Processing Genes in Colon Cancer for Predicting Clinical Outcomes
Supplemental material, sj-txt-4-bmi-10.1177_11772719241258642 for Characterization of RNA Processing Genes in Colon Cancer for Predicting Clinical Outcomes by Jianwen Hu, Yingze Ning, Yongchen Ma, Lie Sun and Guowei Chen in Biomarker Insights
Footnotes
References
Supplementary Material
Please find the following supplemental material available below.
For Open Access articles published under a Creative Commons License, all supplemental material carries the same license as the article it is associated with.
For non-Open Access articles published, all supplemental material carries a non-exclusive license, and permission requests for re-use of supplemental material or any part of supplemental material shall be sent directly to the copyright owner as specified in the copyright notice associated with the article.