
Abstract
MiR-31-3p expression has been shown to be a predictive biomarker for response to anti-epithelial growth factor receptor therapy in patients with RAS wild-type metastatic colorectal cancer (mCRC). To aid in the quantification of miR-31-3p expression in formalin-fixed paraffin-embedded (FFPE) primary tumor samples from patients with mCRC, a reverse-transcription quantitative polymerase chain reaction (RT-qPCR) assay was developed and validated. Assay development included the identification of a microRNA reference standard and the determination of an appropriate relative quantification cutoff for differentiating low versus high miR-31-3p expression. Sample specimens for the validation studies included both FFPE slides and shavings. Polymerase chain reaction (PCR) efficiency and linearity, analytical sensitivity and specificity, assay robustness, reproducibility, and accuracy were demonstrated across a number of test conditions and differing quantitative PCR platforms. The data from this study provide evidence as to the feasibility of quantifying the expression of miR-31-3p from FFPE tumor tissue using a standardized RT-qPCR assay.
Introduction
Colorectal cancer is the third most common type of cancer in men and the second most common in women with an estimated 1.36 million new cases per year on a worldwide basis. 1 Median overall survival for the metastatic stage (metastatic colorectal cancer [mCRC]) has increased dramatically over the past decade due to the implementation of new therapies including the use of the anti-epithelial growth factor receptor (EGFR) antibodies cetuximab and panitumumab and the anti-vascular endothelial growth factor (VEGF) antibody bevacizumab, 2 as well as the use of more aggressive surgical approaches toward oligometastatic disease, especially in patients with liver metastases. 3 The use of the anti-EGFR antibodies cetuximab and panitumumab is restricted to extended RAS wild-type (WT) tumors because there is no clinical benefit from either therapy in patients with RAS-mutant tumors.4–7 Based on the above, current guidelines for the treatment of mCRC recommend testing for RAS mutational status prior to initiating first-line treatment in patients with mCRC. 8
Although RAS mutation is a negative predictive biomarker allowing identification of patients who will not benefit from anti-EGFR therapy, up to 30% of RAS WT patients treated with anti-EGFR therapy do not respond to treatment.7,9,10 As a result, RAS mutational status alone is unable to clearly identify responders versus nonresponders for anti-EGFR therapy. Because the side effect profile for anti-EGFR therapy, especially skin toxicity, is significant, and alternative biologic therapies are available (e.g. bevacizumab), the identification of biomarkers which enable the further personalization of the treatment in RAS WT mCRC is needed to better identify patients who will likely respond to cetuximab and panitumumab.
MicroRNAs (miRNAs) are small, noncoding RNA molecules that play a key role in the regulation of intracellular processes through posttranscriptional regulation of gene expression. Modification of miRNA gene expression contributes to most cancers through different types of alterations. 11 MicroRNA expression levels can be used as biomarkers for diagnostic, prognostic, or predictive purposes in colorectal cancer.12,13 In colorectal cancer, miR-31 is frequently upregulated in tumors compared with normal corresponding tissue. 14 Upregulation of the mature forms of miR-31, miR-31-3p, and miR-31-5p is associated with advanced disease stage and with poor response to anti-EGFR therapy based on several small retrospective studies.15–22 Several authors have also recently reported that miR-31-3p expression levels in primary tumors can predict response to anti-EGFR therapy in metastatic colorectal cancer.23–25
To enable the reliable clinical measurement of miR-31-3p expression levels in formalin-fixed paraffin-embedded (FFPE) tumor specimens to assist in the identification of patients with RAS WT mCRC who will more likely respond to anti-EGFR therapy, we have developed and validated a sensitive and specific real-time reverse-transcription quantitative polymerase chain reaction (RT-qPCR) assay to measure miR-31-3p expression in primary tumors of patients with mCRC. Herein, we describe the development and validation of this test.
Materials and Methods
Sample type and source
The miR-31-3p expression test is designed to determine the expression of the miRNA miR-31-3p in FFPE tissue obtained from primary tumors of patients with mCRC. This study was limited to the use of FFPE samples because this sample type is the current standard used in clinical practice for the analysis of RAS and BRAF mutational status in patients with metastatic colorectal cancer. The FFPE samples can be in the form of slides, shavings, or punch biopsies. To ensure an accurate determination of the level of miR-31-3p expression from the tumor, the FFPE sample was obtained from the tumor area with care taken to avoid sampling from the surrounding healthy tissues. Pathologic review of a representative hematoxylin-eosin–stained slide was performed to ensure that sufficient tumor tissue is available with at least 20% tumor cell content.
Sample materials used for this study included archival FFPE tumor samples (slides only) from consented subjects enrolled in the FIRE-3 (NCT00433927) and PICCOLO (ISRCTN93248876) prospective, randomized clinical trials, and tumor samples (shavings only) received by Laboratoire CERBA from patients being tested as a part of routine care. Laboratoire CERBA is authorized by the French Ministry of Health to use residual testing material for scientific purposes (N°AC-2015-2418). Characteristics associated with individuals whose FFPE tumor samples were used for this study are shown in Supplementary Tables 1 and 2.
Sample preparation and RNA extraction
Total RNA was extracted from the tumor sample using a dedicated kit design for FFPE samples and subsequent quantitative polymerase chain reaction (qPCR) reactions (Table 1). All kits were used in accordance with manufacturer’s instructions. Studies demonstrated that the miRNeasy FFPE, AllPrep DNA/RNA FFPE, and QIAsymphony RNA kits (Qiagen, Hilden, Germany) and Maxwell 16 LEV RNA FFPE kit (Promega, Madison, WI, USA) are compatible with the miR-31-3p quantification method described below (data not shown).
RNA extraction kits validated for use with the miR-31-3p quantification assay.

Following total RNA extraction, quantity and quality evaluations were performed using capillary electrophoretic RNA qualification with a Fragment Analyzer (AATI, Evry, France), Bioanalyzer (Agilent, Les Ulis, France), Experion (Bio-Rad Laboratories, Hercules, CA, USA) and/or via UV absorbance with a NanoDrop Spectrophotometer (Thermo Fisher Scientific, Waltham, MA, USA). To be accepted for further testing, samples were required to have a significant amount of both small RNAs and miRNAs between 20 and 200 nucleotides.
Preparation of reference standards
FirstChoice® Human Brain Total RNA (Ambion, Austin, TX, USA) was used as a reference for performing standard curves. The reference standard was diluted in nuclease-free water to obtain 4 different quantities for reverse transcription (RT) (details in Supplementary Appendix 1).
miR-calibrator selection and miR-calibrator expression stability
A comprehensive literature review and microarray studies of FFPE mCRC tumor samples were performed to identify an appropriate miRNA to use for the normalization of miRNA RT-qPCR data obtained from the miR-31-3p expression quantification test. The reference gene selected had the lowest standard deviation for the average cycle threshold (Ct) value for a single quantity of human colorectal total RNA tested. After identification of the miR-calibrator, its stability was then qualified by testing 189 FFPE mCRC tumor samples from 160 slides and 29 shavings.
Reverse transcription
MiR-31-3p expression was quantified using FFPE-extracted RNAs via RT followed by real-time qPCR. Reverse transcription reactions contained 30 ng of total RNA including either the miRNA or different quantities of the reference standard (see above), stem-loop RT primer miR-31-3p/miR-calibrator, RT buffer, 0.25 mM of each deoxynucleotide (dNTP) Solution Mix, 3.33 U/µL of MultiScribe Reverse Transcriptase (Applied Biosystems, Foster City, CA, USA), and 0.25 U/µL of the ribonuclease inhibitor from the TaqMan MicroRNA Reverse Transcription Kit (Applied Biosystems). The 15-µL reactions were incubated in an 9700 Thermal Cycler (Applied Biosystems) or SimpliAMP Thermal Cycler (Applied Biosystems) for 30 minutes at 16°C, 30 minutes at 42°C, 5 minutes at 85°C, and then held at 4°C.
qPCR step
Real-time polymerase chain reaction (PCR) was performed using a standard TaqMan PCR protocol on ABI 7900HT, StepOnePlus, QuantStudio 5 (Applied Biosystems) or the LightCycler 480 Instrument II (Roche Diagnostics, Pleasanton, CA, USA). The 15-µL PCR included 2.7-µL complementary DNA RT product, TaqMan Universal PCR Master Mix, no UNG (Applied Biosystems), and TaqMan Small RNA Assay (Applied Biosystems). The reactions were incubated in a plate at 95°C for 10 minutes, followed by 40 cycles of 95°C for 15 seconds and 60°C for 1 minute. All reactions, including no-template controls (NTCs), were run in duplicate.
Data analysis
Data analysis for instruments from Applied Biosystems was performed using the instrument’s qPCR software set at automatic mode as the baseline. The threshold was manually configured to 0.2 for both miR-31-3p and the miR-calibrator (Y-axis is logarithmic scale). Data analysis for the LightCycler 480 Instrument II was performed using the second derivative method with the baseline and threshold set automatically.
Expression levels were normalized using the Human Brain Total RNA via the ∆∆Ct method. The difference between miR-31-3p Ct and the miR-calibrator Ct for each sample was compared with the difference between miR-31-3p Ct and the miR-calibrator Ct of the Human Brain Total RNA standard. This method enabled the determination of the relative quantification (RQ) for miR-31-3p expression. RQ was calculated using the following formulas:

Cutoff determination
The cutoff value for determining high versus low miR-31-3p expressers was established using tumor samples from a cohort of 189 patients with RAS WT mCRC enrolled in a phase 3 prospective, randomized trial designed to assess the benefits of adding the anti-EGFR agent, panitumumab plus chemotherapy versus chemotherapy alone in second-line treatment of mCRC.24,26 The cutoff was determined based on the identification of a threshold value for miR-31-3p expression in this patient cohort where a differential treatment effect between low miR-31-3p expression and high miR-31-3p expression patient populations was observed regarding progression-free survival (PFS). Five quantiles of miR-31-3p expression levels from the 60th to 80th percentiles were tested as a threshold to define 2 subgroups of subjects with miR-31-3p expression level above and below the quantile. To assess the relevance of each quantile value as a potential cutoff, treatment hazard ratios with their 95% confidence intervals (CIs) were estimated separately for each of the 2 subgroups using Cox model adjusted for BRAF mutational status, and the homogeneity of treatment effect was tested across the subgroups through an interaction test.
PCR efficiency and linearity
Polymerase chain reaction efficiency and linearity were assessed using a range of sample quantities of human brain total RNA (200, 100, 50, 0.5, 0.05, 0.005, and 0.0005 ng) in the RT reaction. The acceptance criteria for PCR efficiency were 90% to 110% for each assay, corresponding to a slope of −3.6 to −3.1. The acceptance criteria for linearity were (a) a slope of −3.6 to −3.1, (b) a constant ∆∆Ct mean value with a maximum variation of 10%, and (c) a r2 ≥ 0.99 for each individual assay standard curve. Two curves were obtained, one for each miRNA assay.
Analytical sensitivity (limit of detection and limit of quantification)
The limit of detection and limit of quantification for the test was assessed using 7 differing quantities of human brain total RNA (200, 100, 50, 0.5, 0.05, 0.005, and 0.0005 ng). The limit of detection was defined as the lowest quantity detected above the NTC. The limit of quantification was defined as the smallest amount of the miRNAs detectable and quantifiable within the linearity range.
Analytical specificity
The analytical specificity for the miR-31-3p quantification method was determined by assessing the ability of the qPCR assay to detect the appropriate target sequence for miR-31-3p compared with miR-31-5p. miR-31-5p is a nonspecific target that can be found in FFPE tumor samples from patients with mCRC and can be cotranscribed with miR-31-3p.
Intrareproducibility (repeatability)
Repeatability of the miR-31-3p method was assessed by analyzing the same samples several times. Intrareproducibility was determined for 2 RNA samples by measuring miR-31-3p expression after undergoing 8 RT reactions for each sample. The first sample was known to correspond with low miR-31-3p expression (Ct miR-31-3p > 30 Ct) and the second sample was known to correspond to high miR-31-3p expression (Ct miR-31-3p < 28 Ct). The qPCR was performed on the same PCR plate.
Interreproducibility (reproducibility)
Interreproducibility was measured by conducting 8 separate RT reactions, each performed on 2 RNA samples similar to the intrareproducibility (repeatability) studies referred to above. The qPCR testing was performed at 2 different laboratories by 2 different operators.
Interreproducibility was also measured using 10 separate FFPE shaving samples from tumors with each of the samples undergoing RNA extraction and run at 2 different labs. The RQ values and standard deviation were calculated across intrarun replicates. For the first lab (R&D laboratory), approximately 15 mg of biological material was used in extraction process. RNA extraction was performed using the miRNeasy kit extraction and a commercial deparaffinization solution (Qiagen) with automated extraction using a QIAcube (Qiagen). Real-time PCR was performed using a StepOnePlus (Applied Biosystems). For the second lab (clinical reference lab), approximately 50 mg of biological material was used in extraction process. RNA extraction was performed using the AllPrep DNA/RNA FFPE kit extraction with extraction/deparaffinization completed using a Xylene solution using a manual extraction method. Real-time PCR was performed using a LightCycler 480 II (Roche Diagnostics).
Finally, interreproducibility was assessed by measuring miR-31-3p expression from samples at differing time intervals between 18 and 24 months. MiR-31-3p expression levels were determined for RNA extracted from 157 FFPE tumor samples initially (in triplicate) and then after 18 to 24 months by the same laboratory technician using the same qPCR equipment (7900HT). A standard Bland–Altman plot was used as a method of choice for measuring agreement between the 2 quantifications. 27
Robustness
The qPCR reactions were run with 2 samples with each sample having differing level of miR-31-3p expression. The following operating conditions were varied: (a) qPCR reactions were performed with varying annealing/synthesis temperatures of 59°C, 60°C (standard conditions), and 61°C; (b) qPCR was performed with 80% of Master Mix; and (c) qPCR was performed with Master Mix stored at different temperatures including −20°C, 4°C (normal condition), and at room temperature.
Accuracy
Accuracy was tested via the standard addition method. Three known copy numbers of miR-31-3p, specifically 15, 150, and 1500 copies (custom-manufactured miRNA: UGCUAUG CCAACAUAUUGCCAU; Exiqon A/S, Vedbaek, Denmark) were added to 4 low-content RNA samples in RT reaction. The calculated miR-31-3p copy numbers added to the qPCR reactions were 3, 30, and 300 copies. Based on the above, the final measured RQ was expected to increase 10-fold for each sample in line with the increasing copy number.
qPCR system comparison
The potential impact of differing qPCR platforms on miR-31-3p expression quantification was tested using RNA extracted from 6 FFPE tumor samples tested in duplicate. Six clinical specimens with known miR-31-3p expression levels were tested on 4 different qPCR instruments including an ABI 7900HT, 2 separate StepOnePlus machines installed in 2 different laboratories, and a QuantStudio 5. A standard Bland–Altman plot and correlation coefficient were used to measure the agreement in results obtained from the 4 qPCR instruments. 27
Results
miR-calibrator selection and expression stability
Following a literature review and analysis of microarray data from FFPE mCRC tumor samples, several potential miRNA reference candidates were identified. Validation via RT-qPCR testing was performed (data not shown) to ensure stability of the reference miRNAs across differing mCRC tumor tissue samples. This included 160 FFPE tumor samples obtained from slides and 29 samples from shavings. The most stable miRNA reference (miR-calibrator) was selected based on the results of these studies. The miR-calibrator selected had the lowest standard deviation of all miRNA reference candidates tested, with an SD of 0.72 for FFPE slides and 0.99 for FFPE shavings. Figure 1 shows the Ct distribution for the selected miR-calibrator obtained from FFPE samples from both slides and shavings.

Distribution of expression of housekeeping miR-calibrator following reverse-transcription quantitative polymerase chain reaction analyses for (A) FFPE slides (n = 160) and (B) FFPE shavings (n = 29). CI indicates confidence interval; FFPE, formalin-fixed paraffin-embedded; HR, hazard ratio.
Cutoff determination
A cutoff value for miR-31-3p expression level was defined to enable the identification of 2 subgroups of patients with mCRC with differential anti-EGFR treatment effect. Five quantiles of miR-31-3p expression levels from the 60th to 80th percentiles were tested as a threshold to define 2 subgroups of subjects with miR-31-3p expression level above and below the quantile. For each of the threshold quantiles tested, anti-EGFR therapy was beneficial in terms of PFS for patients with low miR-31-3p expression but not for subjects with high expression (Figure 2A). This differential treatment effect for “low” versus “high” expressers was maximal when the subgroups were defined using the 80th percentile as a threshold, indicating a predictive value of miR-31-3p. To maintain a reasonable sample size for each subgroup, the 70th percentile, corresponding to a miR-31-3p expression RQ of 1.36 compared with the reference sample, was selected as the cutoff because the P value for the interaction test became inferior to 0.2 between the 70th and the 75th percentiles (Figure 2B) and the hazard ratio point estimate in high expressers became greater than 1, suggesting a lack of benefit of anti-EGFR therapy in the 30% of subjects with higher miR-31-3p expression.

Determination of cutoff threshold value for differentiation of high and low miR-31-3p expressers. Cutoff determination based on screening from 60th to 80th percentiles of miR-31-3p expression level. (A) The comparison of treatment hazard ratio by miR expression quantile and (B) the results of homogeneity testing for treatment effect according to the defined thresholds. The cutoff threshold value selected for the miR-31-3p expression quantification test corresponds to the 70th percentile.
PCR efficiency and linearity
Based on the mean values for slope and r2 across 2 runs for miR-31-3p and the housekeeping miRNA, the average PCR efficiency and linearity across 2 runs met the predefined PCR efficacy (90% to 110%, slope −3.6 to −3.1) and coefficient of determination (r2 ≥ 0.99) requirements for the range (0.05-200 ng) of reference human brain RNA tested (see Table 2 and Figure 3).
PCR efficiency and linearity for miR-31-3p and miR-calibrator.

Abbreviation: PCR, polymerase chain reaction.

Polymerase chain reaction efficiency and linearity for miR-31-3p and miR-calibrator. Each point represents the mean Ct across 2 runs. The calculation was based on 6 data points instead of 7 data points as no amplification was seen for miR-31-3p at 0.005 ng total RNA. Ct indicates cycle threshold.
Analytical sensitivity (limit of detection and limit of quantification)
Amplification was seen for both miR-31-3p and the miR-calibrator for all concentrations except 0.005 ng total RNA. As a result, only 6 of the 7 data points were used for calculations. None of the NTC PCR reactions showed positive amplification plots. Our results indicate that the limit of quantification for miR-31-3p and the miR-calibrator was 0.05 ng of total RNA, below which results are not reproducibly stable.
Analytical specificity
There was no crossreactivity (no significant change miR-31-3p Ct) for any of the samples where miR-31-5p was added (Table 3). Fluorescent signal generated during real-time PCR was not affected by miR-31-5p spiking, confirming the specificity of miR-31-3p method.
Effect of miR-31-5p spiking on miR-31-3p amplification.

Abbreviations: Ct, cycle threshold; qPCR, quantitative polymerase chain reaction.
Intrareproducibility (repeatability)
Intrareproducibility for 2 RNA samples extracted was measured from 8 RTs of the same RNA samples with one sample corresponding to a low miR-31-3p expression and the other sample corresponding to a high miR-31-3p expression. One replicate (RT8) for the sample with low expression was not considered for subsequent analysis because the difference between the 2 Ct values for the duplicates did not conform to the acceptance criteria. Evaluation of the mean RQ and standard deviation showed SD values of 0.03 (coefficient of variation [CV] = 18.9%) for the low miR-31-3p expressers and 0.28 (CV = 5.8%) for the high miR-31-3p expressers (Table 4). These results demonstrate a low deviation from the mean for all samples suggesting low intra-assay variability.
Intra-assay RQ for the miR-31-3p test.
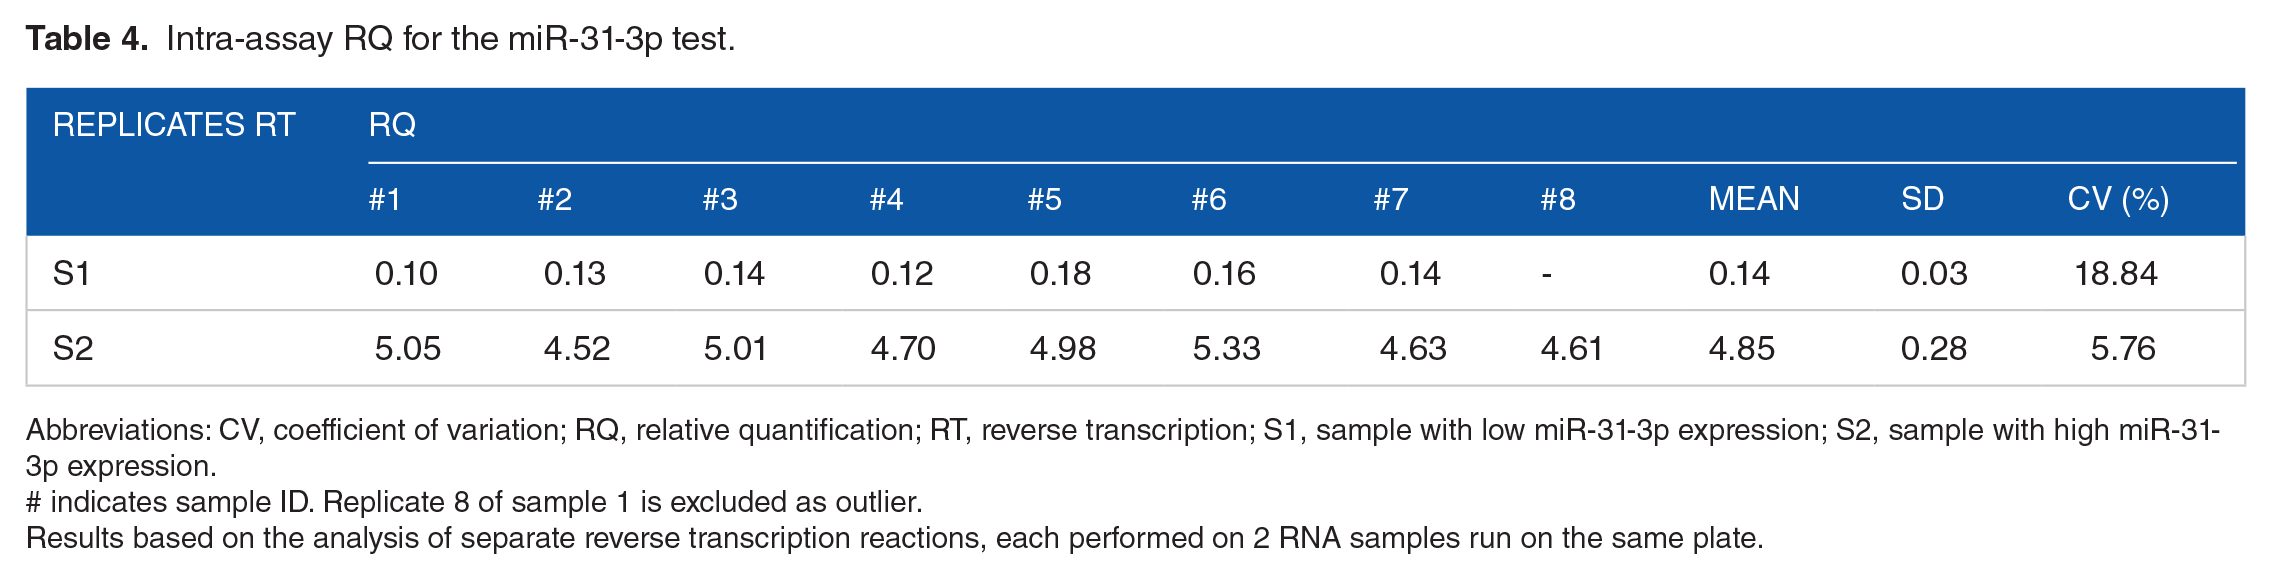
Abbreviations: CV, coefficient of variation; RQ, relative quantification; RT, reverse transcription; S1, sample with low miR-31-3p expression; S2, sample with high miR-31-3p expression.
# indicates sample ID. Replicate 8 of sample 1 is excluded as outlier.
Results based on the analysis of separate reverse transcription reactions, each performed on 2 RNA samples run on the same plate.
Interreproducibility (reproducibility)
Interrun reproducibility studies demonstrated that the miR-31-3p expression test had a high degree of precision with no significant interassay variability. The bias between 2 sets of measurements for 8 RTs from 2 different RNA samples obtained from FFPE slides was lower than the standard deviation, thus confirming no interassay variability (Table 5). The standard deviation for results obtained from 2 separate RNA extractions run in duplicate from 10 separate FFPE-extracted RNA samples ranged from 0.07 to 1.61 (Table 6). Of note is that only samples with an RQ of more than 2.53 had an SD value greater than 1. For paired FFPE samples run between 18 and 24 months, 93.6% had a standard deviation of less than 1 (Figure 4). The Bland–Altman analysis showed narrow limits of agreement with respect to RT-qPCR variability (bias is extended from +2 to −2 SDs).
Interassay RQ for the miR-31-3p test and measurement of testing bias using Bland–Altman statistical analysis.
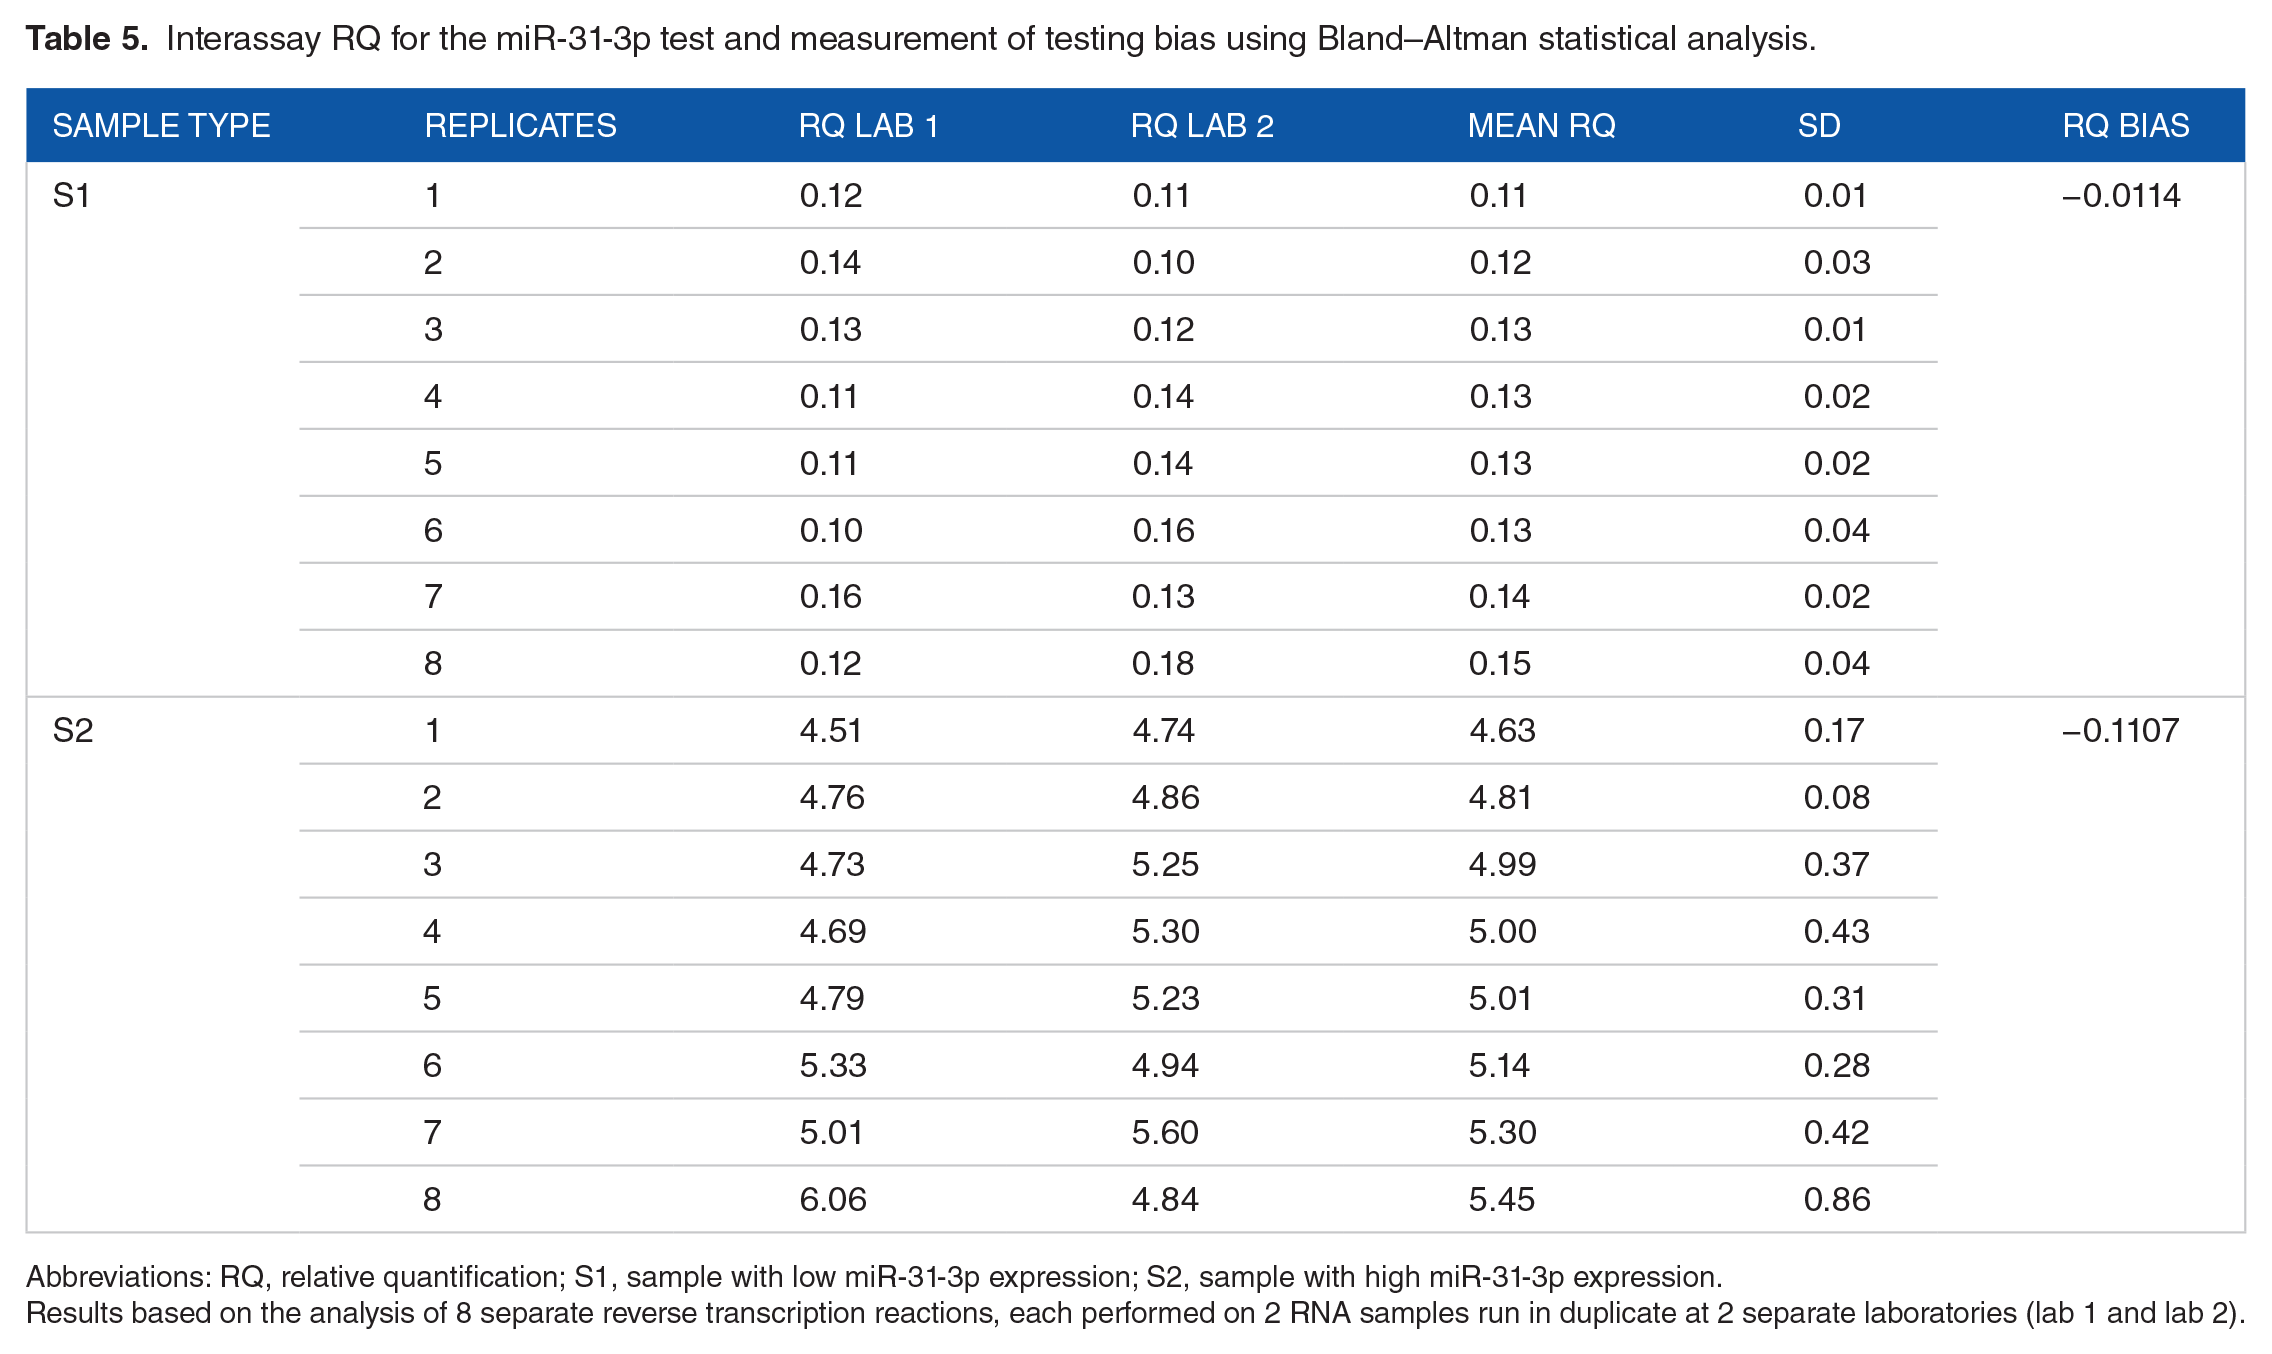
Abbreviations: RQ, relative quantification; S1, sample with low miR-31-3p expression; S2, sample with high miR-31-3p expression.
Results based on the analysis of 8 separate reverse transcription reactions, each performed on 2 RNA samples run in duplicate at 2 separate laboratories (lab 1 and lab 2).
Interassay RQ for the miR-31-3p test.

Abbreviations: RQ, relative quantification.
1, 3, 6, 7, 8, and 10 were samples with low miR-31-3p expression; 2, 4, 5, and 9 were samples with high miR-31-3p expression.
Results based on the analysis of 2 separate RNA extractions from 10 different FFPE samples (shavings) at 2 separate laboratories (lab 1 and lab 2).

Distribution of standard deviations (SDs) for 157 individual FFPE tumor sample pairs run between 18 and 24 months.
Robustness
The miR-31-3p quantification was determined to be highly robust based on RQ results from samples run in duplicate across a variety of operating conditions (Figure 5).

Box plots for studies measuring the robustness of miR-31-3p assay. RQ was measured under varying operating conditions for (A) FFPE samples known to have high miR-31-3p expression and (B) FFPE samples known to have low miR-31-3p expression. MM indicates Master Mix qPCR; REF, reference (normal condition); y-axis, RQ values; x-axis, varying experimental conditions analyzed. Boxes: interquartile range/whiskers (25th percentile to 75th percentile), central line is the median; small lines: outside values (minimum and maximum).
Accuracy
Samples containing 3 added copies of miR-31-3p were below the detection limit (Ct > 37). The RQs measured for the samples with 300 added copies, compared with the samples with 30 added copies, were in line with the expected 10-fold increase (average RQ = 9.37; 95% CI: 8.15-10.53; n = 8).
qPCR system comparison
There was a very high concordance (r2 > 0.98) for the results obtained for the miR-31-3p quantification assay between the 4 qPCR platforms tested (Table 7). A single sample (S5) with a mean RQ of 24.74 demonstrated significant variability across the various platforms. Because the cutoff separating low versus high expressers of miR-31-3p is an RQ 1.36, it was concluded that the significant variability for samples with a high RQ would not affect the determination of clinical miR-31-3p expresser status and sample S5 was not included in the analysis below.
RQ results for the miR-31-3p quantification assay across differing qPCR platforms.

Abbreviations: qPCR, quantitative polymerase chain reaction; RQ, relative quantification; S, sample.
The mean bias, standard deviation, and CIs from the comparison of results between the 4 qPCR platforms tested are shown in Table 8. The bias of the qPCR platforms associated with the measurement of miR-31-3p expression ranged from −0.47 (the lower limit of the bias interval between the StepOnePlus [Platform 2] and the QuantStudio5 [Platform 4]) to +0.64 (the higher limit of the bias interval between the StepOnePlus [Platform 2] and the 7900HT [Platform 3]). The Bland–Altman analysis showed narrow limits of agreement with respect to equipment variabilities (bias is extended from +2 to −2 SDs). Test results demonstrated an excellent correlation and a low equipment bias for low RQ values up to and including the RQ 1.36 cutoff value.
Comparison of mean bias for the miR-31-3p quantification assay across differing qPCR platforms.

Abbreviations: CI, confidence interval; LLOA, lower limit of agreement; qPCR, quantitative polymerase chain reaction; ULOA, upper limit of agreement.
Discussion
Our data demonstrate that the quantification of miR-31-3p expression using the standardized RT-qPCR assay described above is feasible, sensitive, specific, and reproducible. The assay was developed and validated to enable the relative quantification of miR-31-3p expression in FFPE tumor samples from primary tumors of patients with mCRC.
The performance of the assay was also validated in 5 separate lab settings using differing qPCR systems and lab technicians under a variety of operating conditions. Our results demonstrate that there was no significant bias in test results between the differing qPCR platforms tested. Based on these findings, running this miR-31-3p expression quantification assay on the systems tested is acceptable for clinical practice.
Acceptable RT-qPCR results were obtained from FFPE tissue samples obtained from both slides and shavings with the amount of material required to perform the assay in line with what is typically available for clinical testing from the intended patient population. The requirement for routine RAS testing of primary tumors from patients with mCRC also facilitates the availability of the appropriate FFPE tissue samples for running the miR-31-3p quantification assay.
Several authors have recently reported the ability of miR-31-3p expression to predict response to anti-EGFR therapy for patients with RAS WT mCRC.23–25 From a clinical interpretation perspective, patients with RAS WT mCRC whose tumors have a low expression of miR-31-3p (RQ < 1.36) experience an improved response to anti-EGFR therapy when used in first-line when compared with anti-VEGF therapy. 25 Low miR-31-3p expressers also have a better response to anti-EGFR therapy versus chemotherapy alone when used for second or further lines of treatment.23,24 The patients with RAS WT mCRC whose tumors have a high expression of miR-31-3p (RQ ≥ 1.36) have a similar response to first-line anti-EGFR and anti-VEGF therapy. 25 High miR-31-3p expressors also have a better response to chemotherapy alone versus anti-EGFR therapy when used for second or further lines of treatment.23,24 A recent prospective-retrospective study of 370 patients with KRAS WT mCRC which assessed miR-31-3p expression using the above cutoff reported that 66.2% of FFPE samples tested had low miR-31-3p expression and 33.8% of the samples tested had high miR-31-3p expression. 25 The assay described herein will enable the ability to differentiate low and high miR-31-3p–expressing primary tumors enabling clinicians to further personalize the use of anti-EGFR therapy in this patient population.
Based on the results of our validation studies for the miR-31-3p quantification assay, samples which meet all the acceptance criteria (Table 9) can be interpreted as having either low or high miR expression level based on their RQ. Result of the assay can be considered “indeterminate” if no RQ value is obtained or if acceptance criteria are not met.
qPCR acceptance criteria for miR-31-3p quantification assay.

Abbreviations: Ct, cycle threshold; NTC, no-template control; qPCR, quantitative polymerase chain reaction.
There are several potential limitations to our studies. The accuracy data we report are preliminary and additional validation studies are needed to compare the results we obtain with other techniques or through the introduction of a synthetic standard curve. Also, although the TaqMan probes we selected were chosen as they have reduced crossreactivity and increased specificity, we have not conducted specificity studies for additional miRNAs which have similar sequences to miR-31-3p.
The data from this study provide evidence as to the feasibility of quantifying the expression of miR-31-3p from FFPE tumor tissue using a standardized RT-qPCR assay. The results from this test demonstrate both reproducibility and robustness across differing sample types, testing conditions, and qPCR platforms. This method provides a sensitive, specific, and analytically precise assay for the clinical measurement of miR-31-3p from FFPE tumor samples.
Supplemental Material
Supplementary_Material – Supplemental material for Technical Validation of a Reverse-Transcription Quantitative Polymerase Chain Reaction In Vitro Diagnostic Test for the Determination of MiR-31-3p Expression Levels in Formalin-Fixed Paraffin-Embedded Metastatic Colorectal Cancer Tumor Specimens
Supplemental material, Supplementary_Material for Technical Validation of a Reverse-Transcription Quantitative Polymerase Chain Reaction In Vitro Diagnostic Test for the Determination of MiR-31-3p Expression Levels in Formalin-Fixed Paraffin-Embedded Metastatic Colorectal Cancer Tumor Specimens by Lucas Ramon, Catherine David, Karine Fontaine, Elodie Lallet, Charles Marcaillou, Séverine Martin-Lannerée, Virginie Decaulne, Céline Vazart, Anne-Héloise Gélibert, Raouf Ben Abdelali, Jean-Marc Costa, Francis Rousseau, Raphaële Thiébaut, Larry Yost and Yann Gaston-Mathé in Biomarker Insights
Footnotes
Acknowledgements
The authors would like to thank Delphine Le Corre from the University Paris Descartes as well as Stéphanie Maillard and Sylvain Dugat from IntegraGen for their assistance with the experimental design for the interplatform evaluation.
Funding:
The author(s) disclosed receipt of the following financial support for the research, authorship, and/or publication of this article: The authors disclose receipt of financial support from IntegraGen SA for the research presented in this publication including study design, collection, assays, analysis, interpretation of data, and writing of the manuscript. The authors are fully responsible for the content of this manuscript, and the views and opinions described in the publication reflect solely those of the authors.
Declaration of Conflicting Interests:
The author(s) declared the following potential conflicts of interest with respect to the research, authorship, and/or publication of this article: The experiments conducted for the data reported were performed by either IntegraGen SA or Laboratorie CERBA SA. IntegraGen SA completed the statistical analyses for the data reported. L.R., S.M-L., C.M., E.L., K.F., C.V., V.D., and YG-M are employees of IntegraGen SA. F.R. and R.T. were employees of IntegraGen SA when these studies were conducted. A-H.G., J-M.C., and R.B.A. are employees of Laboratoire CERBA SA. C.D. is a paid consultant for IntegraGen SA. L.Y. is an employee of IntegraGen, Inc.
Author Contributions
LR, RT, FR, CD, CM, and KF designed the studies and experiments reported in this manuscript. CV, EL, VD, A-HG, and LR conducted the experiments described. LR, CD, SM-L, J-MC, RBA, and YG-M analyzed the data reported. LR, CD, SM-L, and LY drafted the manuscript. LR, CD, LY, and YG-M coordinated review of the manuscript and manuscript revisions. All authors read and approved the final version of the manuscript.
References
Supplementary Material
Please find the following supplemental material available below.
For Open Access articles published under a Creative Commons License, all supplemental material carries the same license as the article it is associated with.
For non-Open Access articles published, all supplemental material carries a non-exclusive license, and permission requests for re-use of supplemental material or any part of supplemental material shall be sent directly to the copyright owner as specified in the copyright notice associated with the article.